Functional Magnetic Resonance Imaging
Mark S. Cohen
Susan Y. Bookheimer
Introduction
The signal derived from magnetic resonance has dynamic properties that make it possible to derive physiologic information from a series of otherwise static images. The field of functional magnetic resonance imaging (fMRI) encompasses the study of such time series to interrogate otherwise covert brain processes. In both the clinical management of epilepsy and in understanding its fundamental etiology, fMRI has become an important component of the epileptologist’s toolkit. In particular, fMRI applications using cognitive activation paradigms include attempts to determine language laterality, measure hippocampal function in the affected and unaffected hemisphere, and contribute to diagnosis of the epileptic focus. A growing interest in multimodality imaging—particularly in combining fMRI with electroencephalographic (EEG) measures—suggests the potential for functional identification of epileptogenic zones while maintaining the MRI advantage of a relatively simple, quick, and noninvasive diagnostic procedure that is cost effective when placed in the context of other available tests. This chapter offers an introductory explanation of the fMRI method and reviews its use in clinical practice. It then addresses the likely directions for technical improvements that may ultimately make fMRI a truly comprehensive method for seizure focus localization, offering both guidance to neurosurgery and perhaps a proxy measure for medical treatment without surgery.
Static (structural) imaging by magnetic resonance imaging is capable of showing diagnostic features in the epileptic brain such as polymicrogyria, cortical dysplasias, and atrophic change in the more common mesial temporal lobe (MTL) epilepsies with great precision and resolution and is an essential part of the workup for any surgical intervention and indeed for considering the possibility of resective treatment at all.
Functional MRI is now a well-accepted method that takes advantage of the coupling between neuroelectric activity and blood flow to offer a window into the spatial distribution of brain activity. It is used widely in the cognitive neurosciences to characterize the engagement of various brain regions in tasks from visual perception to abstract cognition and ethical decision making. The sensitivity of fMRI is such that it is also possible to localize eloquent cortex at the single-subject level, making it an attractive means of performing clinical diagnostic examinations. Increasingly, fMRI has become an integral part of the surgeon’s planning for resection of tumors or arteriovenous malformations because it offers reliable guidance as to which structures must be avoided to retain maximal normal brain function. Coupled with structural imaging by MRI—and often an integral portion of the same exam—fMRI greatly improves the safety and confidence with which epilepsy can be surgically managed.
Structural images, however, frequently are not on their own sufficient either to identify any abnormality at all or to distinguish epileptogenic zones from other brain abnormalities that might be without clinical sequelae. Even quantitative analyses of MRI parameters such as T2 relaxation times or analogous analyses such as spectroscopic quantification of N-acetyl aspartate often are inadequate for this purpose for many reasons. For example, bilateral atrophic changes may be present in the MTL, whereas only one side may contribute directly to the seizure disorder, and bilateral resection would clearly be unacceptable. There is thus a need for improved imaging that might help to identify functional markers that can distinguish pathologic from normal brain. It is likely that advances in fMRI will be able to fill that role, effectively bridging the structural and functional data collections.
The Physiologic and Physical Bases of Functional Magnetic Resonance Imaging
We focus on functional signal interpretation in MRI because many excellent resources exist for learning the basic principles of magnetic resonance imaging. Nevertheless, it is useful to present a short review of the general MRI method to provide a better understanding the fMRI technique.
Hydrogen protons and several other atomic nuclei carry a small magnetic moment that gives them a preferential alignment to an applied external magnetic field. Furthermore, the nuclei have angular momentum, known as “spin” (a quantum property), which is conserved and causes them to rotate or “precess” about any applied magnetic field at a rate governed by the “gyromagnetic ratio,” which for protons is about 42.58 × 10⁶ Hertz per tesla of applied field. These two properties are exploited in collecting the magnetic resonance signal.
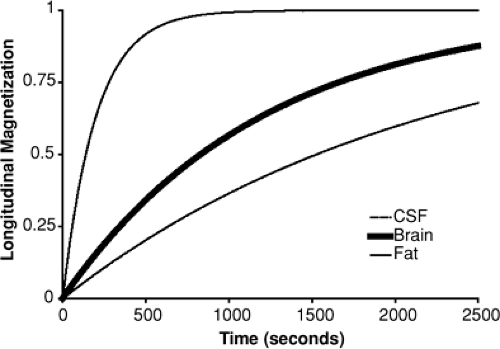 FIGURE 1. Tissues become magnetized (i.e., the proton magnetic moment reaches equilibrium) over an extended period of seconds. This so-called longitudinal relaxation rate can be characterized by a single time constant. CSF, cerebrospinal fluid. |
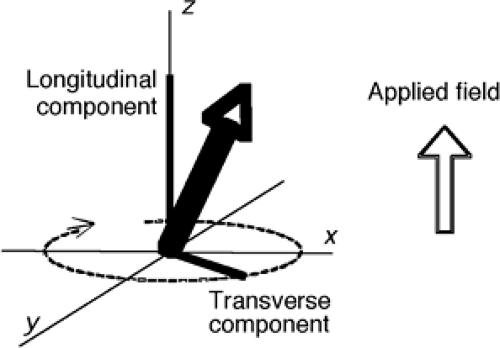 FIGURE 2. When protons are placed in a magnetic field, their angular momentum causes their magnetic moment to precess about that field. Conventionally, it is convenient to decompose the net proton magnetization into a stationary, longitudinal, component aligned in the direction of the applied magnetic field and a rotating, transverse, component that precesses about it. |
When a sample, or a patient, is placed into a magnetic field, the protons immediately realign to the new field such that their precession is about the axis of the applied field (which is conventionally called B0). However, this is not an equilibrium condition because half of the protons will have their net magnetic moment in the same direction as the applied field (spin “up”) and half will be lined up opposed to it (spin “down”), which is a lower energy state. Instead, there is a relaxation process (similar to thermal cooling) that takes some time to occur. The approach to the new equilibrium state follows an exponential time course (Fig. 1). The rate at which a tissue or other material approaches its equilibrium is considered to be characteristic of that sample and differs widely among human body tissues. The relaxation time (which is the inverse of the rate) can be conveniently and often very accurately described by a single parameter known as T1. The parameter T1 itself depends on factors such as the magnetic field strength, the temperature,
and micro and nanostructural physical properties, as well as on the presence of other magnetic or paramagnetic materials.
and micro and nanostructural physical properties, as well as on the presence of other magnetic or paramagnetic materials.
This approach to equilibrium is known a longitudinal relaxation. At equilibrium each of the individual protons will be precessing about the axis of the applied field in either the up or down direction (Fig. 2), such that the longitudinal components of their orientation are parallel. As the protons spin, however, their horizontal or transverse component is rotating within the plane orthogonal to the applied field and will be different for each of the spins in the sample. If we examine the vector sum of all of these magnetic moments, there will exist only a stationary vector in the longitudinal direction.
However, it is possible to create a condition in which the transverse components are aligned. This is performed by applying a second magnetic field (B1) rotating about the B0 field at the same rate as the spins are precessing. If the B1 field is left on for the correct duration at the correct amplitude, this can create a condition essentially equivalent to having rotated the longitudinal magnetization of the entire sample into the transverse plane, where it precesses about at a frequency determined by the gyromagnetic ratio. This time-varying signal can be detected easily by its induction of an electrical current into any nearby conductor. Typically, the signals in clinical imagers are in the range from tens to hundreds of megahertz, where they are detectable as radio energy. The B1 pulse is also therefore a “radio” signal. When applied, it moves the sample out of equilibrium (because the longitudinal component is reduced when it is rotated into the transverse plane), and it is therefore called an “excitation pulse” or an “excitatory RF (radiofrequency) pulse.” When the longitudinal component is rotated completely into the transverse plane, it is reduced to zero; this condition is known as a 90° pulse.
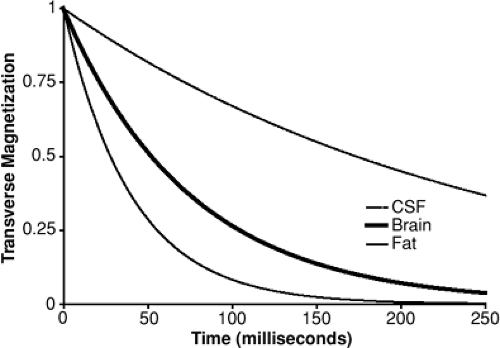 FIGURE 3. The loss of transverse coherence of multiple proton spins results in an exponential decay of the resultant magnetic resonance signal. The decay rate, T2, is tissue dependent, such that the T2 of cerebrospinal fluid (CSF), for example, is >10 times that of fat. |
Even very tiny spatial variations in the magnetic field make the condition of transverse coherence unstable because over time the differences in spin frequency cause individual spins to precess more or less rapidly than their neighbors, so that the net summed magnetic moment decays over time. Like T1, this magnetic decay rate differs among tissues and can be described efficient by a single rate constant (for each tissue), known as T2 (Fig. 3).
Because the signal strength depends on the coherence of the transverse orientation of individual spins, the process of transverse decay results in a decrease in MRI signal. The time from RF excitation to signal detection is called TE and offers a means to adjust image contrast. Specifically, with a te near zero, the signal from all tissues is independent of T2, whereas when te is increased, the signal is increasingly dominated by the tissues with the longer T2; thus, adjusting te adjusts the T2-dependent contrast.
It is also possible to adjust the degree of T1-dependent contrast in MR images. Consider the case of a series of 90° pulses. After each, no longitudinal magnetization remains. Thus, the longitudinal relaxation process must start anew. If the time between excitatory pulses is short (compared to T1), the longitudinal equilibrium will not be reached by the time of the next RF pulse, and thus the MRI signal (whose magnitude is determined by the longitudinal magnetization prior to the pulse) will be reduced. The term “tr” is used to describe the time between repeated RF pulses. In general, this means that tissues whose T1 is long compared to will have less signal (and will appear dark) compared to those whose T1 is short.
Functional Magnetic Resonance Imaging Contrast
Both T1 and T2 can be used to expose brain activity; at present, however, fMRI procedures that exploit changes in transverse
relaxation (T2) rates are most common. We present the physical principles of both methods in brief here.
relaxation (T2) rates are most common. We present the physical principles of both methods in brief here.
Like positron emission tomography (PET), single photon emission computed tomography (SPECT), and autoradiography, the ability of fMRI to detect brain activity depends on the empirical fact that increases in synaptic activity are followed by localized increases in blood flow. Current thinking is that for excitatory synapses the relationship between electrically coupled synaptic activity and blood flow is approximately linear.11,34,52 Although the deviations from linearity of the fMRI response overall are important,9,17,51,53,64 they will not be considered in detail here. Although the biophysics that couples neuronal firing and blood flow is still the matter of some controversy (see, e.g., Villringer72), the basic findings are very robust.
In its most commonly used form, fMRI is performed by using imaging protocols that confer a moderately strong T2 sensitivity to the image contrast. (More precisely, T2′ contrast is used, which emphasizes signal losses from local perturbances of the magnetic field rather than from interactions among the nuclear spins. For more detail, see, e.g., Buxton,12 Jezzard et al.,43 or the older review by Cohen and Bookheimer.18) It is well known that in its deoxygenated state, hemoglobin has a magnetic moment equivalent to four unpaired nuclear spins; when oxygen is bound to hemoglobin, there is a significant reduction in the magnetic moment (to zero).58 When deoxyhemoglobin is present, the magnetic field is disturbed locally, so that nearby spins precess more rapidly than those at a greater distance, causing the MR signal to decay rapidly and the apparent T2 of adjacent tissue to be shorter: Deoxyhemoglobin thus causes the magnetic resonance images to be slightly darker.
It is believed that the effects of neural activity on the magnetic resonance signal are coupled indirectly, as follows. When the energetic needs of the brain parenchyma are increased secondary to neural signaling, oxygen substrate (and possibly other factors) is delivered by the capillaries to the brain. As a result, the intraluminal oxygen tension is reduced and more of the capillary hemoglobin is in the deoxygenated state. The vascular system responds by increasing blood flow to the affected region, which keeps the substrate concentration in the blood higher in order to deliver more to the brain parenchyma. However, in the case of increased flow, the net result in the postcapillary arterioles is for the oxygen content to increase.13 Because the oxygenated hemoglobin disturbs the magnetic field less, the transverse relaxation times are increased and the magnetic resonance signal is stronger. Thus, the consequence of increased neural activity is a brighter MR image. This method overall has been called blood oxygenation level–dependent (BOLD) fMRI.
The neuronally driven signal changes in MRI are typically 1% to 2% of the background signal level, depending on factors such as field strength as well as on experimental conditions, such as the magnitude of the stimulus that drives the neuronal signal. In practice, with only a few data points, this change is readily detectable when images are compared in active and baseline conditions. A series of MRI pictures acquired even from a nonliving subject, however, will show small signal intensity fluctuations from noise. Biologic baseline processes, such as respiration and cardiac pulsation, further vary the signal. On top of these, there appear to be spontaneous changes in the neurovascular signal itself, so that on average, the baseline signal fluctuates by 1% or so. Thus, statistical means ordinarily are used to detect the fMRI signal by assessing the significance of the change in mean signal when a series of images is acquired under rest and active conditions.6 There are many tools for efficient statistical analysis of fMRI data, but they will not be considered further here. Note, however, that this method generally requires the comparison of MRI signal in two (or more) conditions to get a single result that localizes neuronal activity. Practiced in this manner, BOLD fMRI cannot show baseline metabolic state.
An alternative use of MRI exploits changes in apparent T1 during neural firing. Although it is currently less popular, it was actually presented at the time of the very first BOLD studies.47 When a slice of tissue is subjected to repeated RF excitation pulses at TR short compared to T1, the recovered signal is less than at long TR (or short T1), which imparts T1-dependent image contrast, as noted earlier. If the excitatory pulses are presented slicewise, however, the replacement of blood within the slice by blood that flows in from elsewhere results in an overall stronger MR signal because the inflowing blood has its full magnetization at the time of the excitatory RF pulse, whereas the stationary tissue does not. T1-weighted imaging thus provides a means of visualizing blood flow more directly (as opposed to through its secondary effects on oxygen tension).
Consider now a different experiment, in which the blood outside of the target slice is “labeled” by exposing it first to an excitatory RF pulse. In this case, the replacement blood in the slice can be distinguished from the stationary tissue. It is important that under a variety of more or less tenable assumptions, the images derived from these flow-dependent strategies are in principle quantitative, expressing absolute perfusion in units convertible to milliliters of flow to milligrams of tissue. Several methods of arterial spin labeling (ASL) have been presented in the current MR literature, and they have been sparking a great deal of research interest.21,24,26,77,79
Functional MRI by BOLD and ASL share several important features. First and foremost, they rely on entirely endogenous mechanisms for contrast, unlike PET and SPECT, which require the patient to receive radioactive tracers either intravenously or by breathing. fMRI may therefore be performed repeatedly on single subjects without fear of inducing tissue or genetic damage. The fMRI methods may be performed on existing MRI devices, generally without any modification, making the technique widely available in hospital and university settings. Because the same instrument is used for fMRI and for structural MRI studies, the burden to the patient and clinical staff are much reduced and the cost is consequently less as compared to scheduling separate functional studies by alternative means such as PET, SPECT, magnetoencephalography (MEG), or others.
Applications of Functional Magnetic Resonance Imaging to Epilepsy
Surgical Planning
fMRI holds tremendous promise in the presurgical evaluation of patients with epilepsy. In principle, fMRI has the potential to augment or replace the Intracarotid Amytal Procedure (IAP, or Wada test) and electrocortical stimulation mapping in presurgical and intraoperative testing of eloquent cortex. However, fMRI differs in a fundamental way from these methods, in that both involve disruption of an ongoing process, thus reflecting brain regions that, if lesioned, should produce clear deficits. In contrast, fMRI reveals all regions associated with task performance, some of which may be involved in but not critical to task performance, or which may have redundant systems that can compensate after resection. In general, although numerous fMRI studies show associations between fMRI results and those of invasive methods at the group level, very few demonstrate the sensitivity and specificity of these techniques. Fewer still have examined a sufficient number of patients with atypical language organization to claim adequate reliability in these cases. Considering that numerous factors specific to the imaging center will affect the generated results (such as MRI field strength, stability, choice of paradigm, analysis approach, to
name a few), the routine use of clinical fMRI to make independent clinical decisions is probably not warranted at this time. Here we discuss some of the recent studies using fMRI for surgical planning and the outstanding problems that remain to be solved.
name a few), the routine use of clinical fMRI to make independent clinical decisions is probably not warranted at this time. Here we discuss some of the recent studies using fMRI for surgical planning and the outstanding problems that remain to be solved.
Language Lateralization
fMRI holds the promise of replacing some of the more invasive diagnostic procedures in patients with epilepsy, specifically the intracarotid Amytal procedure (IAP) and intraoperative electrocorticography. One hurdle in developing the technology is that of finding a reliable way to determine language laterality. Numerous language activation studies in normal volunteers (see Cabeza and Nyberg14 for a review) present paradigms that reveal a lateralized response at the group level consistent with left hemisphere language in normal right-handers. Several studies have used fMRI during language activation in normal volunteers to demonstrate hemispheric dominance.
Binder et al. performed fMRI on 22 epileptic patients who also received a sodium Amytal (Wada) test to determine language lateralization. For the Wada test, participants performed four language tasks: (a) object naming, (b) repetition, (c) following commands, and (d) reading sentences. The authors determined language lateralization by rating both task performance and paraphasic errors for each hemisphere, generating a laterality index. During fMRI, they used a different set of language tasks, previously reported in normal volunteers: (a) tone discrimination (control condition) and (b) a semantic judgment task, determining whether a heard word was “native to the U.S.” or “used by people.” A correlation analysis identified voxels significantly associated with task performance. Based on the number of voxels in each hemisphere that exceeded threshold, they calculated a laterality index. The authors reported that all patients showed concordant fMRI and Wada results. Eighteen of the 22 patients had strong left hemisphere dominance on both fMRI and Wada test. The remaining 4 patients showed less strong or atypical language dominance on fMRI; 3 of these patients had a right hemisphere language bias. Although the authors reported that these patients also showed “less” or “atypical” laterality on Wada measures, it is unclear whether, categorically, these patients were felt to have right hemisphere dominance on either measure. The question of mixed dominance was also not addressed directly. Although patients showing less strong laterality did so on both measures, whether this represented “bilateral” representation or some other pattern is not clear. Because these are the very patients who are at risk for postoperative deficits, characterization of their results on both fMRI and Wada might shed light on language organization in such patients.
Another study compared fMRI with Wada testing in seven patients with intractable seizures. Based on the Wada test, four patients were determined to have left hemisphere (LH) dominance, and three had right hemisphere (RH) dominance. During fMRI, participants were presented words visually and had to make a perceptual versus a semantic decision for each stimulus, and these images were subtracted. The authors found activation in frontal language areas that corresponded to language lateralization as determined by the Wada test, suggesting that fMRI can be used in lieu of the Wada exam to determine language lateralization. The regions activated in this study were similar to those observed in word generation studies performed in normal volunteers, and the method appears to support the use of such a paradigm to determine the lateralization of frontal language areas. In contrast to the Binder et al. paradigm, the semantic judgment task produced no activation of the posterior language areas. This is unfortunate because mixed-dominance patients may show differential laterality of anterior versus posterior language areas.57 Neither study mentioned the basal temporal language area. Located in the inferior temporal gyrus, this region is close to the resection zone in many temporal lobe surgical procedures and is consequently an important region to study. Artifacts in the basal temporal area are accentuated in susceptibility-weighted imaging and may interfere with the ability to measure functional activation in this region. The largest fMRI study examining language laterality was reported by Woermann and Jokeit.78 They scanned 100 epilepsy patients, all of whom underwent an IAP. The fMRI paradigm used a covert word generation task using 10 activation and rest blocks. Results were analyzed by visual inspection and rated as typical (left), atypical (right or bilateral), or artifactual. They found a 91% concordance rate in scans that were not artifactual, four cases in which lateralization was discordant (4%), and four in which either the fMRI or the IAP was not lateralizing. Notably, with this paradigm, 82% of patients with fMRI lateralization showed bilateral activation interpreted as greater on one side. The authors also noted a high failure rate of correct fMRI lateralization in patients with extratemporal epilepsy (25%).
Choice of Task
There is little agreement on which task is best to use for language lateralization in fMRI. Many studies have used a covert word generation task that has been studied repeatedly in normal controls. This paradigm has the advantage of requiring little in the way of presentation devices; however, it is acknowledged to be a poor activator of Wernicke’s area. Indeed, a prior PET study showed that this task actually produces signal decreases in posterior temporal cortex.28,68 A semantic decision task was compared to tone discrimination, finding a high degree of left lateralization among normal volunteers and patients with epilepsy; bilateral activity was found in most participants. They used a lateralization index (LI) approach, which compared all voxels in the two hemispheres.
Lehericy et al.49 compared three language tasks in their correlation with IAP laterality across a range of regions. Different tasks produced different LIs across these regions; a fluency task showed a reliable L:R ratio of the number of voxels activated in the frontal lobe in the strongest of the word generation tasks (semantic fluency); other tasks, including story listening and silent repetition, showed less fMRI asymmetry in frontal cortex and correlated less well with IAP results. Compared to frontal cortex, activations in the temporal lobe regions did not lateralize as well and were less correlated with the IAP results; this may have reflected the inclusion of auditory cortex, which is bilaterally represented.
Although most of these studies use a single fMRI task to determine language laterality, a recent study29 argued that a task-panel approach improves the predictive value of fMRI in determining laterality. Participants performed between three and five different tasks, including a generation task, reading comprehension, and auditory comprehension. The scans were interpreted by raters looking at the thresholded images rather than through a predetermined algorithm for calculating LI. Although agreement was somewhat better than reported in other studies, in several cases, fMRI results appeared to be bilateral to all raters when the IAP was unilateral, and there was 1 case of 26 in which a left-dominant fMRI result was at odds with the bilateral IAP. However, in no case did the fMRI yield unilateral data that contradicted a unilateral IAP, suggesting that the use of multiple activation tasks may indeed improve clinical utility of fMRI for determining laterality.
Related posts:


Stay updated, free articles. Join our Telegram channel

Full access? Get Clinical Tree


