Chapter 4 Imaging Diagnosis of the Degenerative Spine
Conventional radiography (plain films)
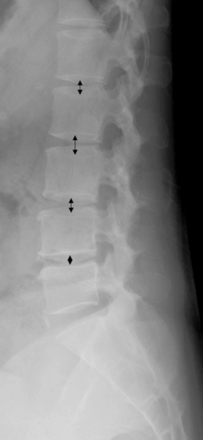
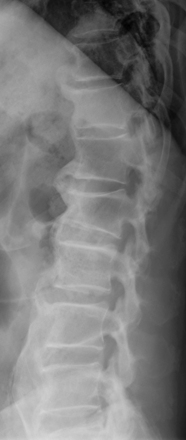
The role of conventional radiography in diagnosing spinal pain is to assess the alignment and position of the spinal structures. Findings from plain films can, therefore, identify degenerative narrowing of the intervertebral discs, subchondral sclerosis, and osteophyte formation. The accepted rule of thumb for assessing the spacing of the vertebra with plain films is that the height of a given lumbar intervertebral disc space should always be slightly greater than the height of the disc space one level above it (Fig. 4-1) [1]. This rule does not apply to the transition disc immediately above the sacrum (usually L5-S1).
Intervertebral Osteochondrosis
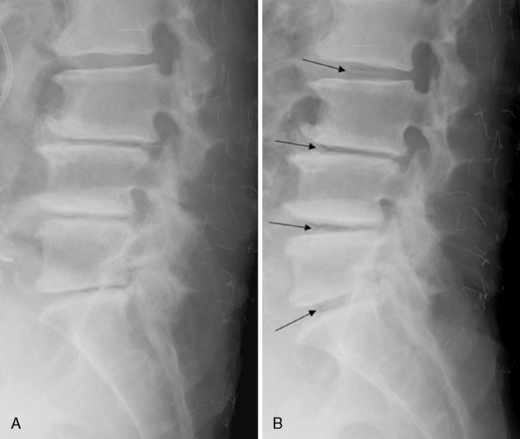
Loss of disc space and bony sclerosis of the adjacent vertebral bodies are the radiographic manifestations of disc degeneration; these findings collectively have been termed intervertebral osteochondrosis (Fig. 4-2). With progression of intervertebral osteochondrosis, there is pathologic evidence of the following abnormalities:


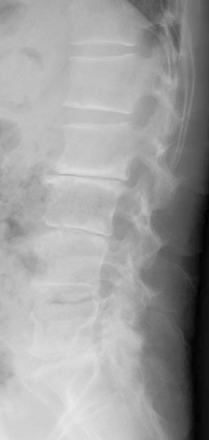
Disc space loss and bony sclerosis are commonly seen together on radiographic images. The sclerotic zones are variable in size, are commonly triangular, and involve both vertebral bodies that border the narrowed intervertebral disc. These radiographic and pathologic findings in intervertebral osteochondrosis can be apparent at any level in the spine; however, abnormalities are found predominantly in the lower lumbar and cervical regions [2]. In most situations, narrowing of an intervertebral disc space in the absence of other evidence of chronic discopathy is the only detectable sign suggesting a disc herniation at the lumbar spine [1].
Spondylosis Deformans
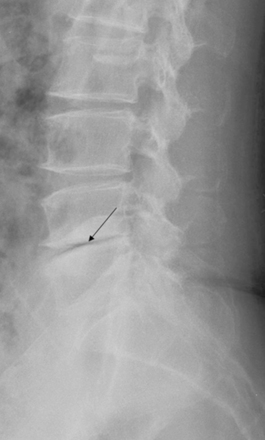
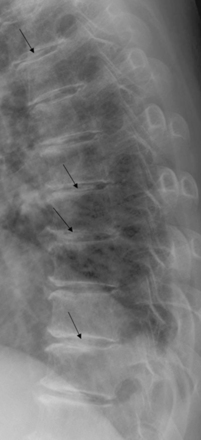
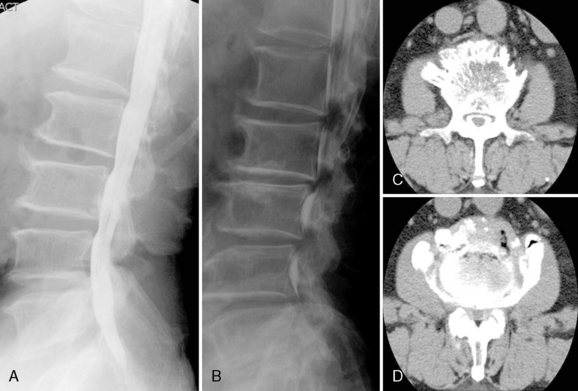
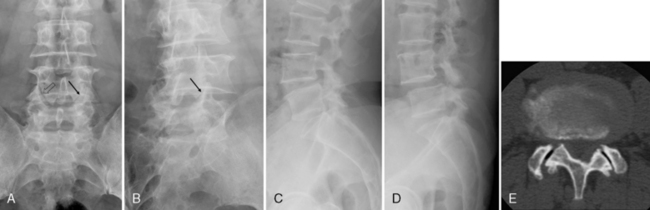
Spondylosis deformans is osteophytosis of the end plates (see Fig. 4-2). It is thought to be secondary to anterolateral disc displacement, which results in traction at the site of osseous attachment (Sharpey fibers) of the anulus [2,3]. The presence of posterior or foraminal vertebral body osteophytes, whether or not associated with disc space narrowing, is a definite sign of a chronic disc herniation [2]. With the development of more severe degenerative changes, the disc space narrows and radiolucent interspace accumulations of gas develop at sites of negative pressure; this is referred to as vacuum disc phenomenon (Fig. 4-3) [2,4]. Calcification of the intervertebral disc may also be seen (Fig. 4-4) [5]. Central spinal canal stenosis is difficult to evaluate, and soft tissues cannot be directly visualized on plain films.
Myelography
Historically, the roles of myelography has been to enable (1) differentiation among the thecal sac, spinal cord, and exiting nerve roots and (2) determination whether these structures are compromised by disc bulging, disc herniation, or spinal stenosis [3]. Disc herniations can be demonstrated only indirectly [1]. They are diagnosed on the basis of features such as [6]:


Plain myelography easily enables coverage of the entire lumbar area and assessment of the intrathecal structures (cauda equina and conus medullaris). However, far lateral foraminal herniations, extraforaminal herniations, and anterior herniations cannot be detected on myelography [1]. Therefore, this modality is a less sensitive diagnostic tool for the detection of lateral disease, and it cannot specifically enable diagnosis of the nature of extradural disease [7–9]. Myelography today is usually performed in conjunction with computed tomography (CT) (see Fig. 4-5). Myelography remains an invasive procedure that adds little, if anything, to the evaluation of degenerative disc disease in comparison with CT or magnetic resonance imaging (MRI) [10].
Computed tomography
CT has the distinct advantages of being noninvasive and of providing direct anatomic information [11]. CT scans can, therefore, demonstrate the intervertebral disc directly [3] and can enable diagnosis of disc herniation and degenerative stenosis without the use of contrast material. However, CT is relatively insensitive to the primary derangement of degeneration, because in the early stages of the disorder, the configuration of the disc itself is not changed. This shortcoming may result in an underestimation of the severity of degenerative changes within the nucleus pulposus and anulus fibrosus on CT scans [12].
Although largely supplanted by MRI, CT is often still used in the following three situations [6]:


CT represented a major advance in the evaluation of disc disease because its ability to distinguish soft-tissue from bone changes drew attention to the sequelae of disc degeneration, such as stenosis, facet joint disease, and ligamentous hypertrophy [13,14]. The following reactive changes or secondary reflections of degeneration are noted on CT [3]:


Calcifications within the displaced disc material are readily seen, but it may be difficult at times to differentiate calcification from an accompanying osteophyte or a bone fragment avulsed from the vertebral body ring epiphysis. The major disadvantages of CT stem from limitations in contrast agent sensitivity between various soft tissues and from the limited field of view [3].
Discography
Discography is a reliable means of evaluating the integrity of the intervertebral disc. The purpose of the intradiscal injection is primarily the demonstration of an anular tear, and the degenerative disc is often injected without difficulty [4]. When a disc herniation has been diagnosed with other imaging modalities, discography can show whether the herniation is contained or noncontained [1]. Extravasation of contrast medium occurs within fissures in the anulus fibrosus and may be seen in cases of degeneration and herniation [15,16]. When coupled with a CT examination, discography provides excellent delineation of the exact location of fissures and defects in the anulus fibrosus as well as herniation [3].
Magnetic resonance imaging
MRI is currently the imaging technique of choice for the evaluation of degenerative changes of the spine [6]. It provides a better assessment of disc morphology than CT scanning or CT myelography [1]. The contrast sensitivity and multiplanar imaging capability of proton MR imaging make this modality a unique noninvasive means of imaging the intervertebral disc. From a morphologic aspect, MRI may be the most accurate means of evaluating the intervertebral disc [3].
General considerations in degenerative joint disease
The Cervical Spine
Apophyseal (Facet) Joints
Degeneration of apophyseal joints, found predominantly in the middle and lower cervical spine, is characterized by fibrillation and erosion of articular cartilage, partial or complete denudation of the cartilaginous surface, and new bone formation. Facet arthrosis is has the following characteristics [3]:


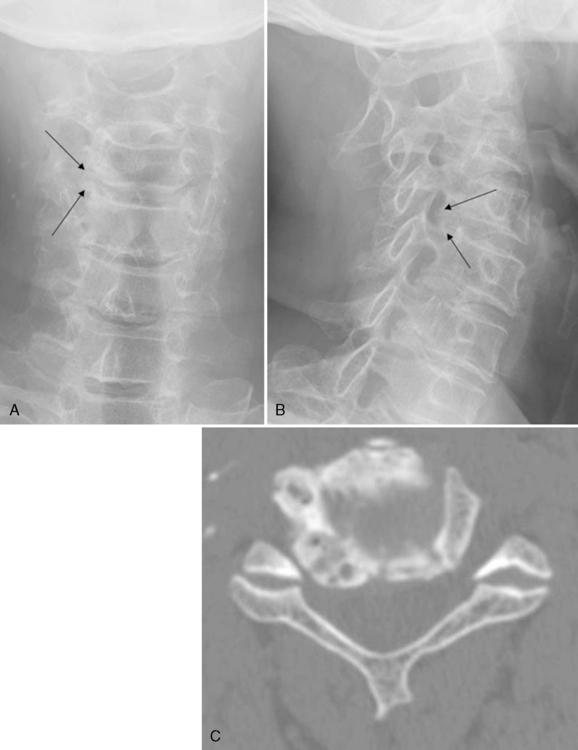
Most diagnostic radiographs are frontal (anteroposterior [AP]) or oblique projections. On an AP projection, the normally smooth lateral contour of the articular pillars shows sharp osteophytic projections and sclerosis in cases of facet joint degeneration. The oblique projection may demonstrate posterior foraminal encroachment from protruding osteophytes (Fig. 4-7) [17].
Uncovertebral Joints (Joints of von Luschka )
Uncovertebral (neurocentral) joints show a predilection for degenerative changes in the lower segments of C5 and C6. Anatomically, they occupy the posterolateral portions of the vertebral bodies, contributing to the anterior border of the intervening intervertebral foramen and lateral recess. As disc height diminishes because of degeneration of the cervical intervertebral disc, the bone protuberances around the uncovertebral articulations approach each other and are pressed firmly together [2].
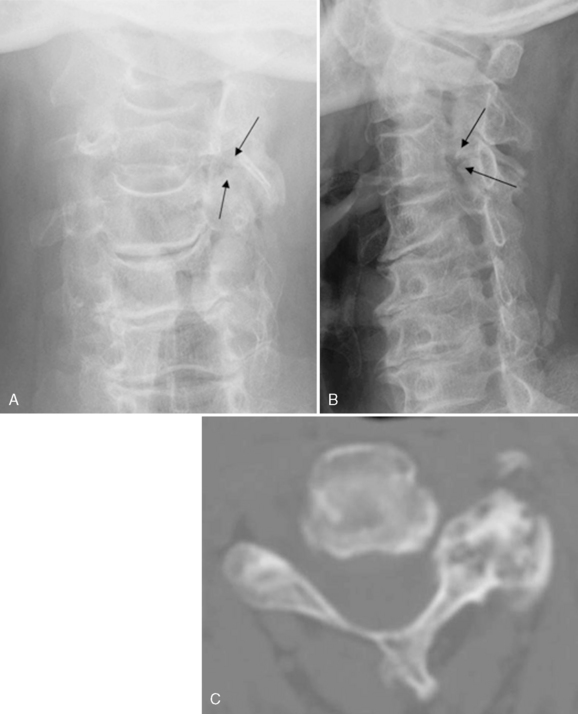
Degenerative changes consist predominantly of osteophyte formation, particularly at the uncinate process. This change is optimally observed on AP and oblique projections. The AP projection shows an initial sharpening of the tip of the uncinate process with a progressive bulbous enlargement, especially in a lateral direction. Oblique views frequently reveal uncovertebral arthrosis with osseous foraminal encroachment in a patient for whom AP and lateral views appear normal (Fig. 4-8) [17]. Osteophytes of uncovertebral origin invariably project directly posteriorly into the anterior aspect of the intervertebral foramen, creating stenosis of the adjacent lateral recess, and at times may interfere with vertebral artery blood flow [18,19]. The combination of anterior uncovertebral and apophyseal joint arthrosis may result in a foraminal configuration analogous to that of an hourglass (see Fig. 4-7).
The degree of anatomic reduction in foraminal dimensions cannot be accurately assessed because of a 1- to 3-mm radiolucent cartilage cap. This limitation accounts for the frequent discrepancy between radiographically visible degenerative changes and directly related clinical abnormalities [19]. CT scanning with the bone window setting remains the optimum method for accurate assessment, although MRI using thin sections may be almost as accurate [20].
Intervertebral Disc
Degeneration of the intervertebral disc (spondylosis) most commonly occurs at levels C5 and C6. The common signs of intervertebral disc degeneration are loss of disc height, presence of osteophytes, and end plate sclerosis (Fig. 4-9). An occasional accessory sign is the vacuum phenomenon, which is more frequently observed in the lumbar spine. The appearance of a lucent vacuum cleft adjacent to an end plate on an extension film after trauma may indicate anular tearing [21].
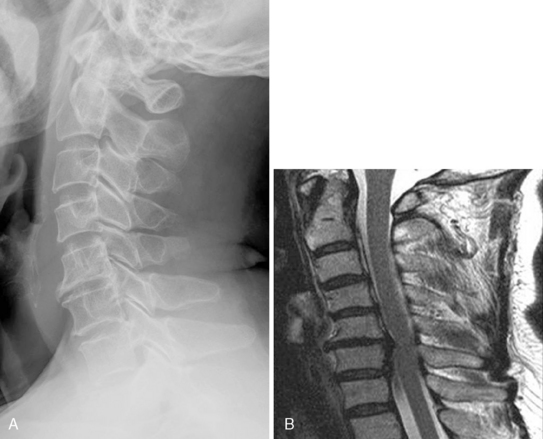
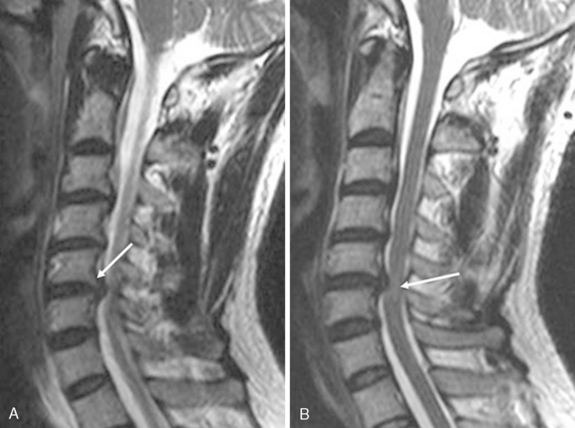
The most reliable sign of disc degeneration is the loss of disc height in varying degrees. Above the degenerating disc, lordosis is frequently diminished [19]. In the absence of visible disc disease, osteophytes initially may be nonmarginal in origin as well as large. However, the combination of loss in disc height and osteophyte formation is usually isolated to the involved level. Anteriorly projecting osteophytes rarely cause dysphagia [22]. Posterior osteophytes projecting into the spinal canal are usually smaller, owing to their posterior longitudinal ligament (PLL) attachment, but they can produce central canal stenosis with resultant myelopathy (Fig. 4-10) [23]. Another prominent sign of disc degeneration often observed is a varying degree of end plate sclerosis, occasionally extending into the midportion of the vertebral body. This finding may simulate an osteoblastic neoplasm or infection. Sclerosis beneath an osteophyte may simulate the inflammatory sclerosis of ankylosing spondylitis. The key to differential diagnosis in degenerative joint disease is to observe the adjacent end plate and the associated loss of disc space. If the vacuum phenomenon is present and the cortical continuity of the end plate is intact, the condition is very likely to be degenerative rather than infective [17].
The Thoracic Spine
Apophyseal (Facet) Joints
Although degeneration of the facet joints is infrequently observed in the thoracic spine, it is most often seen in the upper thoracic and mid-thoracic spine. Radiographic findings indicating degeneration of the facet joints include joint space narrowing, bone eburnation, and osteophytosis. The changes are best observed on AP views [2,17].
Costal Articulation
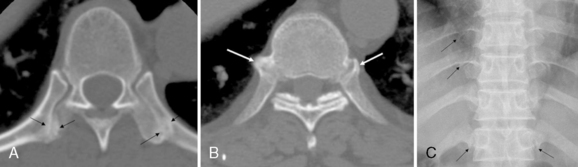
The ribs and vertebral column articulate at two areas, between the heads of the ribs and the vertebral bodies (costovertebral) and between the necks and tubercles of the ribs and the transverse processes of the vertebrae (costotransverse). Both of these areas are synovial articulations and, therefore, are subject to osteoarthritis [2]. Degenerative changes are most commonly found in the lower thoracic segments, especially in the articulations of the 11th and 12th ribs. Arthrosis of these articulations is indicated by the same features seen with degenerative changes at other joints—joint space narrowing, bone eburnation, and osteophytes [17]. These features are evident although their radiographic demonstration is difficult (Fig. 4-11).
Intervertebral Disc (Spondylosis, Senile Kyphosis)
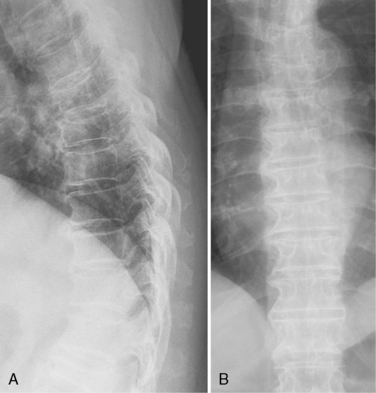
Degenerative disc changes are less pronounced in the thoracic spine than in other spinal regions. Developmentally, the height of normal thoracic disc spaces gradually decreases in a cephalad direction, with the thinnest disc interspaces present between the T2 and T4 regions. The most common sites for disc-related degenerative changes to occur are the middle and lower thoracic levels. The major radiographic features in the thoracic spine are osteophytes, minimal sclerosis, and mild disc narrowing [17]. There is a notable absence of osteophyte formation on the left side of the thoracic spine, which is presumably related to the inhibition of bone production owing to the pulsations of the descending aorta on the left side (Fig. 4-12) [2,24,25]. Infrequently, usually in the elderly, degeneration of the anterior fibers of the anulus fibrosus in multiple segments in the mid-thoracic spine may lead to ankylosis across the anterior disc space, with an associated localized kyphosis (senile kyphosis) [26]. Senile kyphosis is most common in men who do not demonstrate osteoporosis. Radiographic findings include progressive kyphosis in the mid-thoracic spine, disc ossification, and eburnation of the vertebral bodies [2].
The Lumbar Spine
Apophyseal (Facet) Joints
The best diagnostic projections are the AP and oblique films, although degenerative spondylolisthesis and intersegmental instability may require lateral films in flexion and extension (Fig. 4-13) [17]. The AP film shows a loss of joint space, which nevertheless is an unreliable sign in this projection owing to common anatomic variations in facet planes and projectional distortion. Sclerosis may be evident in the subchondral bone. Osteophytes usually arise at the superior aspect of the joint, but they too are difficult to identify. By far the best diagnostic film is the oblique view, which allows accurate visualization of most of the lumbar apophyseal joints. Less than 25% of degenerative facets visible on CT appear on oblique radiographs [27]. Often, degenerative facet subluxation is evidenced as subchondral sclerosis in the adjacent pars region, which is mechanically impacted, particularly at L4 and L5 [17]. The lateral radiograph may reveal an increase in density in the region of the apophyseal joints, but this appearance is often an artifact of the decreased beam penetration through the overlying pelvis. An additional common radiographic projectional artifact seen at the L4 and L5 levels is the superimposition of the superior articulating process into the foramen, simulating osseous encroachment [17].
Because the capsule and ligaments of the apophyseal articulations are richly supplied with nerves, prominent clinical manifestations of osteoarthritis in these locations are expected. Furthermore, the occurrence of various types of spinal stenosis in this disease, leading to compression of the spinal cord and nerve roots, is well recognized and best demonstrated by means of CT [2].
Intervertebral Disc
The most common location for disc degeneration is at the L4-L5 level. As in the cervical spine, the major radiographic signs consist of decrease in disc height, osteophyte formation, end plate sclerosis, vacuum phenomenon, and subluxation (Fig. 4-14) [17]. The best diagnostic radiograph for the detection of degenerative disc disease is the lateral projection, supplemented with AP and oblique studies.
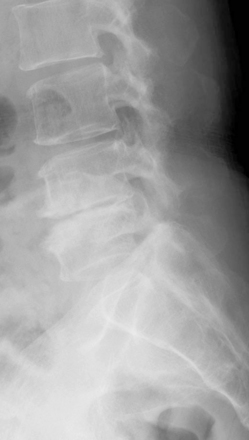
The early signs of a degenerating disc are retrolisthesis, mild loss of disc height, small anterior traction spurs, and vacuum phenomenon. Retrolisthesis often occurs early, with loss of disc height, owing to the posterior orientation of the apophyseal joints; the segment is drawn posteriorly as it is displaced inferiorly [17]. A wide apophyseal joint space or an offset in the articular surfaces, as seen in the oblique projection, has been implicated as an early sign of degenerative disc disease (see Fig. 4-13A) [28].
The primary radiologic and pathologic finding in spondylosis deformans is osteophytosis, an abnormality that becomes increasingly common in each successive decade of life. According to Schmorl and other investigators, including Hilton and colleagues [26,29], abnormalities in the peripheral fibers of the anulus fibrosus are the initiating factors in spondylosis deformans. This discontinuity results in weakening of the anchorage of the intervertebral disc to the vertebral body and allows anterolateral disc displacement. Displacement of the intervertebral disc may lead to traction at the site of osseous attachment (Sharpey fibers) of the anulus fibrosus (or short perivertebral ligaments) [30] to the vertebral surface. Osteophytes develop several millimeters from the discovertebral junction. There are usually two types of osteophytes, traction and claw (Fig. 4-15) [31]. Traction osteophytes, which occur in the early phase of disc degeneration, are horizontal and are tapered at their distal extents [32]. They typically originate about 2 mm from the anterior vertebral body margin. Posterior body osteophyte formation is infrequent in the lumbar spine because of a less adherent PLL and anulus fibrosus. Claw osteophytes have a broader base, climb vertically in a curvilinear fashion, and are tapered. They appear to be derived from a traction spur once shear forces have diminished to more compressive loads [31].
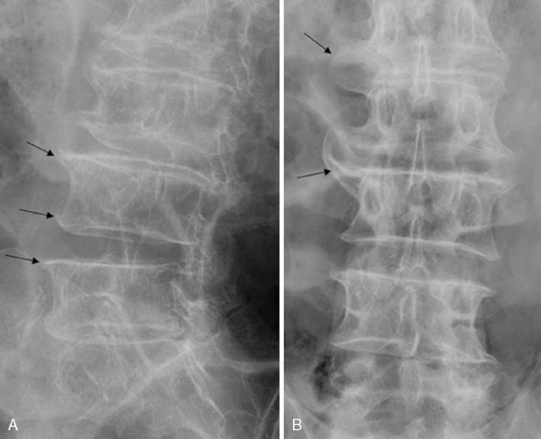
Large osteophytes may completely bridge the intervertebral disc space or may be in close apposition to the adjacent segment. Such an osteophyte exhibits a broad base that extends from the vertebral body margin to a few millimeters away. The distal extension of the osteophyte exhibits a gentle curve laterally and either superiorly or inferiorly, gradually tapering to a slightly rounded, pointed apex, with the appearance of an animal’s claw (claw osteophyte). Such a claw osteophyte is best seen on the anterior or lateral body margin (see Fig. 4-15) [32]. These degenerative bony excrescences are to be distinguished from the following bony structures:
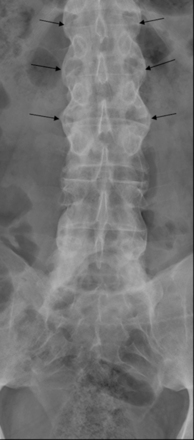
 The syndesmophytes of ankylosing spondylitis, which appear as slender, vertically oriented excrescences extending from the margin of one vertebral body to its neighbor (Fig. 4-16)

The vacuum sign of Knutsson is an important early radiographic finding [4]. It is essentially composed of pockets of nitrogen gas in the nuclear pulposus and anular fissures, and it appears as an area of linear radiolucency in the disc space [33]. Studies have shown this finding to be a common sign of disc aging and degeneration, with an incidence of 2% to 3% in the general population [34]. The collection of nitrogen in the discal fissures is thought to originate from adjacent extracellular fluid. In movements of the spine that lower the pressure in the disc, such as in extension, nitrogen is released from the adjacent extracellular fluid and accumulates in the discal fissures because of the pressure gradient. Therefore this collection of gas can be made to disappear with spinal flexion and to reappear with spinal extension (Fig. 4-18).On MRI, the disc shows diminished signal intensity owing to dehydration and a signal void at the vacuum site [4].
Spinal subluxations are more readily recognizable. These lateral, anterior, and posterior vertebral body displacements can occur in measurable degrees. Flexion-extension films usually reveal decreased motion in the displaced segments. Disc height is markedly diminished, with greater than 25% loss in the vertical dimension. Loss of disc height can also be due to infection, which should be ruled out through careful scrutiny for the loss of the vertebral body end plates [17].
The Sacroiliac Joints
The joint between the articular surfaces of the sacrum and ilium is synovial in type. A cartilaginous surface is present in both the sacrum and the ilium, being considerably thicker on the sacral aspect of the joint [35]. The joint possesses a complete fibrous capsule and is lined with a synovial membrane. It is important to realize that only the lower one half to two thirds of the space between the sacrum and the ilium represents the synovial articulation; the superior aspect of the space is ligamentous.
Pathologic evidence of degenerative abnormalities of the sacroiliac articulation is common and prominent, especially in the ilium, in middle-aged and elderly individuals [35]. The abnormalities may be unilateral or bilateral in distribution. Erosion and fibrillation of cartilage, sloughing of necrotic material, and partial or complete fibrous ankylosis of the joint are seen. Bony sclerosis and osteophytosis are most common on the anterior articular surface, and the latter can lead to para-articular ankylosis owing to the presence of bridging osteophytes (Fig. 4-19).
Radiographic evaluation of the sacroiliac joint is difficult because of the undulating contours of apposing articular surfaces (Fig. 4-19). Although CT is an established method for the evaluation of traumatic, neoplastic, and infectious alterations around the sacroiliac joint, this modality is generally not required in the diagnostic assessment of osteoarthritis or other articular processes in this location. With regard to osteoarthritis, CT delineates the para-articular nature of the osseous proliferation [3].
Disc degeneration and internal disc disruption
The volume of the intervertebral disc tissue decreases with degeneration [3]. Nachemson and colleagues [36], reporting on a relatively small number of lumbar discs, showed that old age and disc degeneration are not necessarily linked and also that disc degeneration is not synonymous with disc thinning. Twomey and Taylor [37] distinguished between “normal” age change and “pathological” disc degeneration. These distinctions were described as grade 2 and grade 3 degeneration, respectively, by Rolander [38]. Grade 2 degeneration is characterized by a less distinct boundary between the nucleus and anulus and a color change from white to yellowish brown. There may be an isolated fissure in the anulus. Grade 3 degeneration is characterized by frank disc degeneration with desiccation, multiple fissures in nucleus and anulus, and disc thinning. Only grade 3 degeneration involves disc thinning and desiccation. The cause of disc degeneration is as yet unknown. Possible causes of disc thinning are the loss of disc material due to herniation and the loss of volume due to dehydration [37].
The term disc degeneration has been used to indicate various histopathologic processes and radiographic findings, including disc narrowing, dehydration, anular fissures, and subchondral bone marrow changes [3,4]. Degenerated nucleus pulposus is characterized by the absence of fibrocartilage, the disruption of anular fibers, the narrowing of the disc space, and the presence of osteophytes. Also, radial tears can be found as well as the replacement of fibrocartilage by collagen or fluid [39].
Disc Dehydration and Narrowing
Usually, disc dehydration accompanies disc space narrowing. Height determination requires comparison either with other levels in the same patient or with other patients [6]. The deteriorated disc is characterized by the following :


Biochemical changes in the nucleus pulposus are related to a decrease in water-binding capacity, disintegration of large molecular proteoglycans, and an increase in collagen content [40]. The onion-skin edges of the nucleus pulposus begin to unravel, and cracks, clefts, or cervices appear within the nucleus and extend into the anulus fibrosus [2]. Deteriorated discs represent real pathologic degeneration, which is sometimes referred to as chronic discopathy. On microscopic examination, such discs show total structural disorganization and general replacement of normal disc material by scar tissue [1].
Magnetic Resonance Imaging and Disc Degeneration
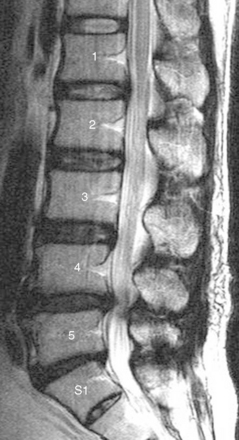
MRI demonstrates degenerative changes in not only disc contour but also internal disc morphology. Good quality, spin-echo T2-weighted MR images provide contrast between the nucleus pulposus and the outer anulus of normal discs. Signal intensity is proportional to the water content of the proteoglycan matrix of the disc [41–44]. On MRI, disc degeneration is evidenced by a decreased signal intensity of the disc and a diminished separation of the nucleus pulposus from the anulus fibrosus. With complete degeneration, the signal intensity is markedly decreased, and the nucleus and anulus are inseparable (Fig. 4-20) [45].
The signal intensity of the disc on T2-weighted MR images reflects fibrocartilage, collagen, and fluid content. The presence of fibrocartilage is correlated with a high signal, and the presence of dense collagenous fibrous tissue with a low signal. Therefore, replacement of fibrocartilage by amorphous collagen results in a lower signal intensity, and replacement by fluid-filled cystic spaces results in a higher signal intensity [39].
Through signal reduction, spin-echo T2-weighted MR images reveal degradation of the matrix in diseased discs. In the case of severely degenerated discs in which the overall signal intensity is decreased, there may be linear areas of high signal intensity, which are thought to represent free fluid within cracks or fissures of the degenerated complex (Fig. 4-21) [3].
Disc signal intensity exists as a continuous variable that may assume an infinite number of values, but it is nonetheless reasonable to categorize individual discs as having normal hydration or mild, moderate, or severe dehydration (see Fig. 4-20) [46,47]. At the opposite end of the spectrum from normal disc hydration is a severely degenerated disc exhibiting the vacuum phenomenon, evidenced by the absence of signal in a narrow linear channel usually located in the midportion of the disc on all imaging sequences (Fig. 4-22) [48]. Small amounts of gas can be detected on plain films or CT scans near the insertion of the anulus on the ring epiphysis, and this gas is probably located in transverse anular tears adjacent to the ring epiphysis [1]. Radiolucent collections representing gas, principally nitrogen, appear at sites of negative pressure produced by the abnormal spaces [5]. These radiolucent areas have a linear or branching configuration. This vacuum phenomenon, indicative of intervertebral osteochondrosis, should be distinguished from the following gaseous collections, which differ in significance [49]:
 Spondylosis deformans causes gas collection in the outer portions of the intervertebral disc, reflecting the presence of fissures in the peripheral fibers of the anulus fibrosus.
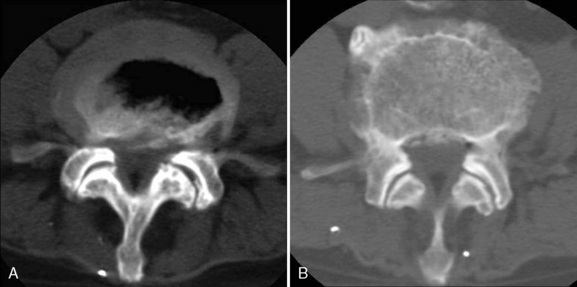
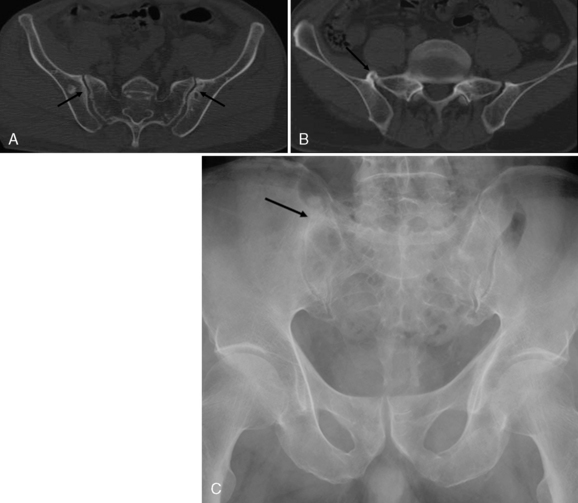
 Intraosseous vacuum phenomenon occurs within collapsed vertebral bodies suggesting ischemic necrosis of bone (Fig. 4-23) [2,50].
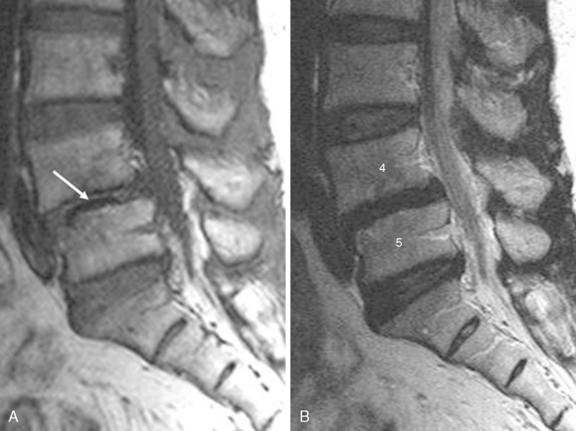
Disc calcification confined to one or a few levels of the spine in adults is a common and insignificant finding. Calcific deposits occur in the in the mid-thoracic and upper lumbar spine and are found in the anulus fibrosus, nucleus pulposus, or cartilaginous end plates, particularly in older men. Such deposits are usually hydroxyapatite in nature, although calcium pyrophosphate dihydrate (CPPD) crystal deposition, especially in the anulus fibrosus, is not infrequent. Disc calcifications, which predominantly involve the nucleus pulposus, produce single or multiple oval or flat dense areas on radiographs [2]. Calcification of the disc may lead to increased signal intensity on T1-weighted MRI (Fig. 4-24) [51]. Vacuum phenomenon and calcification are represented on spin-echo MR images as areas of signal void and are not depicted with the same sensitivity as on plain radiographs or CT scans [48]. Fused discs may undergo a transformation from calcification to ossification and eventual a conversion to marrow (Fig. 4-25) [6].
Degenerative Changes in Subchondral Marrow
The degenerative process within discs results in greater axial loading and increased stress on the vertebral body end plates. Such changes may secondarily affect the local marrow environment [52]. Signal intensity changes in the vertebral body marrow adjacent to the end plates of degenerative discs are commonly observed on MRI. These appear to take the following three main forms (Table 4.1).
Table 4.1 Types of MRI Signal Intensity Changes in the Vertebral Body Marrow Adjacent to the End Plates of Degenerated Discs
| Type of Change (Modic) | Signal Intensity on T1-Weighted Images | Signal Intensity on T2-Weighted Images |
|---|---|---|
| I | Decreased | Increased |
| II | Increased | No change or slightly increased |
| III | Decreased | Decreased |
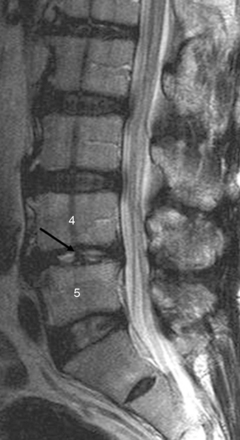
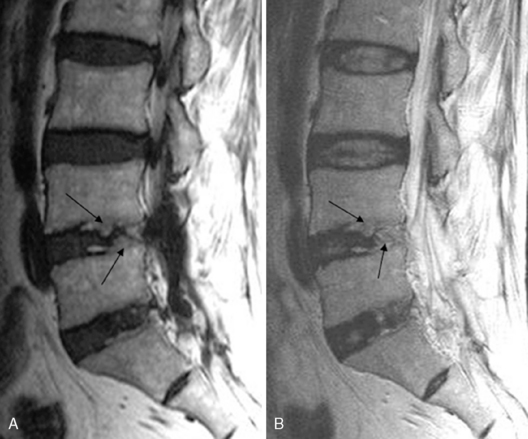
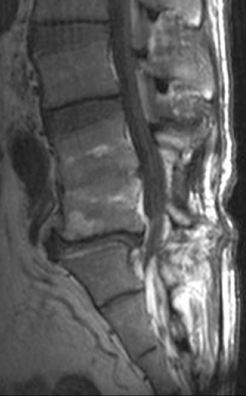
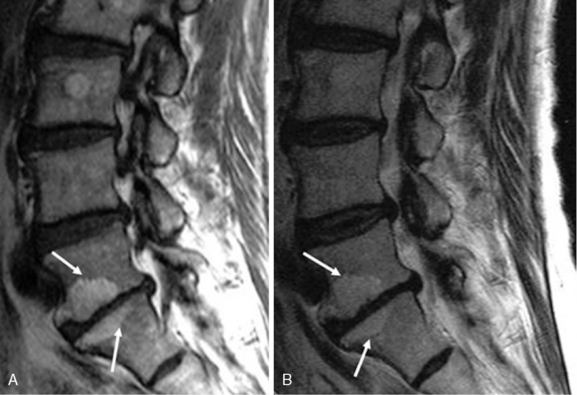
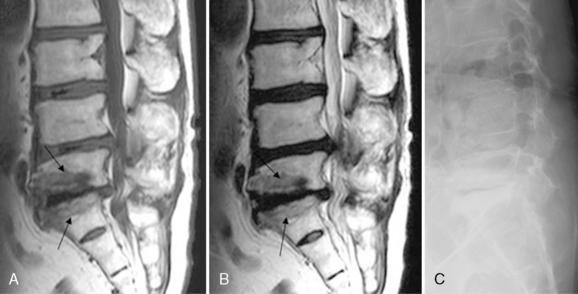
Type I changes consist of a decreased signal intensity on T1-weighted MR images and an increased signal intensity on T2-weighted MR images (Fig. 4-26). Histopathologic sections demonstrate disruption and fissuring of the end plate as well as vascularized fibrous tissues within the adjacent marrow [4]. Although the signal intensity changes of type I may be similar to those seen in vertebral osteomyelitis, the distinguishing factor, at least in the adult population is the involvement of the intervertebral disc. With infection, the disc shows an abnormally high signal intensity and an abnormal configuration on T2-weighted MR images (Fig. 4-27) [53]. Type I changes show a loss of signal intensity in the intervertebral disc associated with the degenerative process on T2-weighted MR images (see Fig. 4-26) [54].
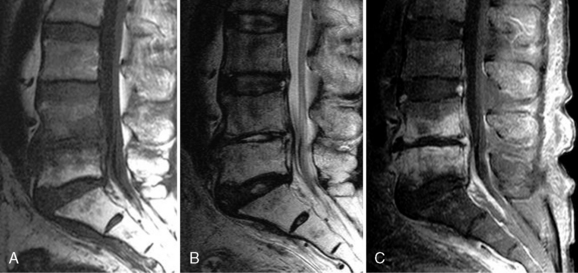
Type II changes are represented by increased signal intensity on T1-weighted MR images and an isointense or slightly hyperintense signal on T2-weighted MR images (Fig. 4-28). These changes were evidence of end plate disruption with yellow marrow replacement in the adjacent vertebral body, resulting in a shorter T1 value [4]. Also, type II changes have been found to be associated with an abnormal configuration and a high signal intensity of the disc on T2-weighted MR images; therefore the greater signal intensity of the vertebral marrow in a type II change might seem to rule out the diagnosis of vertebral osteomyelitis [55].
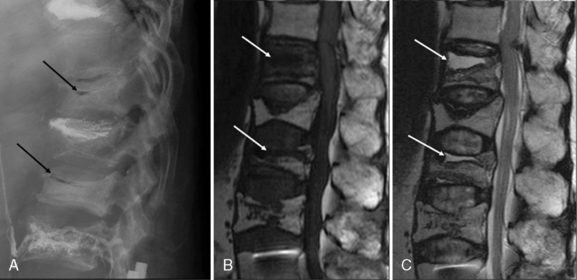
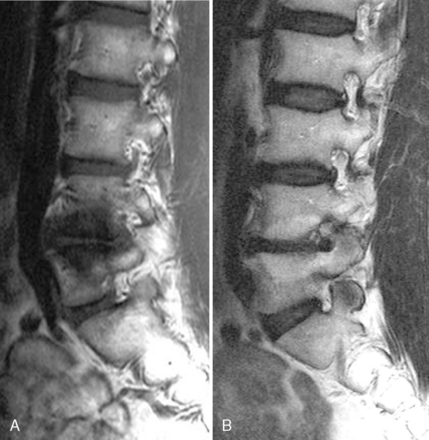
Type III changes are represented by decreased signal intensity on both T1- and T2-weighted MR images, a finding that appears to correlate with extensive bone sclerosis on plain radiographs (Fig. 4-29). The sclerosis on plain radiographs is a reflection of the dense woven bone within the vertebral body that has replaced the marrow elements [3].
Anular Fissure
An anular fissure is an abnormal discontinuity of the concentrically arranged collagen fibers forming the anulus fibrosus [1]. Internal disc disruption is characterized by a pain causing disruption of the internal architecture of the disc that does not affect its external shape or involve its nerve root [56]. The pathology of internal disc disruption involves disruption of the inner anulus fibrosus in the form of radial fissures. Its pathogenesis is believed to be an inflammatory, biochemical degradation of the disc matrix after compression injury of a vertebral end plate [57]. Milette and colleagues [58] suggested that in patients with chronic low back pain, loss of disc height, or decreased central disc signal intensity on T2-weighted MR images, the likely cause of the symptoms is anular tears extending into or beyond the outer anulus. The association, in most instances, of a localized anular disruption with a generalized loss of central disc signal intensity suggests that a radial tear can induce generalized physical and chemical changes involving the proteoglycans of the nucleus pulposus and inner portion of the anulus, resulting in decreased mobility of adjacent water molecules and T2 value shortening.
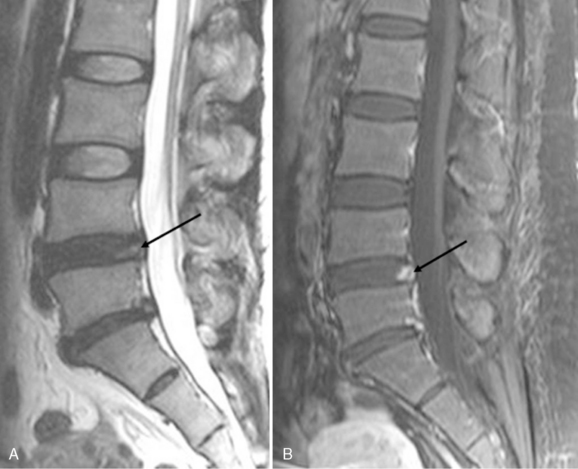
True spin-echo T2-weighted MR images of no more than 5.0 mm in thickness are required to study internal disc disruption adequately [59]. Yu and associates [60] suggested that T2-weighted MRI can also be used to define anular disruption without herniation in vitro through the identification of material with high signal intensity within the anulus (Fig. 4-30). Milette and colleagues [58] reported that localized peripheral area of high signal intensity on T2-weighted MR images is also a reliable marker of symptomatic outer anular disruption [58]. Also, Schellhas and coworkers [61] concluded that the high-intensity zone (HIZ) on T2-weighted MR images is a reliable marker of discogenic pain. Aprill and Bogduk [59] described an 86% positive predictive value for the presence of a posterior HIZ on T2-weighted MR images performed for low back pain in 500 symptomatic subjects. It is speculated that this “hypersignal” represents fluid or mucoid material of nuclear origin, associated with granulation tissue and new blood vessels, entrapped between torn fibers of the outer anulus or underneath the PLL complex [58]. Ross and associates [62] concluded that enhanced T1-weighted MR images can visualize anular tears in vivo, secondary to ingrowth of vascularized granulation tissue (Fig. 4-31).
Yu and associates [60] showed that various fissures evident in the anulus fibrosus of cadavers could be demonstrated on MRI. They identified the following three types of fissures:
Aprill and Bogduk [59] suggested that the HIZ is analogous to the type II fissures described by investigators such as Ross and Yu [60,62]. These fissures are enhanced after injection of gadolinium-DTPA, a behavior that is taken to indicate inflammation, neovascularization, or invasion by granulation tissue and that has been shown experimentally to correspond to granulation tissue in the traumatized disc [63]. Therefore, HIZs are thought to be pathognomonic of an internally disrupted and symptomatic intervertebral disc.
Disc and Facet Degeneration and “Instability”
Degeneration of the disc leads to a loss of disc height and forces the facet joints into malalignment that is referred to as rostrocaudal subluxation. This process results in stronger biomechanical forces at the facet joint, which will increase joint relaxation and instability, cause secondary facet and arthritic changes, and may potentially cause fractures [3]. Disc degeneration generally precedes facet degeneration [64]. When disc degeneration and facet arthropathy coexist at the same level, particularly when there is malalignment at that level, the patient may have spinal “instability [6].”
Disc Contour
Numerous overlapping terms have been used to describe disc lesions. Post [65] suggests a clear and succinct classification consisting of the following three basic types:
The morphologic model is essentially based on one parameter, the assessment of the disc contour to determine the degree of disc extension beyond the interspace (DEBIT) [66]. The following definitions have been applied to describe the analysis of the disc contour:
Figure 4-35 is a schematic diagram of these morphologic models. A morphologic nomenclature based on the evaluation of the disc contour appears to be inappropriate, however, because it creates artificial pathologic entities and completely ignores the possibility of a symptomatic internal disc derangement [58].
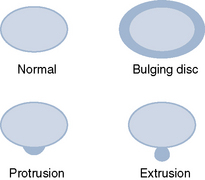
Figure 4–35 [257] Morphologic model based on the disc contour.
(From Milette PC: The proper terminology for reporting lumbar intervertebral disc disorders. AJNR Am J Neuroradiol 1997;18:1859-1866.)
Furthermore, disc contour is defined as normal or abnormal, as follows:
 A normal disc contour is one in which the disc does not extend beyond the margin of the vertebral body by more than 1 to 2 mm.
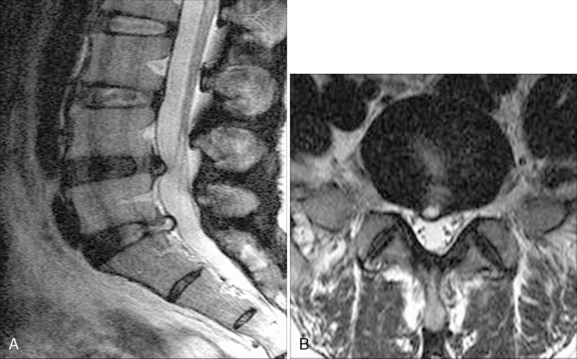
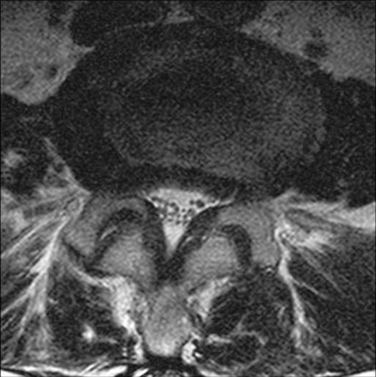
Generalized disc contour abnormalities, also known as bulges, extend beyond the vertebral body margin [6]. A bulging disc may be defined as a disc in which the contour of the outer anulus extends in the horizontal (axial) plane beyond the edges of the disc space, usually over more than 50% (180 degrees) of the disc circumference (Fig. 4-36) [1]. Disc bulges become more prevalent with age and are often associated with degenerative discs [67]. The anulus fibrosus becomes stretched, allowing diffuse concentric bulging of the disc beyond the margins of the adjacent vertebral bodies. This bulging probably occurs as a result of tearing of the collagen bridges between the anular fibers [68]. Typically, disc bulges are symmetrical and maximal in the midline, but disc extension may be greater on one side (Fig. 4-37) [69]. A bulging anulus is a form of disc degeneration with an intact anulus. The disc extends outward and circumferentially beyond the margins of the adjacent vertebral end plates (see Fig. 4-36). It is generally accepted that bulging discs usually do not cause focal nerve root compression [42].
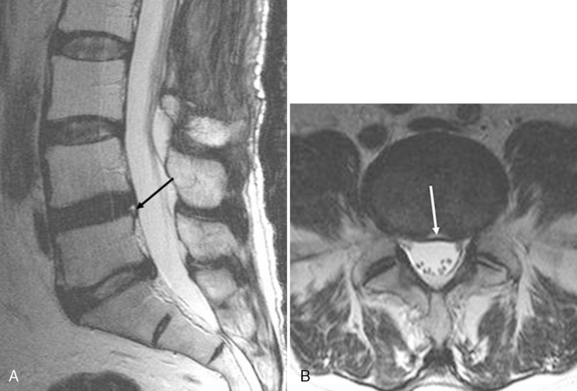
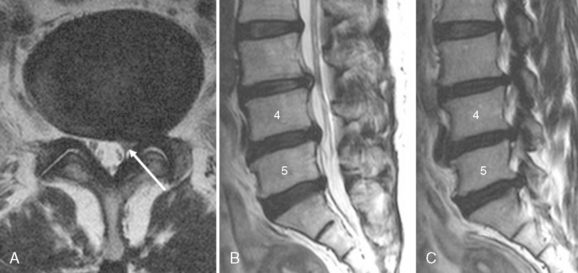
A herniated disc is defined as a focal extension of the nuclear pulposus beyond the margin of the disc. The displaced nuclear material appears in the spinal canal but remains connected to the parent nucleus within the disc space [1,42]. Displacement of the epidural fat plane, focal deformity of the thecal sac, and displacement of adjacent nerve root are associated findings [70,71]. Stedman’s Medical Dictionary defines herniated disc or ruptured disc much more specifically and restrictively as “protrusion of a degenerated or fragmented intervertebral disk into the intervertebral foramen with potential compression of a nerve root or into the spinal canal with potential compression of the cauda equina in the lumbar region or the spinal cord at higher levels. [72]” A chronic localized displacement of disc material accompanied by marginal localized vertebral body osteophytes still qualifies as a disc herniation [1]. The herniated portion of the disc usually reflects the same signal intensity on MRI as the parent disc. Axial images are essential for the detection of lateral disc herniation. Frequently, disc herniation is demonstrated better on axial than on sagittal images, and its relationship to adjacent nerve roots is much better defined on axial images (Fig. 4-38) [42].
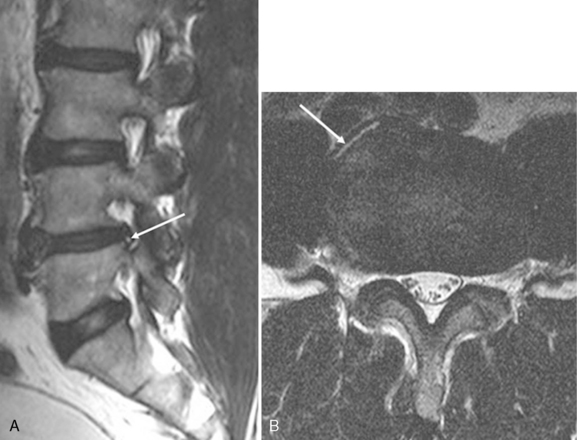
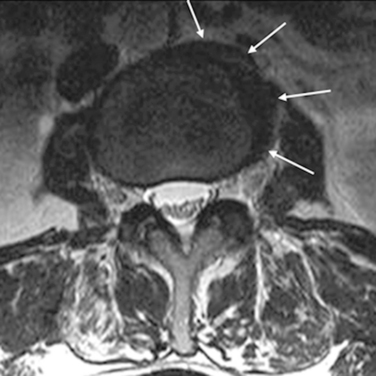
Disc herniations may be further divided into two categories, protrusion and extrusion. Protrusion indicates focal or asymmetrical disc extension beyond the interspace into the canal, the base against the parent disc being broader than any other diameter of the protrusion [1,6]. One may subclassify protrusions into focal protrusions, which involve less than 25% of the disc circumference, and broad-based protrusions, which involve between 25% and 50% of the disc circumference (Fig. 4-39) [6].
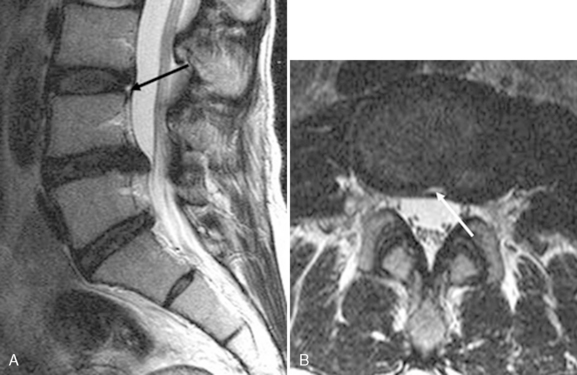
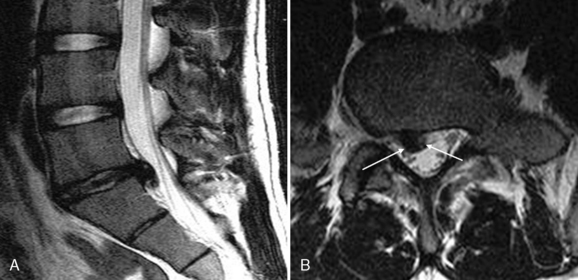
An extrusion is a focal abnormality of disc contour wherein the base of the abnormality measured along the circumference is less than the extension beyond the circumference measured perpendicular to the base (Fig. 4-40) [1,6]. In a study by Boden and colleagues [73], herniated nucleus pulposus was defined as an extrusion, mainly focal, of disc material beyond the osseous confines of the vertebral body, that resulted in displacement of epidural fat, the nerve root, or the thecal sac. Also, the term extrusion indicates the presence of displaced nuclear pulposus through disrupted fibers of the anulus [42]. All disc herniations demonstrating cranial or caudal dissection are extrusions.


Stay updated, free articles. Join our Telegram channel

Full access? Get Clinical Tree


