(1)

(2)

(3)

(4)
 and
and ![$$I_{\mathit{CAN}} = g_{\mathit{CAN}}f([Ca]_{i})(v_{i} - E_{\mathit{Na}}).$$](/wp-content/uploads/2016/09/A315578_1_En_49_Chapter_IEq2.gif)
The activation of the CAN current by the calcium concentration is given as ![$$f([Ca]_{i}) = (1 + (K_{\mathit{CAN}}/[Ca]_{i})^{n_{\mathit{CAN}}})^{-1}.$$](/wp-content/uploads/2016/09/A315578_1_En_49_Chapter_IEq3.gif) The calcium dynamics is described as
The calcium dynamics is described as ![$$d[Ca]_{i}/dt = f_{m}(J_{ER_{\mathit{IN}}} - J_{ER_{\mathit{OUT}}})$$](/wp-content/uploads/2016/09/A315578_1_En_49_Chapter_IEq4.gif) ,
, ![$$dl_{i}/dt = AK_{d}(1 - l_{i}) - A[Ca]_{i}l_{i}$$](/wp-content/uploads/2016/09/A315578_1_En_49_Chapter_IEq5.gif) , in which
, in which ![$$J_{ER_{\mathit{IN}}} = (L_{IP_{3}} + P_{IP_{3}}[ \frac{IP_{3}[Ca]_{i}l_{i}} {(IP_{3}+K_{l})([Ca]_{i}+K_{a})}]^{3})([Ca]_{\mathit{ ER}} - [Ca]_{i})$$](/wp-content/uploads/2016/09/A315578_1_En_49_Chapter_IEq6.gif) ,
, ![$$J_{ER_{\mathit{OUT}}} = V _{\mathit{SERCA}} \frac{[Ca]_{i}^{2}} {K_{\mathit{SERCA}}^{2}+[Ca]_{i}^{2}}$$](/wp-content/uploads/2016/09/A315578_1_En_49_Chapter_IEq7.gif) and
and ![$$[Ca]_{\mathit{ER}} = \frac{[Ca]_{Tot}-[Ca]_{i}} {\sigma }.$$](/wp-content/uploads/2016/09/A315578_1_En_49_Chapter_IEq8.gif) The meaning and values of other parameters are same as that in [10].
The meaning and values of other parameters are same as that in [10].
![$$f([Ca]_{i}) = (1 + (K_{\mathit{CAN}}/[Ca]_{i})^{n_{\mathit{CAN}}})^{-1}.$$](/wp-content/uploads/2016/09/A315578_1_En_49_Chapter_IEq3.gif) The calcium dynamics is described as
The calcium dynamics is described as ![$$d[Ca]_{i}/dt = f_{m}(J_{ER_{\mathit{IN}}} - J_{ER_{\mathit{OUT}}})$$](/wp-content/uploads/2016/09/A315578_1_En_49_Chapter_IEq4.gif) ,
, ![$$dl_{i}/dt = AK_{d}(1 - l_{i}) - A[Ca]_{i}l_{i}$$](/wp-content/uploads/2016/09/A315578_1_En_49_Chapter_IEq5.gif) , in which
, in which ![$$J_{ER_{\mathit{IN}}} = (L_{IP_{3}} + P_{IP_{3}}[ \frac{IP_{3}[Ca]_{i}l_{i}} {(IP_{3}+K_{l})([Ca]_{i}+K_{a})}]^{3})([Ca]_{\mathit{ ER}} - [Ca]_{i})$$](/wp-content/uploads/2016/09/A315578_1_En_49_Chapter_IEq6.gif) ,
, ![$$J_{ER_{\mathit{OUT}}} = V _{\mathit{SERCA}} \frac{[Ca]_{i}^{2}} {K_{\mathit{SERCA}}^{2}+[Ca]_{i}^{2}}$$](/wp-content/uploads/2016/09/A315578_1_En_49_Chapter_IEq7.gif) and
and ![$$[Ca]_{\mathit{ER}} = \frac{[Ca]_{Tot}-[Ca]_{i}} {\sigma }.$$](/wp-content/uploads/2016/09/A315578_1_En_49_Chapter_IEq8.gif) The meaning and values of other parameters are same as that in [10].
The meaning and values of other parameters are same as that in [10].3 Bursting and Pattern Transition Mechanisms
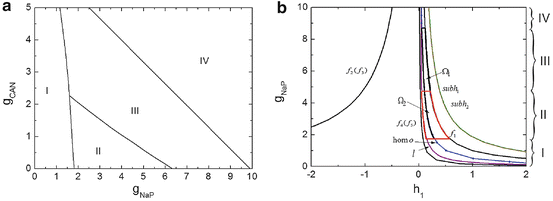
The activity patterns depending on parameters g NaP and g CAN are illustrated, as shown in Fig. 1a, The horizontal axis represents g NaP and the vertical g CAN . Two-coupled cells in the pre-BötC can generate two types of oscillations: the in-phase and anti-phase oscillations [1], so the two-parameter space can be divided into four regions: region I (silence), region II (in-phase bursting and anti-phase bursting), region III (in-phase bursting and anti-phase spiking) and region IV (in-phase spiking and anti-phase spiking). We chose g CAN = 0. 7 nS as a representative and explore the bursting transition mechanisms between these regions with g NaP changing. The systems yield a steady calcium concentration ![$$[Ca]_{1} = [Ca]_{2} = 0.02104057\,\mathrm{mV}$$](/wp-content/uploads/2016/09/A315578_1_En_49_Chapter_IEq9.gif) with
with  . h 1 and h 2 are almost equal when
  [1], we can consider h 1 and h 2 as one single slow variable, h 1. The two-parameter bifurcation analysis is shown in Fig. 1b. As g NaP increases, the systems undergo regions I, II, III and IV. The maximum and minimum values of limit cycles in the full system (1)–(4), we named “the slow variable regions” Ω 1 and Ω 2 [8], are appended in Fig. 1b. The bifurcation curves in regions Ω 1 and Ω 2 are different which play an important role in determining which types of bursting or spiking can occur.
![$$[Ca]_{1} = [Ca]_{2} = 0.02104057\,\mathrm{mV}$$](/wp-content/uploads/2016/09/A315578_1_En_49_Chapter_IEq9.gif) with
with  . h 1 and h 2 are almost equal when
  [1], we can consider h 1 and h 2 as one single slow variable, h 1. The two-parameter bifurcation analysis is shown in Fig. 1b. As g NaP increases, the systems undergo regions I, II, III and IV. The maximum and minimum values of limit cycles in the full system (1)–(4), we named “the slow variable regions” Ω 1 and Ω 2 [8], are appended in Fig. 1b. The bifurcation curves in regions Ω 1 and Ω 2 are different which play an important role in determining which types of bursting or spiking can occur.


