(16.1)
Power Sources
The two types of power sources are alternating current or AC and direct current or DC. The most commonly encountered DC source is the battery. A battery is the conversion of chemical or solar energy using positive and negative electrodes and electrolytes to provide direct current. Direct current moves in one direction and remains constant for the life of the source. Generators on the other hand produce AC power through the use of any number of energy sources to turn a rotor housed in a set of windings called a stator, inducing a voltage in the wires of the stator. One end product is the common 120-V household outlet. In North America, AC power is delivered at 60 Hz, whereas in Europe 50 Hz is the predominant frequency. Both AC and DC provide the electromotive force to move electrons directionally supplying current to power the recording equipment.
Resistors and Resistance
Resistance is the ability to inhibit the flow of current or charge. Resistance is one of the things that slows down electron movement described earlier. While copper wire has resistive properties, it has better conductive properties which make it ideal for movement of charge. Resistance occurs naturally, and resistors are specifically manufactured for use in circuit design. Resistors behave the same regardless of the type of power applied. The current through a resistor is in phase with the applied voltage. This means both current and voltage follow the same path at the same time. Resistors do not store energy, and they dissipate energy through heat. Figure 16.1 illustrates the schematic symbol of the resistor. The unit of resistance for a resistor is ohms and is indicated by the capital Greek symbol omega “Ω.” Resistors can be connected in parallel or series.


Fig. 16.1
Schematic symbol of a resistor
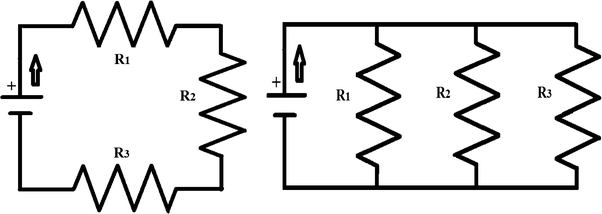
The manner in which resistors are connected determines the total resistance of the circuit. Figure 16.2a, b illustrates simple series and parallel resistive circuits, respectively, arrows indicating direction of voltage and current. Notice that in the series circuit, the voltage has only one path to travel; it must pass through each resistor in an orderly manner. In the parallel circuit, the full voltage is applied to each resistor at the same time. When voltage is applied, it pushes the electrons in a uniform direction; in Fig. 16.2a, b, it is through the resistors of the circuit. When electrons are pushed, they develop a charge or Q which is current over time as shown in Eq. 16.1.


Fig. 16.2
Resistors in series in (a) and in parallel in (b); arrow indicates direction of voltage and current flow
As voltage passes through each resistor in the series circuit, some of the supply voltage is lost because the resistor dissipates the supplied energy in the form of heat and this is called voltage drop. The amount of voltage dropped or consumed by each resistor is determined by the size of the resistor and the charge or current through it. In Fig. 16.2a, resistor R 1 receives the full voltage and is the first to consume some of voltage dissipating the energy as heat. Resistor R 2 receives the voltage left over following the voltage drop from R 1, and it too consumes voltage passing on to R 3 the remaining voltage leftover from the source.
In the parallel circuit, the full voltage is impressed upon each resistor immediately. Each resistor drops voltage, and how much voltage is consumed by each resistor is dependent upon the resistive value and current through each branch. The relationship between current, voltage, and resistance is explained and easily calculated by Ohm’s law discussed further on.
Calculation of the total amount of resistance in a given circuit is different for series or parallel configurations. In a series circuit, the resistance value of each resistor is added to obtain the total resistance of the circuit. The total resistance in a series circuit is higher than the highest value of any single circuit resistor. In a parallel circuit, total resistance is calculated by adding the reciprocal of each individual resistor and then taking the reciprocal of that sum. The total resistance in a parallel circuit is lower than the lowest single resistive value in the circuit. Equations 16.2 and 16.3 illustrate the formulas used to calculate the total resistance in series and parallel resistive circuits, respectively [1–4]. Whether in parallel or series circuit, the current and voltage in a purely resistive circuit are in phase with one another. This means they both follow the same path at the same time.


(16.2)

(16.3)
Capacitors and Capacitance
Capacitors are formed by two metal plates or any two conducting surfaces that are separated by a dielectric. A dielectric is an electrical insulator, e.g., air is a dielectric. Two parallel ribbons of wire on a printed circuit board create a capacitor. Power lines running parallel between poles create capacitors by virtue of the definition of a capacitor. An electrode on the surface of the body creates a capacitor. Capacitors are no more than two conductive surfaces separated by a dielectric. There are additional criteria to further define the properties of capacitance; however, this discussion is limited to series and parallel configurations of capacitors and the resistive value they pose in a circuit based on applied frequency. Figure 16.3 shows the schematic symbol of a capacitor.


Fig. 16.3
Schematic symbol of a capacitor
A capacitor is rated in farads, “F” described below, its symbol is “C,” and the resistance it poses to a circuit is called capacitive reactance symbolized by X C (X of C ) and is calculated as shown in Eq. 16.4 [1, 4].


(16.4)
Similar to a resistor, the capacitive reactance or X C is indicated in ohms “Ω,” and unlike a resistor, the capacitive reactance of a capacitor changes with the applied frequency. In Eq. 16.4, the only variable that is not a constant is the frequency or “f,” the remaining terms are fixed with 2π equivalent to 6.28, and C is the value of the capacitor in farads. In the case of a DC source, “f” is equal to zero. If the denominator becomes zero, the resistance is infinite. If that is true what happens when a capacitor is connected across a DC source such as a battery? Electrons move between the battery terminals and the metal surfaces of the capacitor until the capacitor is fully charged with one of the metal conductive plates (positive or negative). You now have an additional power source. How long does this take? The answer depends on time constants. It is important that you understand the behavior of capacitors. Capacitors are effectively an open circuit with a DC source after charging up to their final capacitive value [1, 4].
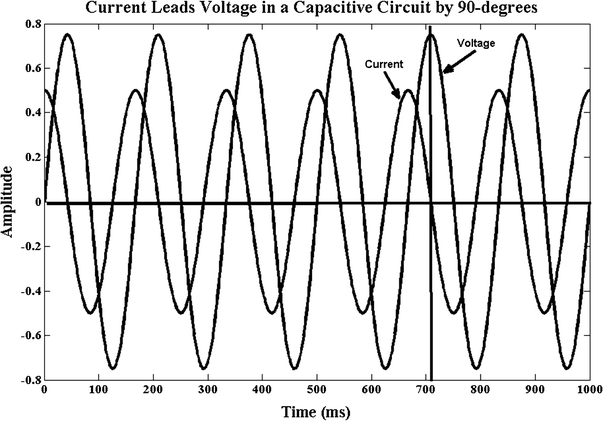
We still have to account for the energy applied to a capacitor because the law of conservation of energy dictates that energy cannot be lost. Unlike resistors which dissipate energy in heat and drop voltage, capacitors store charge. The ability of a capacitor to store charge is termed capacitance, and its units are farads (F), the higher the rating (F), the more charge it can store. The symbol of the charge stored on a capacitor is termed “Q,” because it is electrons that move charging the capacitor. It is the nature of capacitors to resist a change in voltage across them; therefore, the applied voltage lags the current in a purely capacitive circuit by 90°. Figure 16.4 illustrates the phase difference between voltage and current in a purely capacitive circuit. Equation 16.5 states the law of capacitors, where C is the capacitor in farads, Q is the charge, and V is the applied voltage [1, 4].


Fig. 16.4
The relationship between current and voltage in a purely capacitive circuit. Voltage lags current by 90°. When the voltage waveform (higher amplitude) is at its peak, the current waveform (lower amplitude) is crossing zero, and this equates to 90°. This is illustrated by the vertical line just beyond the 700 ms point. Current flow began 90° prior to any voltage change on the capacitor. Code and output created using MatLab R2012a

(16.5)
Figure 16.5 illustrates capacitors in series (a) and parallel (b) left to right, respectively. In a series, circuit capacitors add like resistors in parallel that is the total capacitance in the circuit is lower than the lowest capacitive value in the entire series circuit. Capacitors in parallel, as you may have guessed, add like resistors in series that is the total capacitance in the circuit is higher than the highest capacitive value in the entire parallel circuit. Formulas for total capacitance in parallel and series circuits are shown in Eqs. 16.6 and 16.7, respectively [1, 3, 4].


Fig. 16.5
Circuit configurations of capacitors in series (a) and in parallel (b)

(16.6)

(16.7)
Table 16.1 illustrates the changes in resistance of a 1 μF (10−6) capacitor as the applied frequency increases. Equation 16.4 was used to calculate the change in resistance. It is easily seen that there is a dramatic change in the resistance offered to the circuit by the capacitor as the frequency increases even slightly. This is due to the alternating positive and negative phases of an AC power source. As the alternating phases of the input signal change, more and more rapidly the capacitor ceases to become a resistive factor in the circuit.
Table 16.1
Capacitive reactance as a result of applied frequency
Capacitor in farads (μF) | Applied frequency | Capacitive reactance (X C ) |
|---|---|---|
1 | 0.5 Hz | 318.3 kΩ |
1 | 1 Hz | 159.2 kΩ |
1 | 5 Hz | 31.8 kΩ |
1 | 15 Hz | 10.6 kΩ |
1 | 20 Hz | 8 kΩ |
1 | 25 Hz | 6.4 kΩ |
1 | 50 Hz | 3.2 kΩ |
1 | 100 Hz | 1.59 kΩ |
1 | 1 kHz | 159 Ω |
1 | 10 kHz | 15.9 Ω |
1 | 100 kHz | 1.59 Ω |
Inductors and Inductance
Inductors are coils of wire. The coils of wire can be hollow or the coil can be wrapped around a magnetic or non-magnetic core. Inductors are rated in henries and are indicated by a capital H and are identified in a circuit by capital L. Figure 16.6 illustrates the circuit schematic symbol for an inductor.


Fig. 16.6
Schematic symbol of an inductor
Inductors also store energy, but in a magnetic field, they cannot, however, store energy in the absence of a power source. Once the power source is removed from an inductor, it releases its stored energy. Unlike a capacitor, the resistance of an inductor is directly proportional to the applied frequency of the source. The nature of an inductor is to resist a change in current through it; thus, current lags voltage in a purely inductive circuit by 90°. Like a capacitor, the resistance of an inductor, called inductive reactance which is rated in ohms, is termed X L (X of L ) with symbol Ω and is calculated as indicated in Eq. 16.8 [1].


(16.8)
There is only one variable in Eq. 16.8 that is not a constant, and this is “f” or the applied frequency, 2π is equivalent to 6.28, and L is the measure of the inductor in henries. The phase relationship between an inductor and capacitor is 180°.
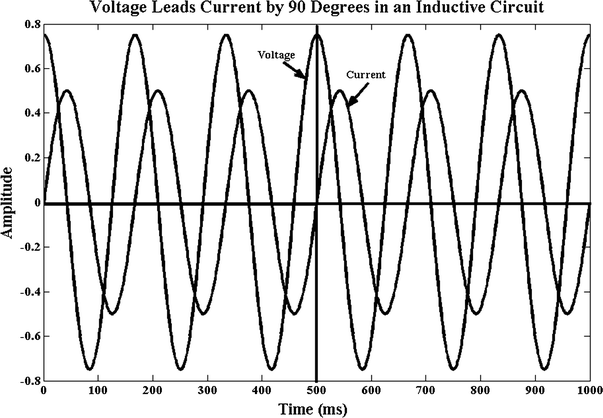
Representative circuits for inductors are not shown. The circuit configuration for inductors in series and parallel is identical to the circuit configurations previously shown for resistors and capacitors with the simple change of circuit components to inductors. Figure 16.7 illustrates the output of an inductive circuit with voltage leading current by 90°; this is identical to Fig. 16.4, but voltage and current have changed places. This phase relationship exists because inductors resist a change in current through them so current lags voltage.


Fig. 16.7
The relationship between current and voltage in a purely inductive circuit. Voltage leads current by 90°. When the voltage waveform (higher amplitude) is at its peak, the current waveform (lower amplitude) is crossing zero, and this equates to 90°. The vertical line through the 500 ms point illustrates this point. The voltage through the inductor began 90° prior to current flow. Code and output created using MatLab R2012a
It should be remembered that the physical properties of a capacitor cause it to resist an instantaneous change in voltage across it and that an inductor resists an instantaneous change in current through it. This is why each of these properties lags in their respective circuit as illustrated in Fig. 16.7 for inductors and Fig. 16.4 for capacitors.
Cartesian Plane
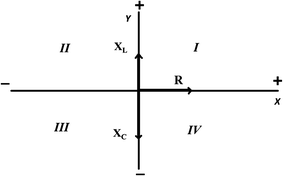
A Cartesian plane is a coordinate system with four quadrants that are labeled with Roman numerals I–IV counterclockwise beginning in the upper right quadrant. The “X” or real axis is the horizontal plane, and the “Y” or imaginary axis is the vertical plane. The zero point in the Cartesian coordinate system is where the X and Y axes cross. All X-coordinate points to the left of zero are negative; all X-coordinate points to the right of zero are positive. All Y-coordinate points below zero are negative; all Y-coordinate points above zero are positive. This coordinate system allows for the unique identification of points in space with two specific coordinates, an X value and a Y value. These points are always shown in that order and usually in parentheses as (X, Y). For instance, a point on the Cartesian coordinate system of (3, −3) indicates that it is located three positive units along the X axis horizontally and three negative units along the Y axis vertically, so the point is located in the lower right quadrant or quadrant IV. Figure 16.8 shows an illustration of a Cartesian coordinate system or Cartesian plane.


Fig. 16.8
Cartesian coordinate system with labeled quadrants and vectors indicating resistance “R,” inductive reactance “X L ,” and capacitive reactance “X C ”
Here, the Cartesian system is used to create an impedance diagram by plotting resistance, capacitive reactance, and inductive reactance using vectors. Vectors are lines with arrowheads that indicate direction and magnitude. The longer the vector the greater the magnitude of the representative quantity; the arrowhead is an indication of direction. Discussion of phase is not addressed other than what has previously been described in resistive and purely capacitive or inductive circuits. Resistance R is always plotted on the positive X axis, capacitive reactance X C on the negative Y axis, and inductive reactance X L on the positive Y axis all by vectors. The phase relationship between inductive and capacitive reactance is 180° which is why X L points up and X C points down. The length of the vector indicates the magnitude of the resistance in each case. Because X C and X L are 180° out of phase, the smaller value is subtracted from the larger value to determine their combined reactance. The direction, pointing up or down in the impedance diagram, is dependent upon the larger value. The resultant vector will point up if X L is larger than X C or will point down if X C is larger than X L and should be scaled to indicate the relative reactance value. In Fig. 16.8, X C is a longer vector than X L , so capacitive reactance has a higher value than inductive reactance leaving a resultant X C vector on the Y axis pointing downward. Drawing a straight line from the arrowhead of the resultant vector, here it would be X C to the vector representing R forms a right triangle. This new line is the hypotenuse of a right triangle, and Pythagoreans theorem shown in Eq. 16.11 is used to calculate this value which is the total impedance of the circuit indicated by the capital letter “Z” [1, 4, 5].
Stay updated, free articles. Join our Telegram channel

Full access? Get Clinical Tree


