Chapter 19 Intracranial Hypertension
• States of impaired consciousness are expressed as numerical scores on the Glasgow Coma Scale (GCS), which is used worldwide and has prognostic and management implications.
• The key clinical signs that help in clinical assessment and determination of prognosis are the presence or absence of certain brainstem reflexes such as pupillary response, corneal reflex, oculocephalic and oculovestibular reflexes, and gag reflex.
• Computed tomography (CT) scan of the head remains a key imaging modality in the rapid assessment of a patient with impaired consciousness. Mass lesions that are directly responsible for intracranial hypertension should be surgically removed.
• Intracranial pressure (ICP) is generally monitored when the GCS score is less than 8 with an abnormal CT scan, although there is no class I evidence that mandates use of ICP monitors worldwide. A fiberoptic monitor is a good tool for measuring and managing increased ICP in an unconscious patient. Fiberoptic ICP monitors have a low incidence of complication and infection in experienced hands. However, they do not give a therapeutic option for lowering ICP like a ventriculostomy catheter with external ventricular drainage does. Head of bed elevation, maintaining euthermia, sedation, analgesia, and mild hyperventilation can also have temporary therapeutic effects on elevated ICP.
• After conservative therapies have been exhausted, hypertonic saline may be as efficacious as mannitol and is associated with a lower overall incidence of comorbidity.
• Decompressive hemicraniectomy is a reasonable option in uncontrolled intracranial hypertension, especially if there is a mass lesion.
• Future studies are being undertaken to further elucidate the role of microdialysis and brain tissue oxygenation monitoring in the setting of intracranial hypertension.
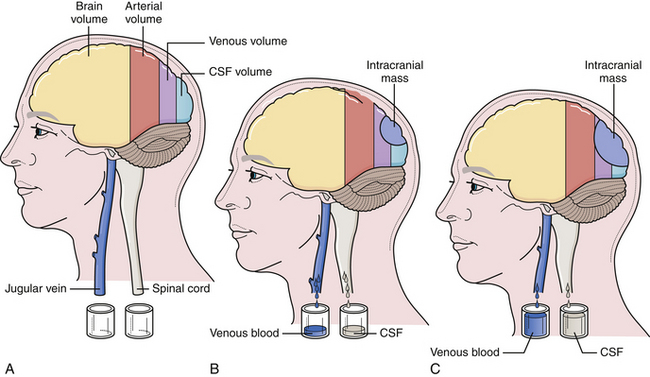
The cranium is a rigid structure. The major intracranial contents are the brain (to include the neuroglial elements and interstitial fluid), blood (arterial and venous), and cerebrospinal fluid (Table 19.1). When a new intracranial mass is introduced, a compensatory change in volume must occur through a reciprocal decrease in venous blood or cerebrospinal fluid (CSF) to keep the total intracranial volume constant. This is the Monro-Kellie doctrine (Fig. 19.1), which has been confirmed by many experimental and clinical observations. Only in children, with open fontanelles and whose sutures have not yet fused, can the cranium itself expand to physically accommodate extra volume.
TABLE 19.1 Intracranial Contents and Their Respective Volumes
| Component | Volume | Percentage of Total Volume |
|---|---|---|
| Brain (70%) and interstitial fluid (10%) | 1400 mL | 80% |
| Blood | 150 mL | 10% |
| Cerebrospinal fluid | 150 mL | 10% |
| TOTAL | 1700 mL | 100% |
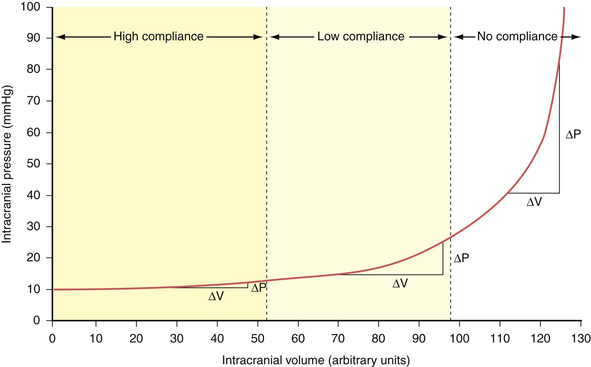
Compliance (dV/dP) is the change in volume observed for a given change in pressure. This represents the accommodative potential of the intracranial space. In clinical practice, however, what is actually measured is elastance (dP/dV). Elastance is the inverse of compliance and is the change in pressure observed for a given change in volume. It represents the resistance to outward expansion of an intracranial mass. The elastance curve (not compliance) is what is plotted in Figure 19.2. Although technically a misnomer, the term compliance is actually entrenched in the literature to describe the aforementioned phenomenon instead of using the proper term elastance. Because of this we, too, will conform to the traditional nomenclature for the rest of this chapter.
In accordance with the Monro-Kellie doctrine, several innate homeostatic mechanisms exist in an attempt to maintain intracranial pressure within the physiological range—generally considered less than 20 mm Hg in the acute inpatient setting. First, the venous system collapses easily and squeezes venous blood out through the jugular veins or through the emissary and scalp veins. Likewise, CSF can be displaced from the ventricular system through the foramina of Luschka and Magendie into the spinal subarachnoid space.1 When these compensatory mechanisms have been exhausted, small changes in volume produce precipitous increases in pressure. This effect can be demonstrated experimentally by inserting a Foley catheter into the epidural space of a rat and gradually inflating a balloon with increasing volumes. The curve produced by plotting intracranial pressure against volume is the so-called compliance curve in Figure 19.2. The innate homeostatic pressure-buffering mechanism offered by displacement of CSF and venous blood keeps this curve flat until a “critical volume” is reached. After this critical volume, small volumetric changes result in precipitous increases in pressure, and intracranial hypertension naturally ensues. Brain parenchyma and arterial blood do not participate, to any significant extent, in the innate intracranial pressure-buffering mechanisms.
Acute Intracranial Hypertention
Cerebral Blood Flow
Normal cerebral blood flow averages 55 to 60 mL/100 g brain tissue per minute. In the gray matter the blood flow is 75 mL/100 g brain tissue per minute, whereas in the white matter it is around 45 mL/100 g brain tissue per minute. This flow is sufficient to meet the metabolic needs of the brain. The brain usually begins to show signs of ischemia at 20 mL/100 g/minute and permanent damage usually results when the blood flow drops below 10 mL/100 g/minute in most models. The most significant factor that determines cerebral blood flow at any given time is the cerebral perfusion pressure (CPP). The CPP is the effective blood pressure gradient across the brain. CPP is the difference between the incoming mean arterial pressure (MAP) and the opposing intracranial pressure (ICP): CPP = MAP − ICP. The mean arterial pressure can be calculated in two ways: (1) the diastolic pressure plus one third of the pulse pressure (DP + 1⁄3PP) or (2) two thirds of the diastolic pressure plus one third of the systolic pressure (2⁄3DP + 1⁄3SP). The ICP has to be measured directly, which can be done with various devices and will be discussed later in this chapter. With increased ICP there is an obvious tendency for the cerebral perfusion pressure to decrease.
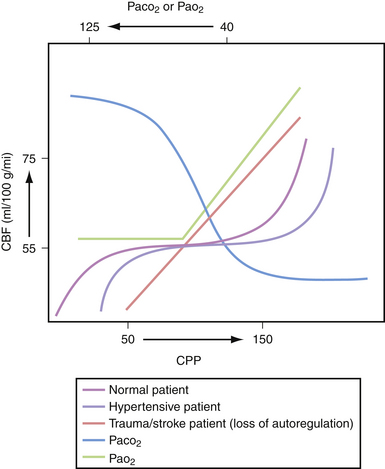
Three major factors regulate cerebral blood flow under physiological conditions: CPP, concentration of arterial CO2, and arterial PO2. The ability to maintain constant blood flow to the brain over a wide range of CPPs (50-150 mm Hg) is called cerebral autoregulation. When the CPP is low, the cerebral arterioles dilate to allow adequate flow at the decreased pressure. Conversely, an increase in CPP causes the arterioles to constrict and maintain the flow within physiological range (Fig. 19.3). Decreases in CO2 tension in the blood (i.e., hyperventilation) causes diffuse vasoconstriction.2 Vasoconstriction decreases both cerebral blood flow and cerebral blood volume in the brain. The risks and benefits of inducing hyperventilation are discussed under the treatment section at the end of this chapter. Lastly, severe hypoxia causes cerebrovascular dilatation. This effect only becomes apparent when the oxygen tension in the blood drops to 50 mm Hg and becomes maximal around 20 mm Hg.
Under certain pathological conditions cerebral blood flow cannot always be autoregulated.3 When the CPP exceeds 150 mm Hg, such as in hypertensive crisis, the autoregulatory system fails. In this case there would be a passive increase in blood flow proportionate to the increase in systemic pressure, causing an exudation of fluid from the vascular system with resultant vasogenic edema.4 Additionally, certain toxins such as carbon dioxide can cause diffuse cerebrovascular dilatation and inhibit proper autoregulation.5 Lastly, during the first 4 to 5 days of head trauma, many patients can experience a disruption in cerebral autoregulation; this is often observed in the pediatric population and may result in hyperemia.6
Disruption of cerebral blood flow autoregulation in the setting of trauma could potentially lead to severe alterations in CPP when a patient’s brain is acutely injured.7 When disrupted, cerebral blood flow would be directly proportional to CPP under a much larger range than normal. This is likely one of the contributing reasons why even one episode of hypotension in the patient with acute head injury may lead to significantly worse outcomes.8 Thus, many institutions have adopted protocols to maintain a minimal CPP in the acute setting—usually around 50 to 60 mm Hg—and perhaps a maximum threshold of CPP if the intracranial hypertension can be linked directly to hyperemia.
Monitoring Intracranial Pressure
The most significant factor determining morbidity and mortality risk in patients with acute cranial neurosurgical disorders continues to be increased ICP. Continuous ICP monitoring is very useful for assessing intracranial dynamics in patients with suspected intracranial hypertension. There are no clinical indicators that can be used in the early stage of rising ICP to forestall a further rise. Classical clinical indicators described in the literature (cranial nerve abnormalities, posturing, etc.) occur in the end stage and they are not sensitive enough to show subtle changes in pressure. The two most common indications for ICP monitoring are closed head injury and spontaneous subarachnoid hemorrhage.
Indications for Monitoring Intracranial Pressure
The advent of continuous ICP monitoring has improved outcomes in traumatic brain injury9,10 by reducing the effects of secondary injury occurring after the initial brain insult. In the modern intensive care unit ICP monitoring in the adult patient with severe head injury is a recommended practice guideline based on available clinical evidence. Indications of ICP monitoring following head injury include a GCS score between 3 and 8 and an abnormal CT scan. Unfortunately, no class I evidence is available regarding the use of ICP monitors in pediatric head injury patients. Nevertheless, strong evidence supports the association between elevated ICP and poor outcomes,11 and aggressive treatment of elevated ICP is associated with the best clinical outcomes. ICP monitoring provides valuable data that can inform medical management.
Techniques of Monitoring Intracranial Pressure
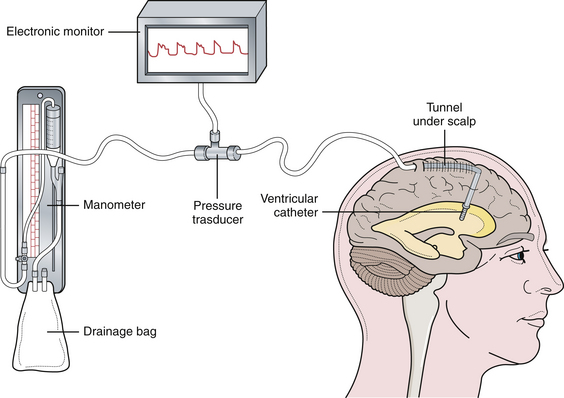
There are two commonly used pressure-monitoring systems in contemporary neurosurgical practice. An intraventricular catheter connected to a manometer and a drainage system is the standard against which all other systems are compared.12–14 The ventricular catheter ideally should be tunneled under the skin and brought out through a separate stab wound, well away from the ventricular entry site, to minimize the risk of infection. Infection is the most significant complication of intraventricular pressure monitoring. With the use of an electronic transducer, the waveform can also be monitored (Fig. 19.4). The major advantage of the method is that the ventricular catheter is used not only to measure the pressure, but also as a therapeutic modality allowing intermittent or continuous drainage of CSF when the pressure exceeds physiological limits.
A second method is the use of the fiberoptic transducer-tipped catheter system. The transducer-tipped catheter can be placed within the brain parenchyma or in the subdural space, depending on the surgeon’s choice and the clinical situation.15–17 The pressure monitor gives both digital readout and a waveform. The advantages of this system are that the zero point does not have to be reset with changes in head position because the pressure-sensing transducer is within the cranial cavity, and it is not susceptible to blockage by debris because it is not a fluid-coupled system. Also, insertion of a fiberoptic cable into the brain parenchyma is not affected by ventricular size or shift, which can make insertion of a ventricular catheter in the setting of intracranial hypertension quite trying. Lastly, the infection rates with fiberoptic probes are significantly lower than with ventriculostomy catheters, reported as less than 1% in one of the the largest reported series.18 The disadvantages of this system, however, are (1) higher cost and (2) baseline drift, which means there is evidence that with prolonged fiberoptic monitoring the indicated pressures may become less accurate in an unpredictable fashion.19,20
Intracranial Pressure Waveforms
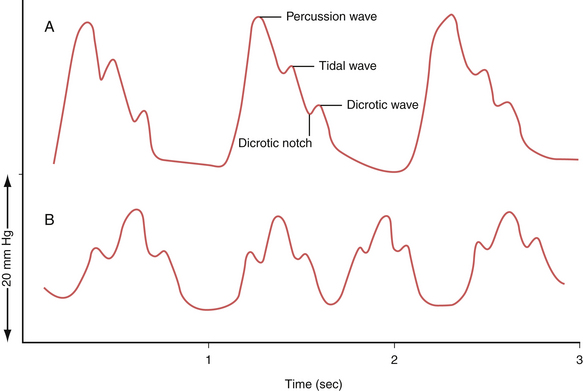
The waveform of normal ICP typically shows three components: the percussion wave (P1), the tidal wave (P2), and finally the dicrotic notch (P3) (Fig. 19.5A). Under physiological conditions P1 is the tallest and is thought to represent the pressure at peak cardiac systole transmitted throughout the choroid plexus. P2 follows P1 and its resultant smaller peak is thought to represent the filling of the intracranial arteries with systolic blood and results in a rebound increase in ICP from this increase in intracranial volume. Last is the dicrotic wave.
When the ICP rises and compliance decreases, one will observe P2 becoming taller than the P1. This is because a similar volume in intracranial arterial blood is now resulting in a higher change in ICP (Fig. 19.5B). Such alterations in the morphology can give the treating physician further clues regarding not only the compliance but also the autoregulatory capacity of the brain.
When the ICP waveforms are registered over a period of time certain trends may become apparent14 (Fig. 19.6). Plateau waves, or type A waves, are characterized by an abrupt elevation in ICP for 5 to 20 minutes followed by a rapid fall in the pressure to resting levels. The amplitude may reach as high as 50 to 100 mm Hg. Plateau waves may be clinically marked by a decreasing level of consciousness, restlessness, increased tone in the extremities, and tonic-clonic movements. Plateau waves may represent transient surges in ICP secondary to increased cerebral blood volume likely related to CO2 retention.
Stay updated, free articles. Join our Telegram channel

Full access? Get Clinical Tree


