BASIC PRINCIPLES OF MAGNETIC RESONANCE SPECTROSCOPY
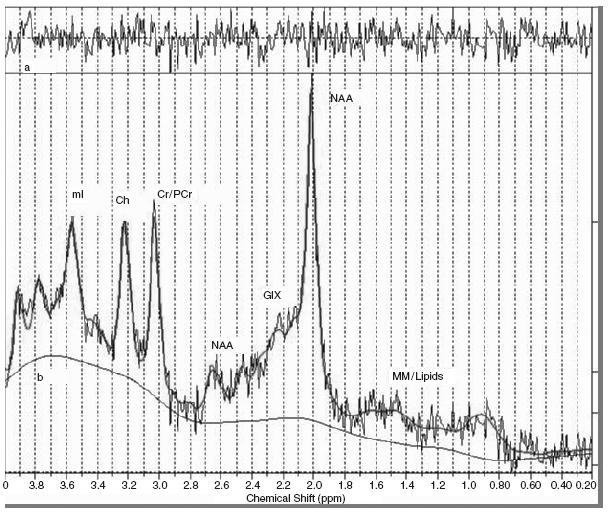
In vivo magnetic resonance spectroscopy (MRS) is a non-invasive technique that allows for the measurement of brain biochemicals in particular regions of the brain. In magnetic resonance imaging, the image is generated from the signal derived from water hydrogen nuclei. MRS suppresses the water signal to measure metabolites in the tissue fluid. It takes advantage of the chemical shift effect, a property that describes the notion that the same nuclei in different molecules respond differently to a magnetic field. Magnetic field strengths usually range from 1.5 Tesla (T) to 4 T in human studies. The chemical shift is typically measured in parts per million relative to the nuclear frequency and plotted on the horizontal axis of a spectrum with the vertical axis displaying the amplitude or intensity of a peak (Figure 71.1). Each peak represents a metabolite of interest for a given nucleus, with the area under the peak reflecting the concentration of that metabolite in the measured region.
There are several signal detection parameters that determine the shape of a spectrum. One is the voxel size which determines the region of tissue being studied and the concentration of metabolites measured. Another important parameter is relaxation time represented by T1 and T2. T1 is the time necessary for hydrogen nuclei to emit 63% of the energy from the stimulating pulse, while T2 is the time for 63% of the transverse energy pulse to be lost due to dephas- ing. These parameters affect signal strength since long T1s and short T2s are typically found in intracellular molecules with high molecular weights and thus can lead to weak signals. As a result, MRS is particularly useful for measuring low molecular weight molecules that are highly concentrated. Typical concentrations of metabolites detected by MRS are in the range of 4-10 mM. It is difficult to detect metabolites under 1 mM. These concentrations can be reported in absolute measures or as ratios to creatine concentrations, using creatine as an internal control.
Phosphorous
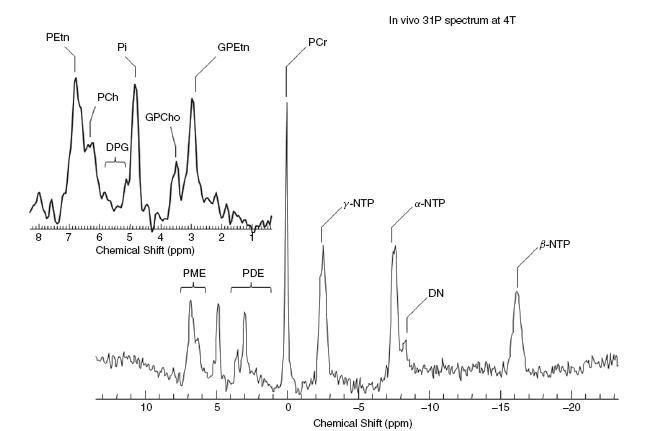
31P-MRS (Figure 71.2) can be used to measure the following metabolites: adenosine triphosphate (ATP), phosphomonoesters (phosphoryl choline, phosphoryl ethanolamine and glycerophos-phate), phosphodiesters (glyceryl phosphoryl ethanolamine, glyceryl phosphoryl serine and glyceryl phosphoryl inositol), phosphocreatine and inorganic phosphate. This is a useful isotope to measure the bioenergetics of neuronal processes.
Table 71.1 Summary of metabolites detected using proton MRS
| Metabolite | Measure |
| N -acetylaspartate | Neuronal density and viability,mitochondrial function |
| Choline and choline-containing metabolites | Neuronal membrane integrity |
| Myo-inositol | Glial function |
| Glutamate/glutamine | Excitatory neurotransmitter |
| GABA | Inhibitory neurotransmitter |
Proton
Hydrogen or proton MRS is used to probe for the following neurochemicals: choline (Cho), creatine (Cr), N-acetylaspartate (NAA), myo-inositol (ml), glutamate/glutamine and gamma amino butyrate (GABA) (Table 71.1). NAA is generally viewed as a marker of neuronal viability and may represent a measure of neuronal volume, number and/or function. However, some evidence suggests that it may more specifically reflect mitochondrial function1‘2. The choline signal represents a composite of choline-containing metabolites such as phosphocholine, glycerophosphocholine and phosphotidylcholine. These metabolites are involved in cell membrane integrity. Myo- inositol is seen as a marker of gliosis and is the storage form of the inositol phosphate second messenger system. Glutamate/glutamine and GABA are the most ubiquitous excitatory and inhibitory neuro- transmitters, respectively.
Other less commonly used nuclei include carbon, lithium, fluorine and sodium. Often, studies utilizing these nuclei involve measuring the impact of pharmaceutical agents containing these metabolites.
Several studies have used MRS to study neurochemical changes associated with normal, healthy ageing. Perhaps due to methodological limitations, early studies using MRS to examine brain alterations associated with normal ageing failed to find significant changes over time3,4. However in a study by Cohen and colleagues comparing brain uptake of choline using proton MRS in younger subjects (mean age 32) and older subjects (mean age 73), it was shown that older subjects had decreased choline uptake5. In a 2001 study, Brooks et al. showed a significant decline in frontal lobe NAA comparing subjects from age 20 to 70 with an overall decrease of 12%6. This decline was interpreted as a decrease in neuronal volume, number or function as NAA is thought to be a marker of neuronal viability. In addition to decreases in NAA, increases in myo-inositol have also been seen in white matter associated with normal ageing. Kaiser et al. found a significant increase in both absolute levels and myo-inositol ratios in older subjects (mean age 56 years) compared with younger subjects (mean age 26 years)7.
Figure 71.1 Sample proton MRS spectrum. Each peak represents a different metabolite with the area under the peak equivalent to the concentration of the metabolite
The impact of these neurochemical changes associated with ageing in frontal white matter have been explored in correlational studies examining the relationship between metabolite levels and cognitive function. For example, in a study by Valenzuela et al., frontal white matter NAA/Cr ratios were significantly correlated with cognitive tasks of executive function8. In a study by Elderkin-Thompson et al., choline, myo-inositol and phosphocholine ratios were correlated with performance on learning and recognition tasks9.
The neurochemical changes described above are not limited to frontal white matter as demonstrated in a study that showed age- related decreases in NAA, NAA/Cho and NAA/Cr ratios across 30 different voxels10. In a longitudinal study examining similar measures over a three-year period, Ross et al. demonstrated that there were no significant changes in brain metabolites (with the exception of myo-inositol) or cognitive function over the time period studied11. In a comprehensive review and meta-analysis of MRS studies in normal ageing, while the majority of studies showed no significant change in metabolites with age, the authors did note a trend towards an increase in frontal and parietal choline with increasing age and a trend towards increases in parietal and occipital creatine with increasing age12.
The studies above describe whole brain or cortical measurements of metabolites associated with normal ageing. However, age-related neurochemical changes in subcortical regions have also been demonstrated. For example, significant decreases in NAA/Cr and increases in choline/Cr in the genu of the corpus callosum have been shown when older subjects have been compared with younger subjects13. In the pons, decreases in NAA and increases in choline and creatine were noted in subjects over 50 years of age compared with subjects under 5014. In a study of the hippocampus, age-related decreases in NAA were measured by Szentkuti et al.15. These changes appear to have a functional impact as well, noted by a correlational study showing that hippocampal NAA/Cr was a significant predictor of performance on a verbal memory task16.
Figure 71.2 31P sample spectra. PEtn, phosphoryl ethanolamine; PCh, phosphoryl choline; DPG, diphosphatidylglycerol; GPEtn, glyceryl phosphoryl ethanolamine; PME, phosphomonoesters; PDE, phosphodiesters; PCr, phosphocreatine; NTP, nucleoside triphosphate; Pi, inorganic phosphate; DN, dinucleotides. Reprinted courtesy of Dr Eric Jensen
GERIATRIC DEPRESSION AND BIPOLAR DISORDER
MRS has been used increasingly to study mood disorders in geriatric populations (Table 71.2). Comparing older adults with depression or bipolar disorder with healthy control subjects may offer insight into the pathophysiology of geriatric depression and predictors of treatment response and aid the development of more specific therapeutic interventions.
Most of the studies of geriatric depression utilize proton MRS. Changes in myo-inositol, choline and NAA have been observed in association with major depression. In the prefrontal region, increased myo-inositol and decreased NAA have been observed17-19. These findings are hypothesized to be associated with changes in myelina- tion and/or neuronal loss. However, there have been differing findings for choline in which Venkatraman et al}1 found a significant decrease and Kumar et al.18 a significant increase. Two proposed reasons for these differences include differing severity of depression and region of interest. The subjects in the Venkatraman study were depressed older adults who were responsive to treatment and had only residual symptoms, whereas Kumar and colleagues studied acutely depressed older adults. Additionally, Venkatraman et al. focused on the anterior cingulate while Kumar’s findings were located in the dorsolateral prefrontal cortex. An additional novel finding for Venktraman and colleagues was increased NAA in the left medial temporal lobe, which may result in increased amygdala activity via diminished frontal lobe inhibition. Furthermore, changes in metabolite concentrations were found in the basal ganglia, where NAA was decreased in the caudate and choline was increased in the putamen20.
A negative correlation was found between magnetization transfer ratio (MTR) and NAA+NAAG/Cr (N-acetylaspartylglutamate) and between myo-inositol/Cr and MTR21 in white matter. MTR is associated with structural tissue integrity and it is hypothesized that changes in myo-inositol and NAA pools may result in the observed changes in macromolecular protein pools. Decreases in NAA were also found to be positively correlated with increased severity of white matter hyperintensities22.
Changes in glutamate and glutamine have also been observed in geriatric depressed subjects. In comparing older adults with major depression, diabetes mellitus and healthy controls, subcortical nuclei glutamate and glutamine levels were significantly decreased in subjects with diabetes mellitus and depression compared with diabetic subjects and healthy controls. It is hypothesized that reduced gluta- mate and glutamine may be a result of glial dysfunction as well as impaired glucose metabolism. Also of note, myo-inositol was significantly increased in both depressed patients and depressed patients with diabetes mellitus versus controls23. In another study examining myo-inositol levels and visuo-spatial functioning, it was found that increased frontal white matter myo-inositol levels, present in both depressed and non-depressed diabetes mellitus subjects, were correlated with visuo-spatial dysfunction24. Patients with diabetes are at increased risk of suffering from depression and increased medical burden may be a risk factor for poor response to antidepressant treatment25.
Table 71.2 Brain MRS findings in geriatric depression and bipolar disorder
ALCAR, acetyl-L-carnitine; BP, bipolar disorder; Cho, choline; Cre, creatine; DM, diabetes mellitus; Gln, glutamine; Glu, glutamate; Glx, glutamate + glutamine; GM, grey matter; H, hydrogen; HDRS, Hamilton Depression Rating Scale; Li, lithium; MDD, major depressive disorder; Mg2+, magnesium ion; mI, myo-inositol; MT, magnetization transfer; MTR, magnetization transfer ratio; NAA, N-acetylaspartate; NAAG, N-acetylaspartylglutamic acid; NTP, nucleoside triphosphate; P, phosphorous; PCr, phosphocreatine; T3, triiodothyronine.
| Author | MRS type | Findings |
| Venkatraman1 | 1H | NAA decreased in prefrontal cortex NAA increased in left medial temporal lobe Cho decreased in prefrontal cortex Cre decreased in prefrontal cortex mI increased in left medial temporal lobe |
| Binesh19 | 1H | mI increased in dorsolateral prefrontal region PE increased in dorsolateral prefrontal region Glx increased in dorsolateral prefrontal region |
| Kumar18 | 1H | mI/Cr increased in frontal white matter Cho/Cr increased in frontal white matter |
| Vythilingam20 | 1H | NAA decreased in caudate Cho increased in putamen |
| Wyckoff21 | 1H,MT and MRS | Inverse relationship between MTR and mI/Cr in left dorsolateral white matter Inverse relationship between MTR and (NAA+NAAG)/Cr in left dorsolateral white matter |
| Murata22 | 1H | Correlation b/t increased WMH severity and decreased NAA/Cr in frontal white matter |
| Ajilore23 | 1H | Significantly decreased Glu and Gln for DM+MDD and DM vs. HC in subcortical nuclei |
| Haroon24 | 1H | Increased mI in DM and DM+MDD correlated with visuo-spatial dysfunction in frontal white matter |
| Moore29 | 31P | Beta NTP decreased in basal ganglia Total NTP decreased in basal ganglia |
| Volz30 | 31P | Beta NTP decreased in frontal lobes Total NTP decreased in frontal lobes |
| Renshaw31 | 1H and 31P |


