Figure 12.1. The CMA70 brain catheter. The Luer (A) connects to the CMA106 syringe. The inflow (B) and outflow (C) tubes are surrounded by a sliding cuff (D) which is used to suture the catheter to the skin of the scalp. The two tubes join in the cylindrical “liquid cross” (E) which connects to the shaft (F) and the dialysis membrane (G) with a gold tip. The protective tube is not shown. The vial holder and the microvial are shown in the lower panel. The holder needle penetrates the membrane of the microvial when the vial is pushed into the holder. The sample is collected in the neck of the bottle just under the membrane.
1 = Needle; 2 = Membrane; 3 = Sample; 4 = Vial holder; 5 = Microvial.
The dialysis membrane at the distal end of a microdialysis catheter functions like a blood capillary. Chemical substances from the interstitial fluid diffuse across the membrane into the perfusion fluid inside the catheter. The recovery of a particular substance is defined as the concentration in the dialysate expressed as a percent of the concentration in the interstitial fluid.
A low perfusion flow and a long dialysis membrane yield a high recovery. If the membrane is long enough and the flow slow enough, the concentration in the dialysate will approach the concentration in the interstitial fluid, i.e., recovery will be close to 100%. In the human brain the perfusion flow is ordinarily 0.3 µl/min and the length of the membrane is usually 10 mm (allowing exact positioning in relation to a lesion). Under these conditions, the recovery has been estimated to be approximately 70% [4]. By using a longer membrane, e.g., 30 mm, and the same perfusion flow, it is possible to reach 100% recovery in the human brain.
It is important to realize that the concentration in the dialysate depends not only upon the flow and the length of the membrane but also upon the supply of substances from the blood capillaries, as well as from uptake and release from cells. For example, the supply of glucose to the microdialysis catheter may decrease due to a decrease in the capillary blood flow or due to an increase in the cellular uptake of glucose.
The high recovery of substances that can be achieved in the human brain makes it possible to analyze most neurotransmitters and energy metabolites but also cytokines [5] and small proteins by using catheters with a high cut off (100,000 Dalton). The priority of most investigators of the human brain has been to arrive at a clinically useful application of microdialysis. Therefore, the majority of studies have been done on patients with severe brain trauma or hemorrhage, where analysis of the brain energy state is of direct clinical importance and where such knowledge may improve patient outcome. In this chapter, we have concentrated on the use of microdialysis for the detection and monitoring of ischemia and energy breakdown.
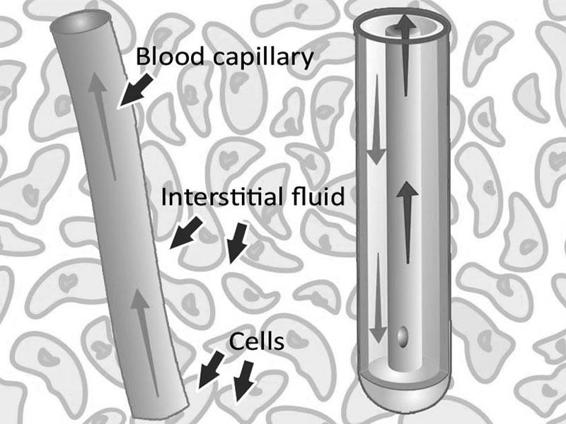
Figure 12.2. The microdialysis catheter takes up substances delivered by the blood, e.g., glucose and drugs, but also substances released from the cells, e.g., cellular metabolism markers.
12.3 Biochemical Markers of Ischemia and Cell Damage
The interstitial fluid is the “crossroads” of all substances passing between cells and blood capillaries. By monitoring this compartment in the brain, it is possible to obtain crucial information about the biochemistry of neurons and glia and how seriously the brain cells are affected by ischemia, hyperemia, trauma, hemorrhage, vasospasm, for example, as well as various physiological, pharmacological and surgical interventions during intensive care.
Although microdialysis samples essentially all small molecular substances present in the interstitial fluid, the use of microdialysis in neurointensive care has focused on markers of ischemia and cell damage. The reason is that they are of obvious importance for tissue survival, well understood from a biochemical point of view and easy to interpret in the clinical setting of intensive care.
Microdialysis tells us how cells react to an increase or decrease in the supply of oxygen and glucose. However, while normal brain tissue may not suffer when exposed to a moderate decrease in oxygen and glucose, vulnerable cells in the pericontusional penumbra may simply not survive. Subsequently, severe secondary damage to brain tissue may pass unnoticed if microdialysis is not performed in the most vulnerable tissue of the brain (see below).
12.4 Lactate/Pyruvate Ratio
The lactate/pyruvate ratio is a well-known marker of changes in the redox state of cells caused by ischemia and mitochondrial dysfunction [6]. Pyruvate is formed from glucose in the anaerobic part of glycolysis to generate two molecules of ATP. It enters the citric acid cycle provided that oxygen is available. The citric acid cycle is the dominant producer of energy and yields 32 molecules of ATP. If the tissue is exposed to ischemia (a decrease in blood flow causing an inadequate supply of oxygen and glucose), the production of ATP from the citric acid cycle decreases.
The cells attempt to compensate for the decrease in ATP production by increasing the turnover of glucose in the anaerobic part of glycolysis. During this process it is necessary to regenerate NAD+ from NADH by converting pyruvate to lactate, which causes an increase in lactate and the lactate/pyruvate ratio (Figure 12.3).
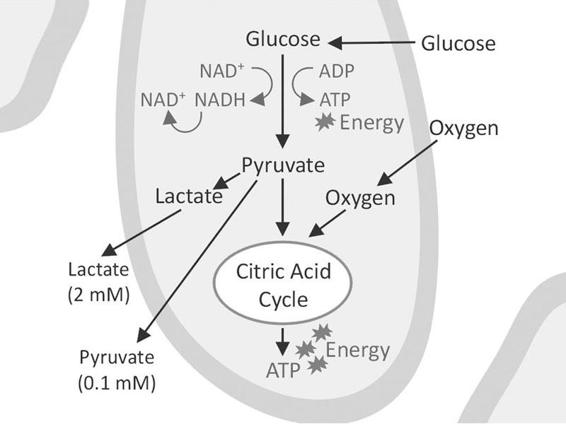
Figure 12.3. A cell surrounded by interstitial fluid. Anaerobic glycolysis leads to the production of lactate and pyruvate that enter the surrounding fluid where they can be taken up by the microdialysis catheter. The aerobic part of glycolysis utilizes the citric acid cycle to produce the bulk of energy in the form of ATP.
The decrease in glucose delivery from the blood capillaries causes a fall in glucose concentration in the interstitial fluid. This leads to a decreased production of pyruvate due to a lack of glucose. In the dialysate this is seen as a fall in pyruvate and a further increase in the lactate/pyruvate ratio, i.e., a worsening of the ischemia. In a recent study, Vespa et al. [7] compared the lactate/pyruvate ratio by means of positron emission tomography (PET) to investigate the metabolism of glucose and oxygen; they concluded that an increase in the lactate/pyruvate ratio is a sign of a metabolic crisis, which is not necessarily synonymous with ischemic cell damage. This emphasizes the importance of using glycerol as a marker of cell membrane decomposition and cell damage (see below) in addition to the lactate/pyruvate ratio.
The use of a ratio between the two analytes has the advantage of abolishing the influence of changes in catheter recovery, as such a change will similarly influence both lactate and pyruvate. Therefore, the lactate/pyruvate ratio may be used to compare the redox state of different tissues in one individual, as well as in different individuals. The ratio is essentially the same in all tissues, i.e., about 20. We consider a ratio >25 as a sign of beginning tissue ischemia.
Lactate alone is a less good marker of the redox state of cells, as an increase in lactate may be due to hypoxia, ischemia as well as hypermetabolism [8].
12.5 Glycerol
Glycerol is an integral component of the cell membrane. Loss of energy due to ischemia leads to an influx of calcium into the cells, activation of phospholipases, and eventually cell membrane decomposition which liberates glycerol into the interstitial fluid [9].
Considering the fast changes in glycerol concentration in vulnerable pericontusional brain tissue, which are often related to changes in the cerebral perfusion pressure (CPP), it seems likely that the cells may react by “leaking” more or less glycerol according to the severity of the ischemia. The normal glycerol concentration in the dialysate from the brain when using a 10 mm dialysis membrane and a perfusion flow of 0.3 µl/min is approximately 50-100 µM [10].
In subcutaneous adipose tissue, on the other hand, glycerol originates from the splitting of fat (triglycerides) into free fatty acids and glycerol. This process is controlled mainly by the local sympathetic noradrenalin nerve terminals. Glycerol in the subcutaneous tissue is therefore an indirect marker of sympathetic tone in the dermatome where the catheter is inserted [11].
During intensive care a subcutaneous catheter may be inserted in the periumbilical region to monitor glycerol as an indicator of sympathetic “stress” and glucose as an indicator of systemic blood glucose levels [12]. The normal glycerol concentration in the dialysate from the subcutaneous tissue of a sedated patient when using a microdialysis catheter with a 30 mm dialysis membrane and a perfusion flow of 0.3 µl/min is approximately 200 µM.
12.6 Glutamate
During ischemia there is an increased release of glutamate, which may open neuronal calcium channels and initiate a pathological influx of calcium that causes cell damage. An increasing level of glutamate in the dialysate from the human brain is an indirect marker of cell damage. However, it is difficult to interpret changes in brain glutamate because glutamate release from neurons is mixed with a metabolic pool of glutamate.
The normal glutamate concentration in the dialysate from the brain of a sedated patient when using a 10 mm dialysis membrane and a perfusion flow of 0.3µl/min is approximately 10 µM and somewhat higher in a non-sedated patient [10].
12.7 Glucose
As the primary source of energy to the brain, glucose is an important marker of changes in brain metabolism. Glucose levels in the dialysate from the human brain may, however, change for several reasons:
- Ischemia – an insufficient capillary blood flow. Less glucose is delivered to the microdialysis catheter and the concentration in the dialysate decreases.
- Hyperemia – an increase in capillary blood flow. More glucose is delivered to the microdialysis catheter and the concentration in the dialysate increases.
- Hyperglycemia – increased blood glucose concentration due to metabolic stress, insulin resistance or intravenous infusion of glucose. More glucose is delivered to the microdialysis catheter and the concentration in the dialysate increases.
- Hypermetabolism or hypometabolism – increased or decreased uptake of glucose into the cells, e.g., a shift from aerobic to anaerobic metabolism. This will affect the amount of glucose in the tissue available to the microdialysis catheter, causing a decreased or increased concentration in the dialysate.
The fact that the glucose concentration in the dialysate may change for several reasons makes it difficult to interpret glucose levels unless glucose is compared to other markers. A subcutaneous microdialysis catheter implanted in the periumbilical region of the abdomen is of great value, as it will reveal changes in systemic blood glucose. If a change in the brain is parallel to a change in subcutaneous glucose, the change is in all probability due to a variation in systemic blood glucose.
If the change in brain glucose is not parallel to a change in systemic blood glucose, it is probably due to altered brain capillary perfusion, e.g., hyperemia or hyper- or hypometabolism, which causes a simultaneous increase or decrease in both lactate and pyruvate.
On the other hand, if a decrease in brain dialysate glucose coincides with an increase in lactate and a decrease in pyruvate, it is in all probability due to ischemia. By observing the changes in lactate and pyruvate it is possible to interpret the changes in glucose.
12.8 Implanting and Positioning of Microdialysis Catheters
Microdialysis monitors the local chemistry of an area of the brain roughly corresponding to the length of the catheter membrane and a diameter of a few mm. The interpretation of microdialysis data will therefore depend upon the position of the catheter in relation to the existing pathology. The first clinical microdialysis catheters to appear on the market were not visible on computed tomography (CT) scans. Several clinical studies in the literature are difficult to interpret, as we do not know if the microdialysis catheters ended up in normal tissue or penumbra tissue surrounding a contusion or in damaged or dead tissue.
Today’s catheters have a gold tip which renders them visible on CT scans. For the interpretation of bedside microdialysis data it is of great importance that the position of a catheter in the brain is can be visualized by CT [13]. Only then can microdialysis data be effectively used to provide an early warning of secondary insults and to evaluate the result of various clinical interventions aimed at improving the condition of brain tissue during neurointensive care.
It is important to adopt a consistent strategy of where to place catheters: in the penumbra surrounding a mass lesion; in the region most likely to be affected by vasospasm after subarachnoid hemorrhage; and/or in “normal” brain tissue. The general principles of where to place catheters in different categories of patients have been agreed upon in a consensus paper authored by experienced users of microdialysis in neurointensive care [14].
In the intensive care unit (ICU) it is often convenient to place catheters through cranial bolts, thus obviating the need to bring the patient into the operating room. However, it is difficult to position the catheter in a selected region of the brain when using bolts, as there is no provision for changing catheter depth or angle. In the ICU, catheters are therefore often tunnellated and placed through burr holes to better aim for a predefined region of the brain [15].
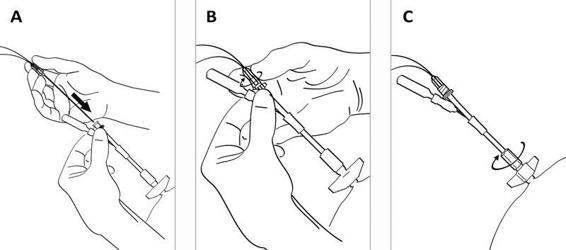
Figure 12.4. (A). After fixing the bolt to the skull bone, the CMA 70 microdialysis bolt catheter is passed through the entrance tube. (B). The Luer lock connector of the catheter is fixed to the tube connector. (C). The tube channels are sealed by tightening the expansion nut.
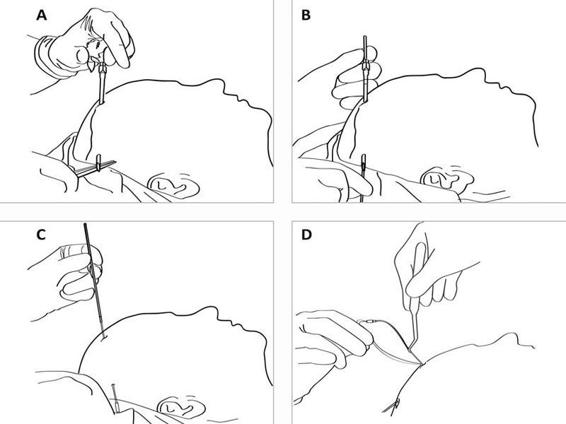
Figure 12.5. (A). After drilling a hole in the skull bone and opening the dura, a tunnelator is passed under the scalp. (B). The CMA 70 microdialysis catheter is passed through the tunnelator and the tunnelator is then retracted. (C). The protection tube is removed from the catheter by turning it counter-clockwise. (D) The catheter is held firmly at the shaft (without touching the membrane) by a forceps or by hand and passed into the brain through the hole in the dura. The inlet and outlet tubings are stretched and the fixation cuff is sutured to the skin (see Figure 12.6).
In craniotomy, it is easy to place the catheter under visual inspection into the pericontusional penumbra of a lesion or in the territory of the parent vessel of an aneurysm. The catheter is tunnelated under the scalp and a small incision is made through the dura, subarachnoidea and pia. The dialysis membrane is positioned in the penumbra, usually 1 cm from the border of the lesion or in the region most likely to be affected by vasospasm after hemorrhage. In our experience, we have seen no consistent difference in the chemistry whether the catheter is placed in the white or the gray matter. However, it is to be expected that the levels of neurotransmitters may vary depending upon the position. The cuff, which slides over the inflow and outflow tubing, is sutured tightly to the skin so that the catheter cannot be pulled out if, for example, the attached microdialysis pump drops out of the patient’s bed.
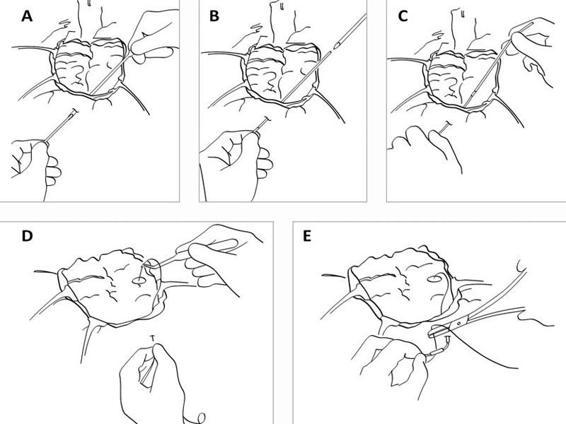
Figure 12.6. (A). During open surgery the dura is repositioned. A hole is cut in the dura where the catheter will be inserted. A tunnelator is passed under the scalp. The CMA 70 microdialysis catheter is passed through the tunnelator. (B). The tunnelator is retracted. (C). The protection tube is removed by turning it counter-clockwise. (D). The catheter is held firmly at the shaft (without touching the membrane) by a forceps or by hand and passed into the brain through the hole in the dura. (E). The inlet and outlet tubings are stretched and the fixation cuff is sutured to the skin.
Irrespective of how the catheter is introduced into the brain, it is important to locate the gold tip of the catheter on the first CT scan performed after implantation. The catheter location will determine how relevant the biochemical data are for the interpretation of brain pathology and the early warning of a secondary insult.
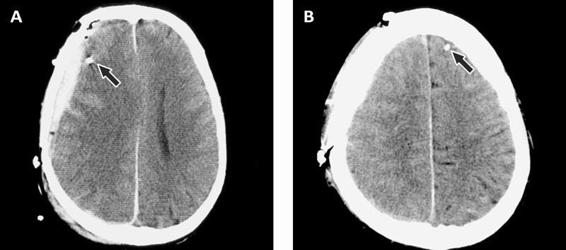
Figure 12.7. (A). Epidural hematoma. The arrow points to the gold tip which is easily seen on the CT scan. (B). Contralateral side showing the visible gold tip.
12.9 Selecting Perfusion Flow
The flow of a standard, commercially available microdialysis pump is 0.3 µl/min, which yields approximately 70% recovery when using a 10 mm dialysis membrane [16,17]. Catheters with a 20 or 30 mm membrane will give nearly 100% recovery in the brain. There may be situations where a higher perfusion flow is necessary, for example, when sampling is frequent and the 0.3 µl/min flow rate does not provide enough sample volume to permit analysis. Such may be the case during intraoperative microdialysis when samples are changed every minute in order to monitor ischemia during temporary clipping, for example. A flow rate of 1 µl/min will yield a recovery of approximately 30% using a 10 mm membrane [17].
Another reason to use a high perfusion flow is to reduce the time delay that occurs when the dialysate flows from the brain to the microvial. The delay is in the range of 20 min when the perfusion flow rate is 0.3 µl/min, but it can be reduced to close to 1 min if the flow is increased to 5 µl/min. In this way, it is possible to react to changes in brain chemistry during surgical procedures, for example, ischemia resulting from brain retraction [18]. During neurointensive care, however, because chemical changes usually take place over several hours, a 20-min delay is of minimal consequence.
During normal intensive care it is highly advisable to use the standard flow and standard catheter so that the data between patients in the same or different clinical departments can be compared over time.
12.10 Multimodal Monitoring
In order to make effective use of microdialysis data it is essential to relate them to other data collected at the bedside. This may be done using software which allows for integrating data from the microdialysis analyzer, the ICU monitor displaying intracranial pressure (ICP) and cerebral perfusion pressure (CPP), a tissue oxygen analyzer, the ventilator, the infusion pumps, or other machines.
This “multimodal monitoring” allows for the display of all data as trend curves on one computer screen. It creates the framework for individualizing therapy on the basis of clinical status, brain tissue chemistry and the effect of therapeutical interventions.
12.11 Interpreting Microdialysis Data
During intensive care, brain chemistry often changes profoundly in the patient. At our present state of knowledge, it is impossible to interpret every change; however, major pathological states manifest themselves as dramatic increases or decreases in biochemical markers.
The first hours of microdialysis data give an indication of how severely the brain tissue is affected in the pericontusional penumbra. This information gives a reference value for determining whether tissue physiology is improving or deteriorating.
The implantation of a microdialysis catheter inflicts a certain amount of trauma to the brain tissue. This is well known from animal studies and it usually takes an hour or more before baseline values are reached after an implantation. In the human brain this is particularly evident for glutamate and sometimes for glycerol. In a clinical setting, however, the time between catheter implantation and the actual use of microdialysis data is often longer than 1 hour due to the various different procedures taking place around the patient.
The range from normal to pathological levels of different analytes are well known from normal brain tissue in patients with posterior fossa tumours [10] and from damaged as well as “normal” brain tissue in patients with traumatic brain injury (TBI) or subarachnoid hemorrhage (SAH). Normal levels differ strongly from pathological levels in severe brain trauma (see below).
12.12 Clinical Studies
The following is a brief account of studies where microdialysis was applied to neurosurgery and neurointensive care. The purpose is to present a selection of papers that describe biochemical findings of particular relevance for the early detection of secondary damage and the evaluation of therapeutic interventions during surgery and neurointensive care.
Microdialysis of the human brain was first performed in 1987 at the Karolinska Institute to alleviate tremor in a Parkinson patient with a thalamic lesion [19]. The catheter was introduced stereotaxically and samples were collected every 10 min and analyzed for a vast array of neurotransmitters and metabolites. We found that baseline levels of the various analytes in the dialysate were much higher than in animals due to the possibility of using a much larger dialysis membrane. Even more importantly, baseline levels were reached much faster probably due to the small implantation trauma in relation to the size of the human brain.
We performed the first study on brain ischemia in Uppsala by monitoring the brain chemistry in tissue which was resected during tumour surgery [20]. This led to a study of microdialysis during neurointensive care of TBI and SAH, in which changes especially in lactate, pyruvate and glutamate were described [21].
The experience from Karolinska and Uppsala prompted us, in cooperation with neurosurgery in Lund, to develop flexible catheters more suitable for implantation in the human brain and a microdialysis analyzer (CMA Microdialysis, Stockholm) designed for bedside use.
12.12.1 Subarachnoid Hemorrhage
Microdialysis has been used extensively for monitoring ischemia in SAH patients. Hamberger et al. and Runnerstam et al. found that the level of consciousness in the postoperative phase was inversely related to the total amino acid concentration in the neuronal environment adjacent to a SAH [22,23].
Persson et al. found that severe ischemia, e.g., temporary clipping, severe hypoxemia or infarct development within or close to the probe area resulted in a clearly detectable increase in the lactate/pyruvate ratio [8]. In many instances this was followed by an increase in glutamate when the lactate/pyruvate ratio reached values of approximately 25 or above. The lactate/pyruvate ratio appeared to be a more reliable marker compared to lactate alone. As opposed to lactate T, there was a statistically significant correlation between the lactate/pyruvate ratio and clinical outcome during days 0-4.
In a study combining microdialysis and PET, Enblad et al. concluded that the energy-related metabolites (lactate, lactate/pyruvate ratio and hypoxanthine) may be used as extracellular markers of ischemia [24].
Säveland et al. found that increased levels of glutamate correlate well with clinical course and neurological symptoms [25]. However, a rise of glutamate in one region did not necessarily parallel to the rise in the other regions. Nilsson et al. described the detailed biochemistry of vasospasm and concluded that lactate and glutamate may be the most sensitive and early markers for incipient ischemia, followed by the lactate/pyruvate ratio and glycerol, during manifest ischemia and cell degeneration [26]. They found that metabolic changes preceded the increase in blood flow velocity as recorded by transcranial Doppler (TCD).
In a series of studies, Unterberg and co-workers placed microdialysis catheters 25 to 35 mm into the parenchyma of the vascular territory most likely to be affected by vasospasm [27,28] concluded that microdialysis “can be carried out routinely in the ICU setting to detect and monitor patterns of metabolic impairment. Compared to TCD, it has a remarkable specificity, making it a well-suited method to monitor delayed ischemic neurological deficits following aneurysmal hemorrhage”.
Sarrafzadeh et al. found that lactate and glutamate are early markers of clinical vasospasm, followed by lactate/pyruvate ratio and glycerol, during manifest vasospasm in patients with SAH [29] They stated that bedside cerebral microdialysis is a safe technique for the indication of acute and delayed ischemic neurological deficits in SAH patients when the catheter is inserted into the region of interest. They went on to suggest that “early detection of metabolic changes might also allow optimization of standard intensive care treatments, such as triple-H therapy”. Skjøth-Rasmussen et al. found that the ischemic pattern after SAH preceded the occurrence of delayed ischemic neurological deficits by a mean interval of 11 hours [30].
12.12.2 Traumatic Brain Injury
Persson and Hillered (1992) conducted the first microdialysis studies of the human brain after traumatic brain injury (TBI). They found that microdialysis can be used for long-term studies of energy-related metabolites and amino acids, e.g., glutamate, and that the fluctuation of these substances corresponded to various clinical events “presumably involving hypoxia/ischemia”. They used the lactate/pyruvate ratio as a marker for energy disturbance in the brain. This ratio is known to reflect the redox potential of the tissue and thereby the severity of ischemia.
They presented several arguments for the reliability of the lactate/pyruvate ratio in comparison to the use of the absolute concentration of other substances in the dialysate:
Related posts:
 Acute Renal Injury in the Neurocritical Patient
Neurocritical Care of Patients With Arteriovenous Malformations
The Diagnosis and Management of Central Nervous System Infections in the Neurocritical Care Unit
Stroke Units: Organization, Past, Present and Future
Gastrointestinal Disorders in the Neurocritical Patient
Concepts and Management of Brain Death and Management of Potential Organ Donation
Acute Renal Injury in the Neurocritical Patient
Neurocritical Care of Patients With Arteriovenous Malformations
The Diagnosis and Management of Central Nervous System Infections in the Neurocritical Care Unit
Stroke Units: Organization, Past, Present and Future
Gastrointestinal Disorders in the Neurocritical Patient
Concepts and Management of Brain Death and Management of Potential Organ Donation
Stay updated, free articles. Join our Telegram channel

Full access? Get Clinical Tree


