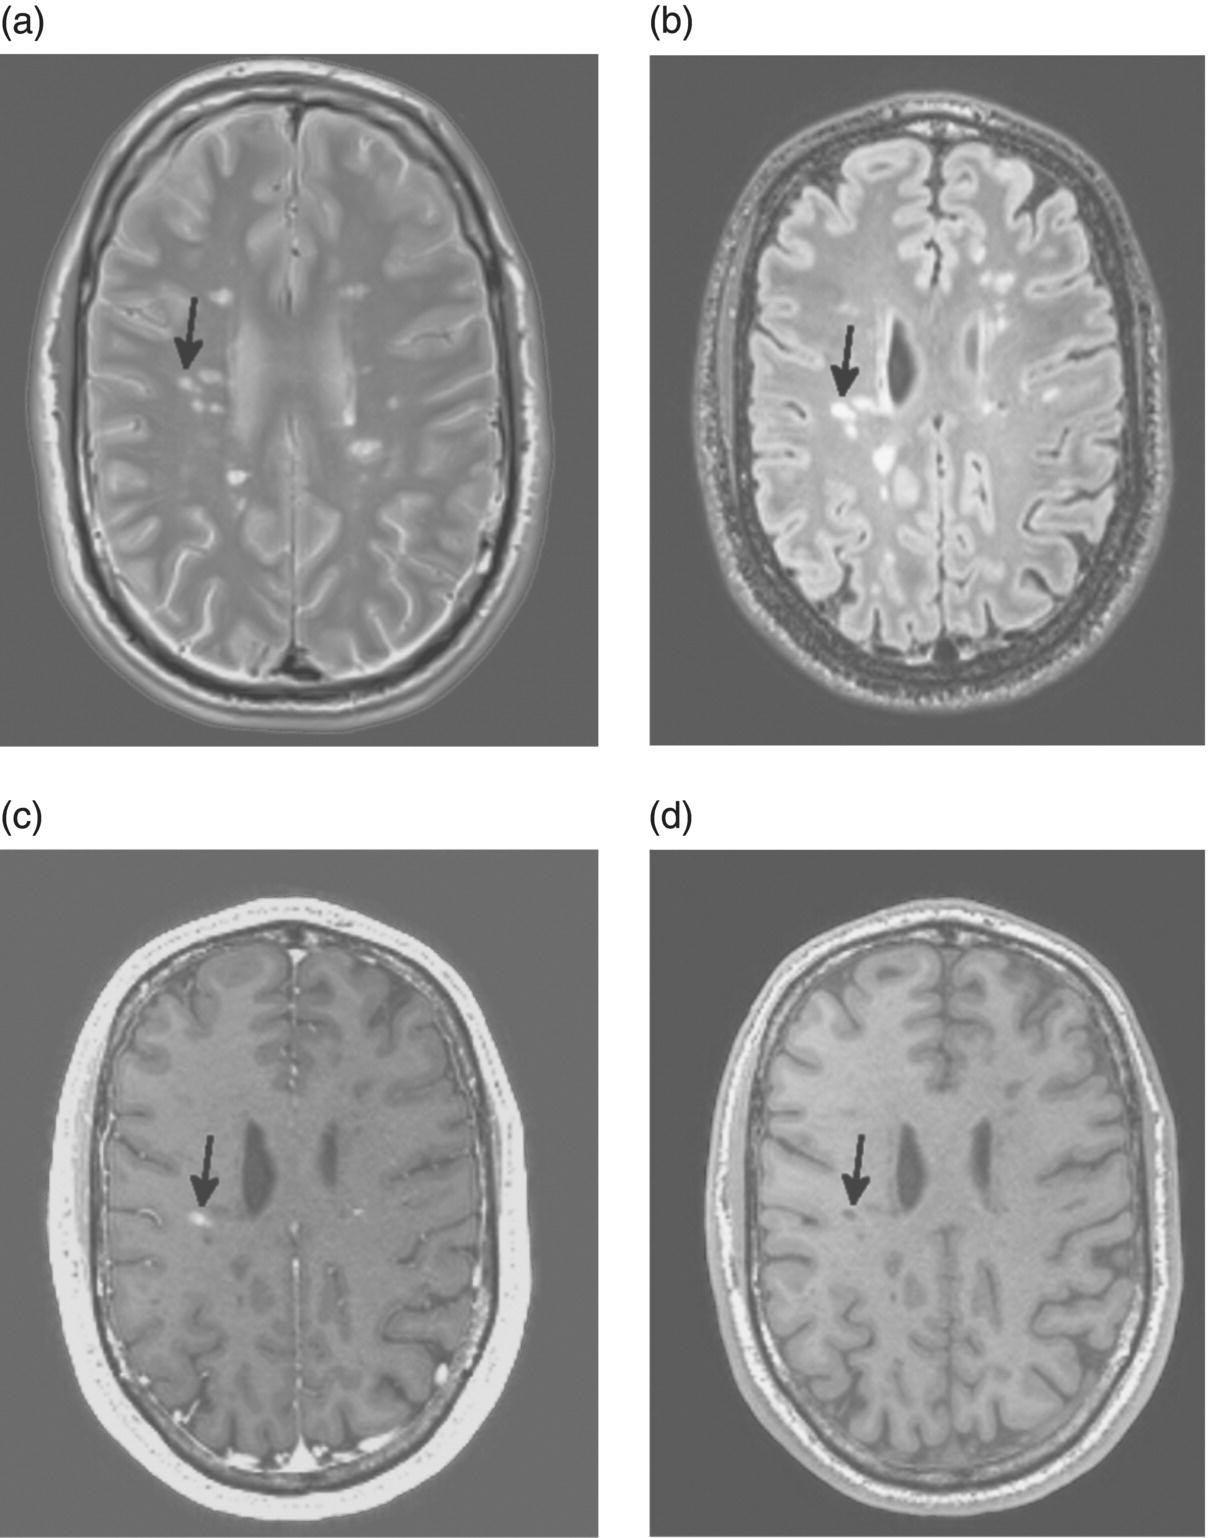
4 María I. Gaitán1, 2 and Daniel S. Reich1 1 National Institute of Neurological Disorders and Stroke, National Institutes of Health, Bethesda, MD, USA 2 Dr. Raúl Carrea Institute for Neurological Research, FLENI, Buenos Aires, Argentina The introduction of magnetic resonance imaging (MRI) in multiple sclerosis (MS) has revolutionized our ability to diagnose the disease and monitor treatment response in the clinic and in clinical trials. It has, no less, deepened and transformed our understanding of the pathologic processes involved in the development and progression of the disease. On average, MRI is about 5–10 times more sensitive to ongoing inflammatory demyelination than clinical assessment (Harris et al. 1991) and is greatly superior to any other imaging method for lesion detection. McDonald and colleagues introduced MRI into the diagnostic criteria, emphasizing the presence of brain and spinal cord lesions and enabling earlier, more sensitive, and more specific diagnosis than considering clinical symptoms and signs alone. These MRI-based diagnostic criteria have twice been revised since they were first established in 2001, most recently in 2010 (Polman et al. 2011) (Table 4.1). Table 4.1 2010 MRI Criteria for Multiple Sclerosis Source: Polman et al. (2011). Reproduced with permission of Wiley. If the criteria are fulfilled and there is no better explanation for the clinical presentation, the diagnosis is “MS”; if suspicious, but the criteria are not completely met, the diagnosis is “possible MS”; if another diagnosis arises during the evaluation that better explains the clinical presentation, then the diagnosis is “not MS.” CNS, central nervous system; CSF, cerebrospinal fluid; DIS, dissemination in space; DIT, dissemination in time; IgG, immunoglobulin G; MRI, magnetic resonance imaging; MS, multiple sclerosis; PPMS, primary progressive multiple sclerosis. aAn attack (relapse; exacerbation) is defined as patient-reported or objectively observed events typical of an acute inflammatory demyelinating event in the CNS, current or historical, with duration of at least 24 h, in the absence of fever or infection. It should be documented by contemporaneous neurological examination, but some historical events with symptoms and evolution characteristic for MS, but for which no objective neurological findings are documented, can provide reasonable evidence of a prior demyelinating event. Reports of paroxysmal symptoms (historical or current) should, however, consist of multiple episodes occurring over not less than 24 h. Before a definite diagnosis of MS can be made, at least one attack must be corroborated by findings on neurological examination, visual evoked potential response in patients reporting prior visual disturbance, or MRI consistent with demyelination in the area of the CNS implicated in the historical report of neurological symptoms. bClinical diagnosis based on objective clinical findings for two attacks is most secure. Reasonable historical evidence for one past attack, in the absence of documented objective neurological findings, can include historical events with symptoms and evolution characteristic for a prior inflammatory demyelinating event; at least one attack, however, must be supported by objective findings. cNo additional tests are required. However, it is desirable that any diagnosis of MS be made with access to imaging based on these criteria. If imaging or other tests (for instance, CSF) are undertaken and are negative, extreme caution needs to be taken before making a diagnosis of MS, and alternative diagnoses must be considered. There must be no better explanation for the clinical presentation, and objective evidence must be present to support a diagnosis of MS. dGadolinium-enhancing lesions are not required; symptomatic lesions are excluded from consideration in subjects with brainstem or spinal cord syndromes. MRI has also provided new insights into the pathogenesis of the disease, particularly with respect to the blood–brain barrier. In this regard, the key observation was that MRI performed after intravenous injection of chelates of gadolinium can detect blood–brain barrier opening occurring during lesion development (Grossman et al. 1986). MRI scanning also enabled the noninvasive and quantitative characterization of brain atrophy in MS, which occurs two to three times more rapidly than in the general population and which is generally thought to reflect the neurodegeneration that underlies the relentless accumulation of disability in progressive MS (De Stefano et al. 2010). MRI measurements such as T2 and T1 lesion volume, as well as the number of enhancing lesions, have also improved monitoring of the anti-inflammatory effects of disease-modifying therapies in clinical trials (Petkau et al. 2008). This chapter has three main parts. First, we present the MRI findings that are useful to note on initial examination of a patient being worked up for MS. Second, we describe the use of MRI to monitor disease evolution over time, emphasizing insights from clinical trials that can be used in the clinic. Finally, we briefly present some of the most promising advanced MRI techniques. On a gross anatomic level, MRI correlates well with pathology. Lesions visualized on MRI are usually small, round or oval in shape, asymmetrically distributed across the brain and spinal cord, and seen most readily in the white matter (Figure 4.1). Lesions are typically discrete at first and become more confluent as they accumulate. New lesions are usually clinically silent unless they substantially disrupt a clinically eloquent pathway, which happens most commonly in the optic nerve, brainstem, or spinal cord. However, even lesions in those locations can appear without accompanying symptoms. For differentiation of lesions due to MS from those due to other conditions, important features of lesions include morphology, signal intensity, location, and the presence and character of enhancement following gadolinium administration. Figure 4.1 Brain images of a 43-year-old man with active relapsing–remitting MS, performed on a 3 T scanner. (a) Proton density. (b) T2-FLAIR. (c) T1 without contrast. (d) T1 after injection of 0.1 mmol/kg gadobutrol. The arrows denote an enhancing lesion that was not present on the prior scan 1 month earlier. Note that the plane of section for the proton density image (a) is slightly different from that of the other images. Lesions in the acute phase are typically brighter than surrounding white matter (hyperintense) in proton density and T2 images, which most likely reflects a combination of inflammation, demyelination, and increased water content (edema), and they may have fuzzy borders. These same pathological characteristics, but particularly increased water content, cause acute lesions to be darker than surrounding white matter (hypointense) in T1 images. Enhancement (hyperintensity in T1 images) is due to opening of the blood–brain barrier. Older lesions are usually more sharply demarcated, persistently hyperintense in proton density and T2 images and isointense or hypointense in T1 images, and do not enhance with gadolinium. These changes in signal intensity reflect resolution of edema, clearance of cellular debris, remyelination, and gliosis. Brain lesions are commonly periventricular, juxtacortical (at the gray–white junction), and infratentorial (including brainstem and cerebellum), but they can occur anywhere. White matter lesions tend to have an ovoid configuration, to occur along the callososeptal interface, and to extend outward from the bodies of the lateral ventricles along the deep medullary veins (forming the so-called Dawson’s fingers). White matter lesions may also extend into the gray matter, including both cortex and deep nuclei (particularly the thalamus). Lesions may also develop directly within the gray matter; these lesions have been classified as either intracortical or subpial. Intracortical lesions are quite small and represent only about 10% of all cortical lesions. Subpial cortical lesions, which may represent 50% of the total seen in pathology studies, are not apparent in conventional MRI and are exceedingly difficult to detect reliably even in nonconventional MRI, although consensus guidelines for lesion identification using a technique called double inversion recovery (DIR) have been published (Geurts et al. 2011). Major reasons for the poor MRI contrast between normal gray matter and cortical lesions include partial volume effects (inclusion of multiple tissue types within individual voxels), less extracellular water, and the relative paucity of myelin compared to white matter. Lesions that are hypointense on T1-weighted spin-echo images are called black holes if they persist longer than 6 months, because they are thought to reflect areas of substantial tissue destruction (van Waesberghe et al. 1999). In fact, most newly formed lesions are T1 hypointense due to the presence of edema, but roughly 80% of these lesions become isointense (revert to the signal intensity of normal white matter) within a few months as the edema resolves and the damaged tissue partially repairs itself. Only approximately 20% of lesions remain hypointense after 6 months and meet the black hole definition (Bagnato et al. 2003). It is important to realize, however, that not all T1 images are alike, and many more lesions appear persistently hypointense on contemporary scans for technical reasons alone. Enhancement within an MS lesion indicates the presence of active inflammation and is the imaging correlate of a clinical relapse (although, as mentioned earlier, contrast-enhancing lesions occur much more commonly than relapses) (Katz et al. 1993). Contrast enhancement is usually a transient phenomenon in MS lesions, usually disappearing over 2–6 weeks but occasionally lasting longer. Lesion enhancement is less common in primary and secondary progressive MS. Old lesions may re-enhance if they reactivate, but it is often difficult to distinguish a re-enhancing lesion from a new lesion that develops adjacent to the old one. Enhancement may appear homogeneous throughout the lesion (the so-called nodular pattern), or it may appear only on the periphery (ring pattern). These differences may depend on the size of the lesion and the time interval between gadolinium injection and scan acquisition, rather than true differences in lesion biology (Gaitan et al. 2011). Brain atrophy occurs in MS at a rate of about 0.5% per year, about two to three times more rapidly than in healthy people of similar age (De Stefano et al. 2010). In clinical practice, an easy, practical, qualitative method for assessing brain atrophy is to use an ordinal scale based on global assessment of ventricular size and sulcal width. On this scale, atrophy is described as mild, moderate, or severe (Simon et al. 2006). With image-processing software, the brain volume can be normalized to the size of the cranial vault to generate the brain parenchymal fraction, a useful cross-sectional estimate of brain atrophy in MS (Fisher et al. 2008).
MRI in Diagnosis and Disease Monitoring
Introduction
Clinical Presentation
Additional Data Needed for MS Diagnosis
≥2 attacksa; objective clinical evidence of ≥2 lesions or objective clinical evidence of 1 lesion with reasonable historical evidence of a prior attackb
Nonec
≥2 attacksa; objective clinical evidence of 1 lesion
Dissemination in space, demonstrated by:
≥1 T2 lesion in at least 2 of 4 MS-typical regions of the CNS (periventricular, juxtacortical, infratentorial, or spinal cord)d; or
Await a further clinical attacka implicating a different CNS site
1 attacka; objective clinical evidence of ≥2 lesions
Dissemination in time, demonstrated by:
Simultaneous presence of asymptomatic gadolinium-enhancing and nonenhancing lesions at any time; or
A new T2 and/or gadolinium-enhancing lesion(s) on follow-up MRI, irrespective of its timing with reference to a baseline scan or
Await a second clinical attacka
1 attacka; objective clinical evidence of 1 lesion (clinically isolated syndrome)
Dissemination in space and time, demonstrated by:
For DIS:
≥1 T2 lesion in at least 2 of 4 MS-typical regions of the CNS (periventricular, juxtacortical, infratentorial, or spinal cord)d; or
Await a second clinical attacka implicating a different CNS site; and
For DIT:
Simultaneous presence of asymptomatic gadolinium-enhancing and nonenhancing lesions at any time; or
A new T2 and/or gadolinium-enhancing lesion(s) on follow-up MRI, irrespective of its timing with reference to a baseline scan; or
Await a second clinical attacka
Insidious neurological progression suggestive of MS (PPMS)
1 year of disease progression (retrospectively or prospectively determined) plus 2 of 3 of the following criteriad:
1. Evidence for DIS in the brain based on ≥1 T2 lesions in the MS-characteristic (periventricular, juxtacortical, or infratentorial) regions
2. Evidence for DIS in the spinal cord based on ≥2 T2 lesions in the cord
3. Positive CSF (isoelectric focusing evidence of oligoclonal bands and/or elevated lgG index)
MRI at presentation
Lesions
Signal intensity and morphology
Lesion location
Black holes
Contrast enhancement
Brain atrophy
Related posts:

Stay updated, free articles. Join our Telegram channel

Full access? Get Clinical Tree


