Figure 77.1. A 30-year-old male presented with pharmacoresistant seizures preceded by an aura of a tingling sensation deep in his throat, spreading to his left face, and then followed by left face clonus with occasional left arm posturing. Scalp EEG monitoring did not reveal any ictal anomaly. Previous high-resolution 3-tesla MRI was reported as normal. An FDG-PET study showed subtle hypometabolism involving the right frontal and temporal operculum. Ictal SPECT was nonlocalizing. MRI postprocessing of the GW junction was performed on 3D T1-weighted volumetric sequence. Review of the GW junction feature map led to the identification of a structural abnormality at the right frontal operculum (z > 4), as shown in (B), coregistered with the patient’s MRI in (A). This abnormality is concordant with magnetic source imaging interictal dipole localization (C) and seizure onset on stereo-EEG (D). Limited resection (E) included the abnormality and rendered the patient seizure free. F: Stereo-EEG (SEEG) implantation schema. G: Ictal onset on SEEG. R4-6 corresponds to red contacts in (D). Stimulation of R4-6 induced the habitual seizure of the patient, with the same ictal EEG pattern as shown in (G). H: Histopathology showing features of FCD ILAE type IIb with balloon cells (HE; original magnification = 200×). To date, the patient has been seizure free for more than 4 years.
Quantifying cortical thickening and signal hyperintensity, in addition to evaluating gray–white matter transition, provides a more comprehensive analysis of the complex and variable morphologic anomalies related to the various forms of FCD (63). Bernasconi et al. proposed morphologic and first-order texture models creating 3D maps of cortical thickness, gradient (transition between GM and WM), and a relative intensity operator designed to emphasize T1 signal hyperintensity. The first-order texture models were then combined into a single composite map to optimize visibility. In a group of 16 patients with histologically proven FCD, visual analysis of the composite map increased sensitivity by 30% when compared to conventional MRI visual analysis, while maintaining a high specificity (57). Figure 77.2 illustrates the application of first-order texture models to a patient with frontal lobe epilepsy.
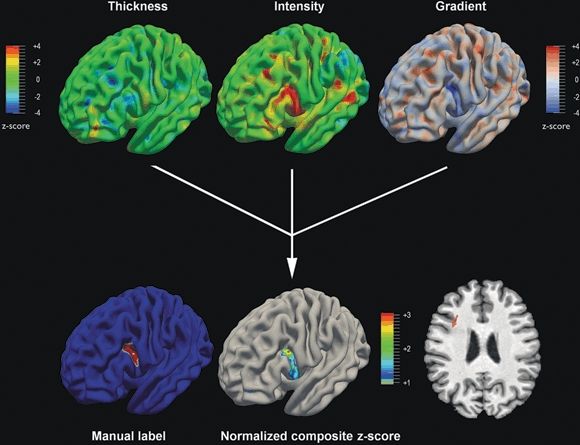
Figure 77.2. In this patient with frontal lobe epilepsy, high-resolution 3-tesla MRI was reported as normal, likely because of the subtle nature of the dysplasia, as demonstrated by the coronal T1-weighted MRI section (right lower corner, red arrow). The upper panels display the T1-weighted derived computational models normalized with respect to controls (z-score maps). The cortical thickness map is unremarkable. Conversely, the gray matter intensity map and the gradient map (modeling gray–white matter blurring) show significant anomalies. The normalized composite map identifies the lesional area as the only anomaly compared to controls and shows almost identical overlap with the lesion label obtained trough manual segmentation. Histopathology of the surgical specimen confirmed the diagnosis of FCD ILAE type IIb.
In a subsequent study of 23 patients with histologically proven FCD by Colliot et al., FCD lesions were characterized by simultaneous GM thickening, hyperintense signal, and blurring of the GM–WM transition in 78% of the patients. In all patients, the FCD lesion had at least two of these three characteristics. These MRI postprocessing features occurred regardless of the lesion volume, and they characterized not only large FCD lesions but also subtle ones that had been overlooked by visual inspection (64).
Antel et al. reported further development of this approach consisting of second-order texture analysis to quantify tissue organization through quantification of spatial relationships of gray-level intensity pairs that is less apparent to the human eye (65). Second-order features, including angular second momentum, contrast, and difference entropy, were used to develop automated pattern recognition using a novel two-stage Bayesian classifier to perform FCD lesion detection. This fully automated technique was applied to a group of 18 patients with histologically confirmed FCD, and correctly detected the FCD in 83% of them. In contrast, conventional visual MRI analysis was able to detect the FCD in only 61% of patients (65).
Notably, consistent with findings from voxel-based methods, computer-based models have revealed structural abnormalities that did not colocalize with any EEG abnormalities (62,65,66). Inspection of the feature maps revealed that these abnormalities exhibited patterns similar to FCD; however, visual analysis of these regions on the original structural MRI did not show any FCD. Given the absence of false-positive findings in normal controls, combined with report of diffuse or nonfocal cortical involvement in FCD (66–69), these clusters may indicate dysplastic abnormalities much more widespread across the hemispheres than the changes visible on the MRI and may explain, at least in part, why in some cases complete resection of MRI lesion does not always lead to seizure freedom.
MRI-visible FCD is sometimes considered the “tip of the iceberg” as the extent of the underlying structural pathology often goes beyond it. The exact delineation of the spatial extent of an FCD lesion carries significant clinical relevance as it can guide surgical resection. Colliot et al. proposed an automated method to segment FCD lesions on T1-weighted MRI using a combination of deformable models (70). In this approach, a feature-based level set driven by known MRI characteristics of FCD first separates lesions from nonlesional tissue. A second deformable model, designed to expand the previous result toward the cortical boundaries while preventing lateral intracortical motion into healthy tissues, finalizes the lesion segmentation. The quantitative evaluation in 18 FCD patients demonstrated strong agreement with expert manual labels (70).
Sulcal Morphometry
Sulcal and gyral abnormalities in ETLE patients are characterized by a spectrum of changes ranging from clefts of various depth to broad gyri (71), shallow or deep sulci, or gyral simplification (72,73). In the absence of visually discernible cortical thickening and GM blurring, these sulcal morphologic signs may be the only marker for cortical dysgenesis (71). Besson et al. reported that 85% of small FCD lesions that elude visual inspection were found at the bottom of an abnormally deep sulcus (74). Local weakness within the developing cortical mantle, co-occurrence of incomplete maturation, decreased neuronal density, and disrupted connectivity in the areas surrounding the FCD may play a role in the mechanism underlying this presentation (43,75). Regis et al. utilized a sulcal root/meridian parallel model for automated extraction, identification, and statistical analysis of cortical sulci (76). This approach was tested in a small series of MRI-negative patients with frontal lobe epilepsy, in whom subtle abnormal gyration patterns were found in the epileptogenic zone. Interestingly, small FCD not detected with MRI was found on histopathology, particularly in the depth of the posterior superior and intermediate frontal sulci (76).
CHALLENGES AND FUTURE DIRECTIONS
The detection of cortical abnormalities in patients with nonlesional epilepsy represents a considerable challenge for the future. The sensitivity to detect lesions that are undetectable by conventional MRI has been shown to increase proportionally to the number of techniques employed, suggesting that each contrast interrogates specific aspects of tissue structure. As subtle FCD lesions may only differ slightly from the normal cortex, a multivariate framework may be necessary to assess the combined sensitivity of various contrasts (43).
In the context of presurgical evaluation, results of MRI postprocessing will need to be confirmed with modalities that can characterize the pathophysiologic features of suspicious imaging findings, such as EEG, magnetic source imaging, PET, or SPECT. This is particularly important in the presence of multiple abnormalities detected by postprocessing, as illustrated in Figure 77.3. Understanding of postprocessing-positive structural changes outside the putative epileptogenic zone will require further correlative studies with electrophysiology, pathology, and long-term surgical follow-up.
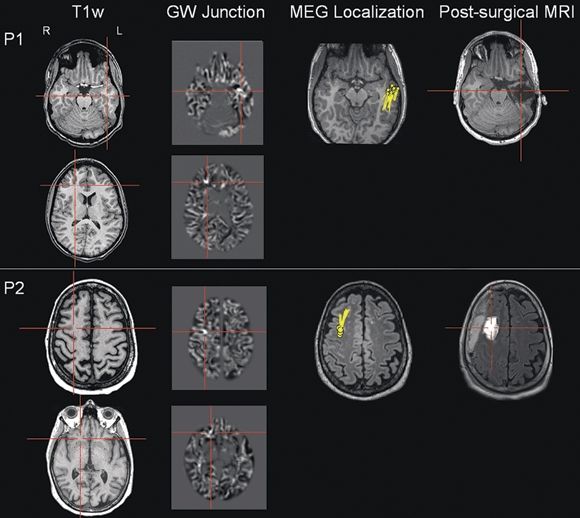
Figure 77.3. These two patients (P1 and P2) illustrate the importance of correlating MRI postprocessing findings with an electrophysiologic measure. For both patients, high-resolution 3-tesla MRI was reported as normal. In P1, scalp EEG evaluation showed left temporal interictal spikes, and ictal onset was in the left temporal and right centroparietal regions. In P2, scalp EEG evaluation showed right frontocentral interictal spikes, and ictal onset was in the right frontocentral and right temporoparietal regions. Within each panel, the conventional T1-weighted images are in the first column; the MRI postprocessing results of the GW junction are in the second column; the magnetic source imaging (MSI) localization is shown in the third column; the postsurgical MRI is shown in the last column. Each patient had two z > 4 abnormalities indicated by the GW junction feature map from postprocessing, but only one MSI focus. The abnormality concordant with the MSI focus was resected and led to seizure freedom in both patients (follow-up >12 months).
Improved spatial resolution and tissue contrast provided by ultra–high-field (7T) MRI is going to continue to expand the power of image processing. This will allow refining further the in vivo patterns of brain pathology within anatomically and functionally distinct areas and may provide the basis for more accurate histopathologic correlative studies (77). Future studies are needed to evaluate whether 7T MRI can provide additional diagnostic information in patients with a subtle, overlooked dysplastic lesion at lower field strengths.
CONCLUSION
Improving noninvasive localization is paramount in the surgical treatment of refractory epilepsies. As a noninvasive and cost-effective approach, MRI postprocessing is promising because unlike visual assessment, it provides quantitative, reliable, and reproducible data. For patients with lesions too subtle to be detected by conventional MRI visual analysis, MRI postprocessing techniques, integrated by a multimodality approach with other functional measures, allow for more accurate identification of epileptogenic abnormalities. Thus, MRI postprocessing techniques have the potential to increase the diagnostic yield of MRI in any epilepsy center utilizing a standardized epilepsy protocol on a 1.5-T or 3-T scanner. Moreover, these techniques have the potential to reveal the extent of cortical abnormalities invisible to the eye, which could further improve surgical outcomes. It is our hope that MRI postprocessing techniques will be used as an important complement to the test battery of existing presurgical evaluation in an increasing number of epilepsy centers.
References
1. Bien CG. Characteristics and surgical outcomes of patients with refractory magnetic resonance imaging-negative epilepsies. Arch Neurol. 2009;66:1491–1499.
2. Jeha LE. Surgical outcome and prognostic factors of frontal lobe epilepsy surgery. Brain. 2007;130:574–584.
3. Tellez-Zenteno JF, Hernandez Ronquillo L, Moien-Afshari F, et al. Surgical outcomes in lesional and non-lesional epilepsy: a systematic review and meta-analysis. Epilepsy Res. 2010;89(2–3):310–318.
4. Collins DL, Neelin P, Peters TM, et al. Automatic 3D intersubject registration of MR volumetric data in standardized Talairach space. J Comput Assist Tomogr. 1994;18(2):192–205.
5. Salmond CH. Distributional assumptions in voxel-based morphometry. Neuroimage. 2002;17:1027–1030.
6. Ashburner J, Friston KJ. Voxel-based morphometry—the methods. Neuroimage. 2000;11:805–821.
7. Wiebe S, Blume WT, Girvin JP, et al. A randomized, controlled trial of surgery for temporal-lobe epilepsy. N Engl J Med. 2001;345(5):311–318.
8. Jackson GD, Berkovic SF, Tress BM, et al. Hippocampal sclerosis can be reliably detected by magnetic resonance imaging. Neurology. 1990;40(12):1869–1875.
9. Jackson GD, Berkovic SF, Duncan JS, et al. Optimizing the diagnosis of hippocampal sclerosis using MR imaging. AJNR Am J Neuroradiol. 1993;14(3):753–762.
10. Jack CR Jr, Rydberg CH, Krecke KN, et al. Mesial temporal sclerosis: diagnosis with fluid-attenuated inversion-recovery versus spin-echo MR imaging. Radiology. 1996;199(2):367–373.
11. Bernasconi N, Bernasconi A, Caramanos Z
Related posts:


Stay updated, free articles. Join our Telegram channel

Full access? Get Clinical Tree


