Fig. 12.1
Representative confocal 3-dimensional reconstructed images showing GFAP-immunoreactivity (IR) astrocytes in the (DG), cornus ammonis 1 (CA1) and cortex (EC) of animals at 3 months (a, e and i), 9 months (b, f and j), 18 months (c, g and k) and 24 months of age (d, h and l), respectively. (Reproduced from Rodriguez et al. (2013b) with permission.)
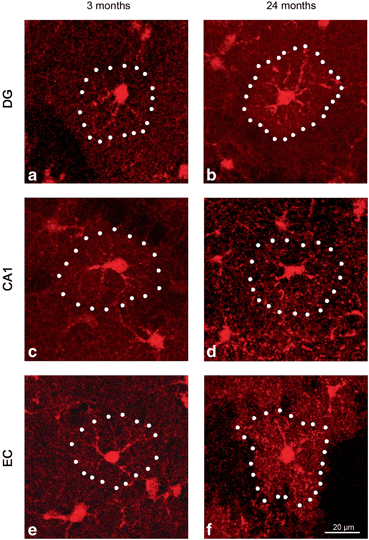
Fig. 12.2
Representative confocal 3-dimensional reconstructed images showing s100β-IR astrocytes in the DG, CA1 and EC of animals at 3 months (a, c and e) and 24 months of age (b, d and f), respectively. (Reproduced from Rodriguez et al. (2013b) with permission.)
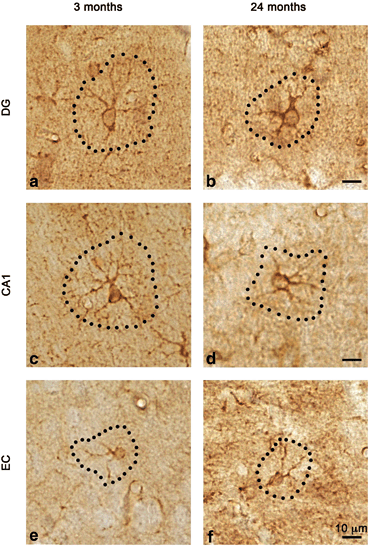
Fig. 12.3
Light micrographs showing the morphology and cell area of GS positive astrocytes in the DG, CA1 and EC of 3-month-old mice (a, c and e, respectively) and 24-month-old (b, d and e, respectively). (Reproduced from Rodriguez et al. (2013b) with permission.)
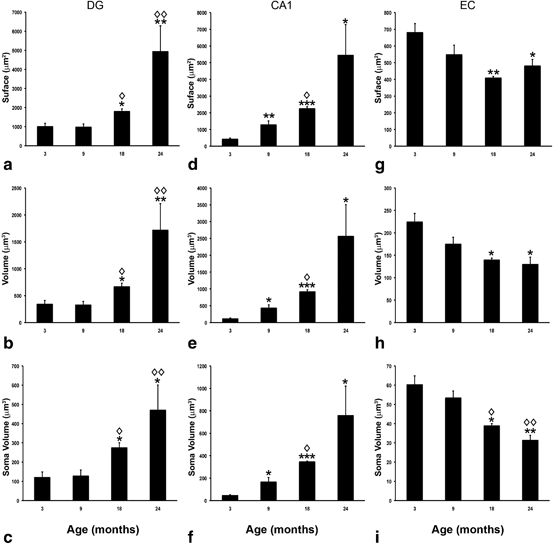
Fig. 12.4
Bar graphs showing the regional comparisons of GFAP surface, volume, and soma volume in the DG (a–c), CA1 (d–f) and EC (g–i) across ages. Bars represent mean± SEM (*p ≤ 0.05; **p ≤ 0.01; ***p ≤ 0.0001 compared with 3 months of age; ◊ p ≤ 0.05; ◊◊ p ≤ 0.01 compared with 9 months of age; in DG, n = 6, 7, 3 and 4 for 3, 9, 12 and 18 months, respectively; in CA1, n = 4, 3, 3, 4 for 3, 9, 12 and 18 months, respectively; in EC, n = 4,5, 3, 3 for 3, 9, 12 and 18 months, respectively). (Reproduced from Rodriguez et al. (2013b) with permission.)
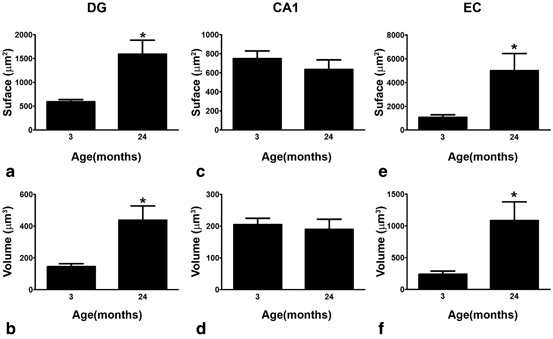
Fig. 12.5
Bar graphs showing the regional comparisons of s100β-IR surface area and volume in the DG (a and b), CA1 (c and d) and EC (e and f) at 2 and 24 months of age. Bars represent mean ± SEM (*p ≤ 0.05 compared with 3 months of age; in DG, n = 3 and 4 for 3 and 24 months, respectively; in CA1, n = 3 for both 3 and 12 months; in EC, n = 4 and 3 for 3 and 12 months, respectively). (Reproduced from Rodriguez et al. (2013b) with permission.)
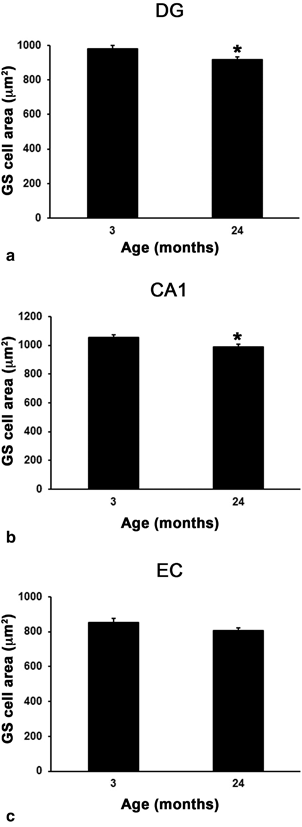
Fig. 12.6
Bar graph showing regional comparison of GS-positive cell area in the DG (a), CA1 (b) and EC (c) at 3 and 24 months of age (*p ≤ 0.05 compared with 3 months of age; in DG, n = 4 for both 3 and 24 months; in CA1, n = 4 and 5 for 3 and 12 months, respectively; in EC, n = 4 for both 3 and 12 months). (Reproduced from Rodriguez et al. (2013b) with permission.)
12.3.2 Astrocytes and β-Amyloid
There are several sporadic reports implicating astrocytes in the accumulation of β-amyloid through either compromised β-amyloid clearance or increased β -amyloid production. Reactive astrocytes, surrounding senile plaques, were suggested to accumulate and degrade β-amyloid (see (Guenette 2003; Nicoll and Weller 2003) for details and references) . These reactive astrocytes, at least in the transgenic mice expressing mutant amyloid precursor protein (APP), were found to express the amyloid degrading enzyme neprilysin, a zinc metallopeptidase (Apelt et al. 2003) . Cultured primary astrocytes, isolated from healthy mice brains, were able to actively accumulate β-amyloid; at the same time, astrocytes obtained from transgenic mice bearing a mutant APP were not capable of taking β-amyloid up (Wyss-Coray et al. 2003) , this being another example of functional astroglial asthenia in the context of AD. Accumulation of β-amyloid was detected in astroglial cells from the entorhinal cortex of AD patients (Nagele et al. 2003) although β-amyloid was rarely found in astrocytes from the triple transgenic-AD (3xTg-AD) mice (Olabarria et al. 2010) , harboring mutated presenilin 1 M146V, APP Swedish mutation (K670N, M671L and mutated tau P301L transgenes (Oddo et al. 2003) .
Healthy astrocytes do not express the main component of β-amyloidogenic pathway, the β-site APP-cleaving enzyme 1 (BACE 1; generally known as β-secretase), which seems to be exclusively expressed by neurons. Exposure of astrocytes to chronic stress, however, was reported to induce BACE1 expression, thus, potentially enabling astrocytes with β-amyloid producing capability; this was, for example, reported for astrocytes activated following immune lesion of cholinergic septohippocampal afferents or occlusion of middle cerebral artery (Rossner et al. 2005) . Expression of BACE1 was identified in reactive astrocytes in AD mice models (Tg2576, K670N-M671LAPP or APP V717I) expressing mutated human amyloid precursor protein (Rossner et al. 2001; Hartlage-Rubsamen et al. 2003; Heneka et al. 2005) . Incidentally, increase in APP production was described in a rat model of chronic neocortical astrogliosis, induced by grafting fetal cortical tissue in the midbrain of neonatal animals; these chronically activated astrocytes were immunopositive for APP, as well as for another AD-related marker apolipoprotein E (Martins et al. 2001) . Nonetheless, the role of astroglia in β-amyloid turnover needs further confirmation and investigation.
12.3.3 Astrogliosis in AD
Reactive astrogliosis is generally considered to be a feature of the AD brains, and, indeed, Alois Alzheimer had found association of glia with damaged neurons; he also observed glial cells abundantly populating senile plaques (Alzheimer 1910) . Astrogliotic changes, mainly documented by an increase in the expression of GFAP and astroglial S100 β protein, have been observed in post-mortem tissues from AD patients (Beach and McGeer 1988; Griffin et al. 1989; Meda et al. 2001; Mrak and Griffin 2005; Rodriguez et al. 2009) . Some reports claimed a degree of correlation between the astrogliosis (defined as increase in GFAP expression) and the Braak stage of AD, although there was no correlation between astrogliotic changes and β-amyloid load (Simpson et al. 2010) . Reactive astrocytes were found to be associated with some senile plaques, but they were also identified in plaque free regions of the grey matter (Simpson et al. 2010). At the same time, no differences in GFAP expression was found between demented and non-demented brains (Wharton et al. 2009) . Reactive, hypertrophic astrocytes, associated with senile plaques and perivascular β-amyloid deposits, were also observed in the brains of AD-models mice (Rodriguez et al. 2009; Olabarria et al. 2010; Verkhratsky et al. 2010)(Figs. 12.7, and 12.8) .
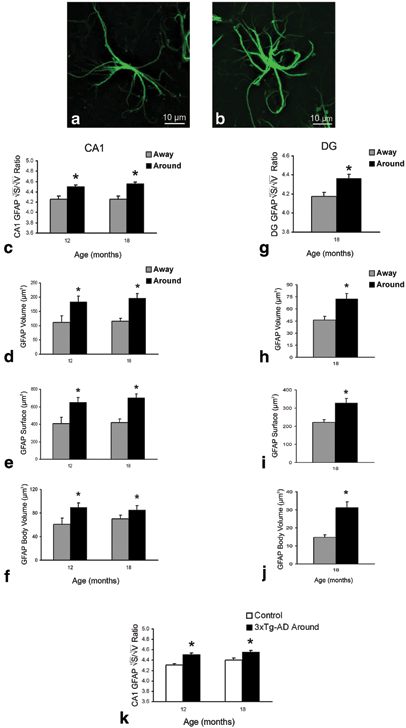
Fig. 12.7
Confocal single labelling micrographs of dual labelled immunohistochemistry illustrating the cytoskeleton alterations between astrocytes away (a) and around (b) plaques. Bar graphs showing GFAP positive astrocytic surface (c), volume (d), 2√S/3√V ratio (e) and body volume (f) differences between those astrocytes located around the amyloid plaques (Aβ) and those distant to the plaques in the CA1 of 3xTg-AD animals. 2√S/3√V ratio representation of astrocytic located around the amyloid plaques when compared to non-Tg control mice astrocytes at 12 and 18 months of age (K). Similar astrocytic surface (g), volume (h), 2√S/3√V ratio (i) and body volume (j) differences are observed in the DG at 18 months of age. Bars represent mean ± SEM.* =p < 0.05. (Modified from Olabarria et al. (2010) with permission.)

Fig. 12.8
Confocal dual labelling images (GFAP in green and Aβ in red) in 3xTg-AD mice showing the concentration of astrocytes around the Aβ accumulations (a–d). Astrocytes surround Aβ plaques (a, b) and Aβ loaded blood vessel (c), undergo astrogliosis including in some cases Aβ intracellular accumulation (a, b). Occasionally, we could observe some distant astrocytes sending reactive processes towards a plaque (d). (Reproduced from Olabarria et al. (2010) with permission.)
Changes in GFAP expression reported in the AD tissue may, however, not only reflect the disease-specific changes but also the age-dependent remodeling of astrocytes, which, as narrated above, remains incompletely characterized. Furthermore, it has to be emphasized that reactive astrogliosis in AD is of a rather mild variety; astrocytes in the grey matter preserve their domain organization and there is no indication of anisomorphic gliosis and the formation of glial scars. Reactive astrocytes in AD animal models show aberrant physiology. These astrocytes, associated with senile plaques, were reported to generate spontaneous Ca2+ oscillations and abnormal Ca2+ waves (Kuchibhotla et al. 2009) .
Molecular cues initiating astroglial reactivity in AD are multiple and may include extracellular β-amyloid as well as factors released by damaged cells. Soluble β-amyloid is reported to trigger reactive changes in astrocytes in vitro (DeWitt et al. 1998) . Exposure of cultured astrocytes to β-amyloid also modifies signaling cascades. For example, extracellular β-amyloid triggers abnormal oscillatory Ca2+ fluctuations in cultured primary astrocytes (Abramov et al. 2003, 2004) . Incubating primary astrocytes with pathologically relevant concentrations of soluble β-amyloid affects the expression of Ca2+ toolkit components; importantly, this remodeling differs for astrocytes derived from different brain regions (Grolla et al. 2013) . Similarly, exposure to β-amyloid was claimed to down-regulate glutamate uptake in astroglial cells in vitro (Matos et al. 2008) . All in all, however, the precise mechanisms of astroglial activation and remodeling of astroglial physiological signaling cascades in AD remains virtually unknown .
12.3.4 Astrodegeneration in AD: Reduction in Astroglial Profiles
Effects of AD pathology on astroglia, however, are not limited with astrogliotic response, to the contrary, astrogliosis most likely occurs in later stages of the disease, and reactive astrocytes are mainly associated with senile plaques (Olabarria et al. 2010) . Recent studies of transgenic AD mice models revealed a profound astrodegeneration that occurs at the early stages of AD progression (Olabarria et al. 2010; Yeh et al. 2011; Kulijewicz-Nawrot et al. 2012; Beauquis et al. 2013) .
In the above mentioned 3xTg-AD (Oddo et al. 2003) , reduction in GFAP-positive profiles have been found in several brain regions (Olabarria et al. 2010; Yeh et al. 2011; Kulijewicz-Nawrot et al. 2012). These atrophic changes were quantified by decreased surface area and volume of GFAP-positive profiles, decreased volume of cell somata, decreased number of primary processes and reduction in the number of primary processes (Fig. 12.9). The total number of GFAP-positive astrocytes, however, remained stable in the hippocampus, entorhinal and prefrontal cortices of AD mice at all ages from birth to senescence (1–24 month of age) (Olabarria et al. 2010; Yeh et al. 2011; Kulijewicz-Nawrot et al. 2012). Similar atrophic changes were observed in hippocampal astrocytes from another AD animal model, the mutant APP (PDAPP-J20) mice carrying the Swedish and Indiana APP human mutations (Beauquis et al. 2013) .
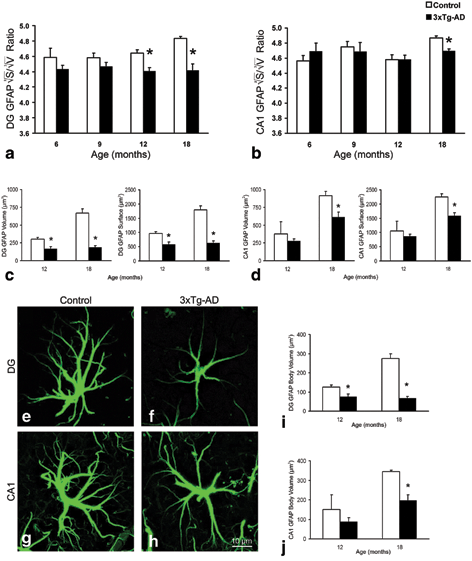
Fig. 12.9
Bar graphs showing a decreased GFAP surface, volume, 2√S/3√V ratio and body volume in both the DG (a, c, i) and the CA1 (b, d, j) of the hippocampus of the 3xTg-AD mice when compared to control animals. Bars represent mean ± SEM.* =p < 0.05. Confocal micrographs illustrating the astrocytic atrophy in 3xTg-AD mice in the DG (f) and CA1 (h) compared to control animals (e and g, respectively). (Modified from Olabarria et al. (2010) with permission.)
In the 3xTG-AD animals, reduced astroglial profiles appeared very early (at 1 months of age) in the entorhinal cortex, somewhat later in the prefronatal cortex (~ 6 months) and substantially later in the hippocampus (~ 9–12 months) (Figs. 12.10, 12.11) (Olabarria et al. 2010; Yeh et al. 2011; Kulijewicz-Nawrot et al. 2012) . This atrophy of GFAP-positive profiles preceded β-amyloid deposition and formation of senile plaques. The reduction in GFAP profiles coincided with the reduced morphological presence of astroglial cells labelled with GS antibodies in the hippocampus and in the prefrontal cortex, but not in the entorhinal cortex (Olabarria et al. 2011; Yeh et al. 2013) .
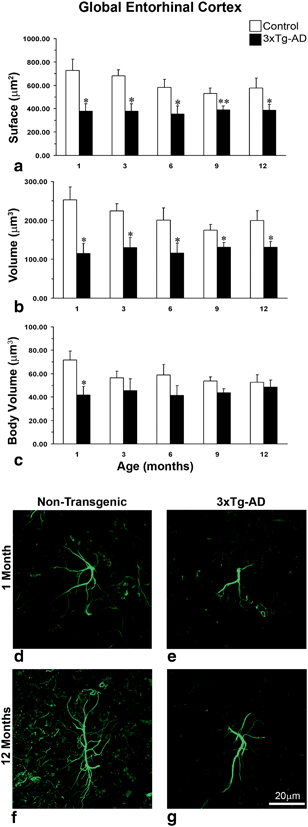
Fig. 12.10
Comparison of astrocytic GFAP surface and volume in the whole EC of non-Tg and 3xTg-AD animals across ages. Bar graphs showing comparison of GFAP (a) surface (b) volume and (c) body volume in global EC at the age of 1, 3, 6, 9 and 12 months between 3xTg-AD and non-transgenic animals. Bars represents mean ± SEM (*p ≤ 0.05 compared with age matched non-transgenic control); Confocal micrograph showing astrocytic atrophy in 3xTg-AD at 1 month (e) and 12 months (g) compared with control animals (d and f). (Reproduced from Yeh et al. (2011) with permission.)
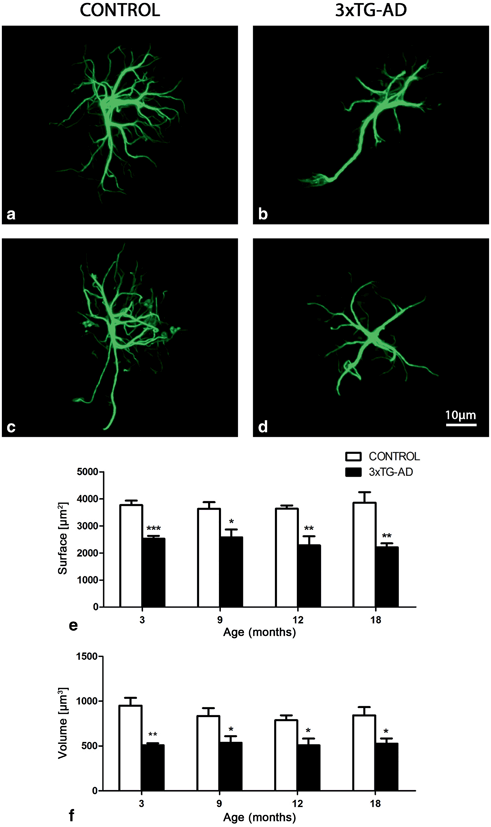
Fig. 12.11
Confocal images showing the classical morphology of GFAP-positive astrocytes in control Non-Tg animals and astrocytic atrophy in the 3xTg-AD animals at 3 months (a and b, respectively) and 18 months (c and d, respectively) in the mPFC. Bar graphs showing the decreases in the GFAP-positive surface area and volume throughout the whole extent of the mPFC (E-F) in 3xTg-AD mice when compared with control animals. Bars represent mean ± SEM. (Reproduced from Kulijewicz-Nawrot et al. (2012) with permission.)
12.3.5 Astrodegeneration in AD: Loss of Homeostatic Support Defines Early Cognitive Impairments
Reduction in astroglial profiles, as evidenced by the morphometry of GFAP- and GS-positive cells, is indicative of a decrease in astroglial territories and hence in reduced astroglial coverage of the grey matter. This atrophy of astrocytes, which occurs early in the disease progression, may represent an important pathological stage in the disease progression. Atrophic astrocytes provide less synaptic coverage with deleterious consequences for synaptic transmission associated with compromised ion and neurotransmitter homeostasis or reduced local metabolic support (Verkhratsky et al. 2010; Rodriguez and Verkhratsky 2011) . Astroglial degeneration, furthermore, affects the neuro-vascular unit and lessens neuroprotection. All these changes are likely to weaken synaptic transmission and affect synaptic plasticity, and thereby being responsible for initial cognitive deficiency observed during the early stages of AD.
These early cognitive deficits are the very first symptoms of AD, which start to develop years before the occurrence of specific histopathology (Terry 2000; Coleman et al. 2004) . Weakening of cognitive abilities reflects in reduced synaptic connectivity due to decreased synaptic function and synaptic loss. Decrease in the number of synapses represents the earliest morphological changes in AD (Terry 2000), while the degree of synaptic loss correlates with the severity of dementia (DeKosky and Scheff 1990; Samuel et al. 1994) . Early demise of synapses could be directly related to astrodegeneration and the resulting homeostatic failure. Astrocytes are critical for synaptogenesis and synaptic maintenance (Ullian et al. 2004; Eroglu and Barres 2010) , whereas astroglial plasmalemmal transporters control local concentrations of ions and neurotransmitters , most notably glutamate, which, when not contained, causes local excitotoxicity. Astroglia also supports normal neuronal excitability and synaptic function through metabolic support accomplished by lactate shuttle (Magistretti 2006) . Astrocytes are also critical for sustaining normal neurotransmission by supplying neurons with glutamine that is indispensable for glutamatergic and GABA-ergic pathways. Impairment of these critical functions associated with astrodegeneration can be a primary cause for distorted synaptic connectivity and early cognitive deficits in AD (Verkhratsky et al. 2010; Rodriguez and Verkhratsky 2011) .
12.3.6 Astrodegeneration in AD: Dysfunctional Neuro-vascular Unit
AD pathology is often (if not always) associated with vascular deficiency. Blood flow is significantly reduced in the brains of patients with AD and especially in the early stages of the disease (see (Zlokovic 2008; Bell and Zlokovic 2009) for comprehensive review) . These functional deficits reflect profound remodeling of vascularization in the diseased brains (Farkas and Luiten 2001) . Brain microcirculation is controlled by both neuronal and astroglial inputs (Zonta et al. 2003; Iadecola and Nedergaard 2007; Attwell et al. 2010) . Astrocytes are central elements of the neurovascular units that bridge neurons with local circulation. By releasing various factors, astrocytes target pericytes, vascular smooth muscle cells and endothelial cells, thus contributing to functional hyperemia and regulating blood-brain barrier (Zonta et al. 2003; Mulligan and MacVicar 2004; Takano et al. 2006) . Astroglial atrophy, together with reactive rearrangement of neuro-vascular unit, may occur at both early and late stages of the disease and contribute to cognitive abnormalities and neuronal damage.
12.3.7 Astrodegeneration in AD: Deficits in Metabolic Support
Metabolic failure represents another common feature of AD. Progressive loss of glucose utilization has been observed in functional brain imaging in patients with different stages of AD; importantly, this metabolic stress is present in the early stages of the disease thus bearing a diagnostic significance (Mosconi et al. 2008) . Experiments in vitro, in primary cultured astrocytes, demonstrated that treatment with β-amyloid affects cellular metabolism, although both decrease (Parpura-Gill et al. 1997; Soucek et al. 2003) and increase (Allaman et al. 2010) in glucose utilization were described. Similarly, both decrease (Blass et al. 2000; Liang et al. 2008) and increase (Bigl et al. 1999; Soucek et al. 2003) in the activity of glucose metabolism enzymes were reported in post-mortem AD brains.
12.3.8 Astrodegeneration in AD: Paralysis of Astrogliotic Response Defines Susceptibility of Brain Tissue to AD Pathology
Another important consequence of astroglial degeneration in AD is associated with the failure of their defensive function . In the 3xTG mice model, appearance of senile plaques as well as perivascular β-amyloid accumulation triggers astrogliotic response in hippocampal astrocytes, which become hypertrophic and upregulate GFAP expression (Olabarria et al. 2010, 2011) . These hypertrophic astrocytes are specifically associated with β-amyloid deposits, whereas astrocytes distant to the plaques are generally atrophic (so in this sense, astroglial atrophy represents the early stage of AD progression and is complimented by astrogliosis at later stages, when specific lesions develop). In entorhinal and prefrontal cortices, however, astrocytic defense response appeared to be compromised because extracellular β-amyloid accumulation does not trigger astrogliotic response (Yeh et al. 2011; Kulijewicz-Nawrot et al. 2012) . This protective failure may explain high vulnerability of entorhinal and prefrontal cortices to AD pathology .
Stay updated, free articles. Join our Telegram channel

Full access? Get Clinical Tree


