Bioenergetics overview. Glycolysis and the tricarboxylic acid cycle (TCA) together generate adenosine triphosphate (ATP, via substrate-level phosphorylation) and provide electrons to power ATP formation from the electron transport chain (ECT) via reduction of nicotinamide adenine dinucleotide (NADH) and flavin adenine dinucleotide (FADH2). Through chemiosmotic coupling, the ECT drives oxidative phosphorylation and ATP synthesis resulting in the reduction of molecular oxygen (O2) to CO2 and H2O2. The cellular “redox state” is the relative balance of the reduced versus oxidized forms of electron-transporting molecules, such as NADH and FADH2. The NADH/FADH2 redox state therefore determines the rate of ATP generation
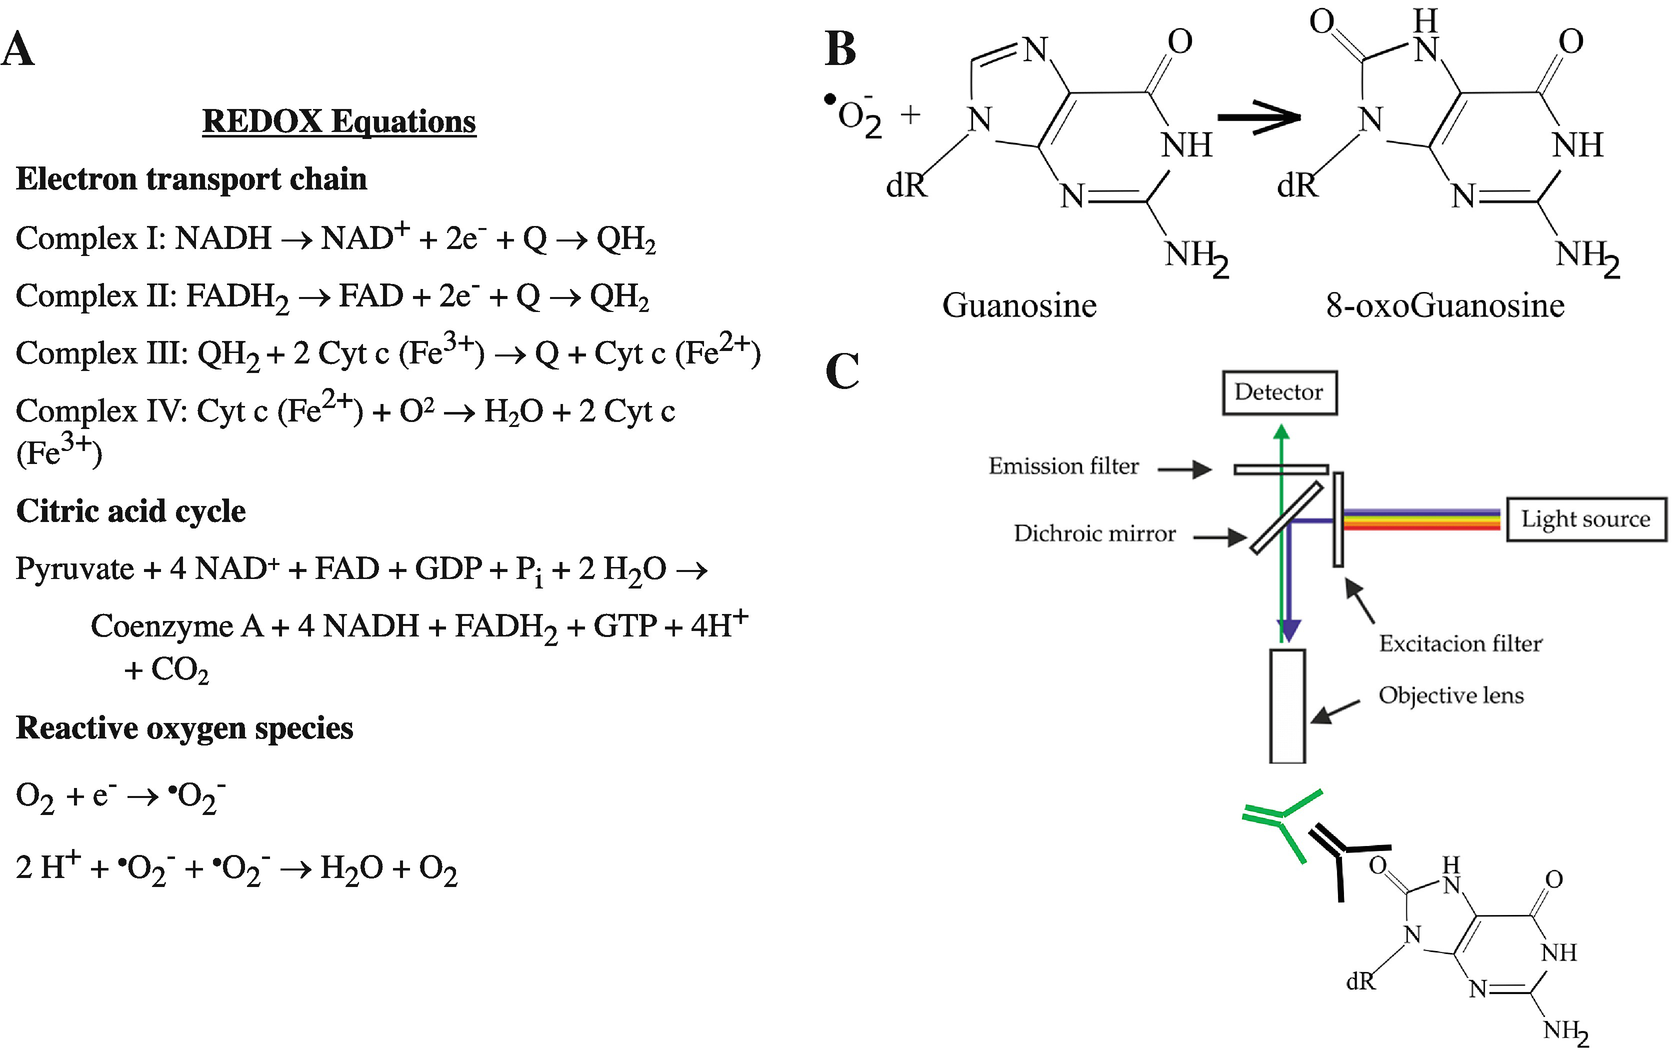
Reduction–oxidation (redox) reactions and fluorescent indicators. (a) Redox reactions characterize the transfer of an electron from a donor moiety to an acceptor moiety. Transfer of electrons powers oxidative phosphorylation which results in generation of reactive oxygen species as a byproduct of reduction of molecular oxygen. (b) 8-Hydroxydeoxyguanosine (8-OHdG) is a stable byproduct of ROS generation. (c) 8-OHdG can be visualized by fluorescent immunohistochemistry
2 Immunohistochemical Markers for Oxidative Stress and Redox-Signaling
2.1 Immunohistochemistry
The detection of proteins in fixed cells/tissues via antibodies conjugated to fluorophores or enzymes is the basic principle for immunohistochemistry (IHC). There are numerous working protocols for different type of tissues and antibodies. Generally, after fixation (with paraffin or paraformaldehyde) the tissue is sectioned using a microtome to a desired thickness optimized for microscopy (typically 15–50 μm), followed by permeabilization, quenching of endogenous peroxidase activity and blocking for nonspecific immunostaining with an antibody of interest. One or more (if not cross-reactive) primary antibodies can then be utilized to bind protein(s) of interest with high affinity, followed by washing steps. Secondary antibodies tagged with fluorophores or stains are then introduced to target primary antibodies, which can be imaged with fluorescent microscopy or bright field microscopy techniques to allow for regional and cellular localization of protein expression. Enzyme linked immunosorbent assays (ELISAs) are typically utilized for detecting proteins in a liquid sample using a similar approach with specific antibodies. In principle, premanufactured antibody coated ELISA plates bind individual proteins from a fluid sample, then an enzyme-linked secondary antibody is added for detection after processing with substrates to allow for measurements based on enzyme-converted colors or fluorescent dye. Signal intensity measurement is therefore directly proportional to presence and quantity of antigen, which allows for a degree of protein quantification.
2.2 8-Hydroxydeoxyguanosine (8-OHdG)
Reactive oxygen species (ROS) are chemical species derived from molecular oxygen with one unpaired electron. Excessive production of ROS can result in oxidation of mitochondrial DNA and nuclear DNA during ischemic conditions [2]. ROS can oxidize nucleotide bases in DNA, forming oxidized species including 7,8-dihydro-8-oxoguanine (8-oxoguanine), which can cause transversion mutations [3, 4]. Cells have rapid repair mechanisms to maintain their genomic integrity, and newly formed 8-oxoguanine in nuclei and in mitochondria is recognized by OGG1 gene-encoded 8-oxoguanine DNA glycosylase for targeted removal [5]. The relatively stable “end-product,” 8-hydroxydeoxyguanosine (8-OHdG, Fig. 2b), is transported out of the cell and renally cleared, allowing for DNA repair [6, 7]. Levels of 8-OHdG can therefore be measured via fluorescent automated cell sorting (FACS) of dissociated cells or ELISA-based analysis of blood or urine. Moreover, 8-OHdG can be used as a proxy for localized cellular production of ROS in fixed tissue via fluorescent microscopy (Fig. 2c), as 8-OHdG is considered a stable marker for oxidative stress [8].
2.3 Nuclear Factor Erythroid 2-Related Factor 2 (Nrf2)
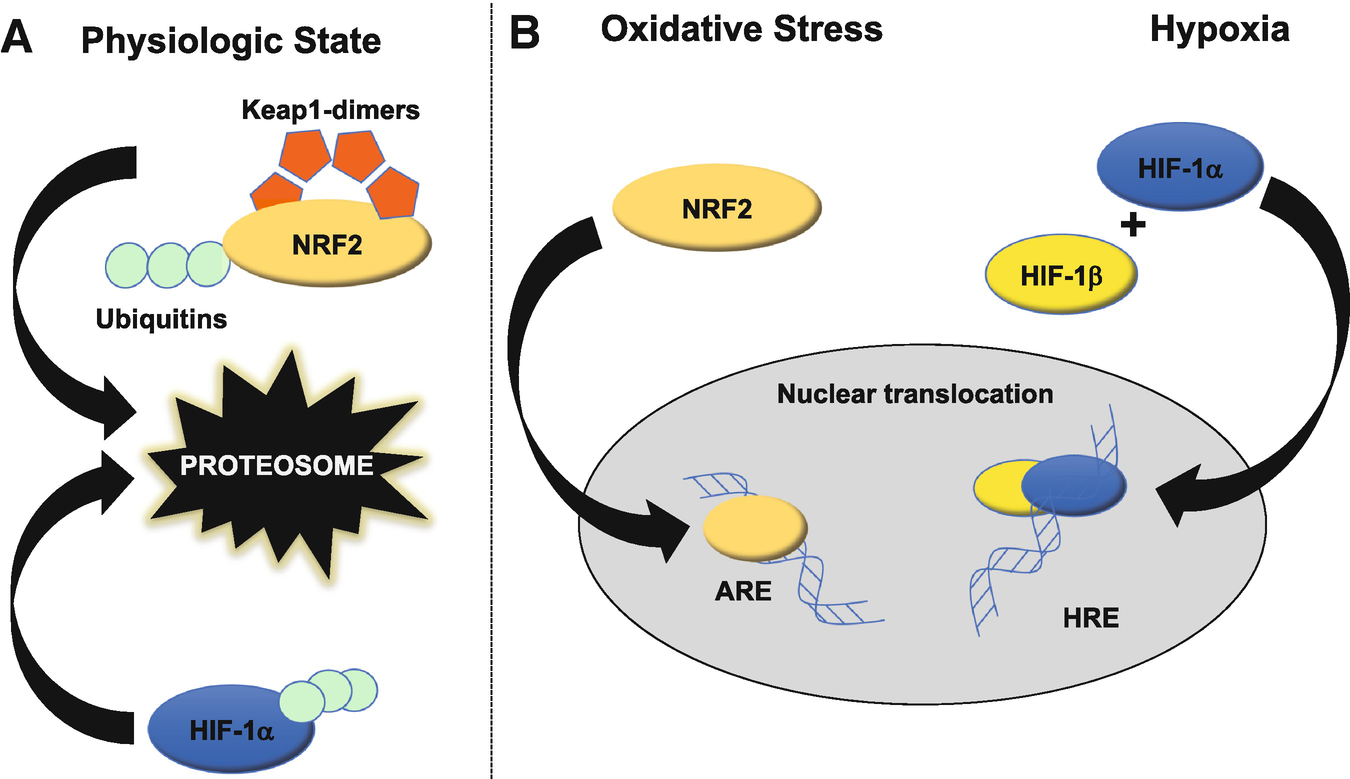
Cytoprotective nuclear factor erythroid 2-related factor 2 (Nrf2) and hypoxia-inducible factor-1 (HIF-1) subunit-α. (a) Nrf2 and HIF-1α are transcription factors poised to respond to cellular stressors such as excessive oxidant production or decreased oxygen availability, respectively. In the resting state, Nrf2 is bound to Keap1 dimers and ubiquitins, which co-direct the complex towards proteosomal degradation. In parallel, HIF-1α subunit alone is ubiquitin-bound, resulting in targeted proteosomal degradation. (b) In response to oxidative stress, Keap1 and ubiquitin do not bind Nrf2, allowing for nuclear translocation and binding to DNA antioxidant response element (ARE) to drive transcription of cytoprotective genes. Similarly, HIF-1α in the presence of hypoxia does not bind ubiquitins, instead binding cofactor HIF-1β to allow translocation to the nucleus, resulting in cytoprotective transcriptional activity
2.4 HIF-1-Alpha
A central cellular hypoxia-sensing and redox-regulating mechanism is Hypoxia-inducible factor 1 (HIF-1) [17], which is a heterodimer complex composed of two subunits, a 120 kDa α subunit and a 91–94 kDa β subunit [18]. HIF-1α is constitutively translated but subsequently destroyed by the ubiquitin-proteasome pathway (Fig. 3). In response to hypoxia, HIF-1α ubiquitination is significantly decreased, allowing cellular levels of HIF-1-α to accumulate [19]. Oxidative stress also contributes to HIF-1α stabilization under hypoxic conditions [20]. Stabilized HIF-1-α binds to other subunits and regulates multiple hypoxia-induced target genes, such as erythropoietin, glucose transporters, and vascular endothelial growth factor (VEGF) to counter both cellular and systemic hypoxia and oxidative stress [21–23]. However, hypoxia also serves as a negative feedback loop for HIF-1α as it is negatively regulated by prolyl-4-hydroxylases [24]. HIF-1α contributes to mitigating ROS-related damage in the brain, after cerebral ischemic insult, as HIF-1α deficiency has been shown to augment brain damage [25], and experimental drug therapies employing HIF-1α have been demonstrated to increase cerebral ischemic tolerance [26, 27]. HIF-1α can be visualized with IHC after ischemia–reperfusion injury [28].
2.5 DJ-1
DJ-1 is a ubiquitous ROS-countering protein [29] that is H2O2-responsive, redox-sensitive, and functions as an antioxidant [30]. DJ-1 is associated with the cell death cascade: [31] during an ischemic insult DJ-1 translocates to the inner membrane of the mitochondria and protects complex I of the electron transport chain against ROS [29]. Alterations in DJ-1 following cerebral ischemic insult can be measured by immunoblot and [32] and also visualized via IHC.
2.6 Pimonidazole
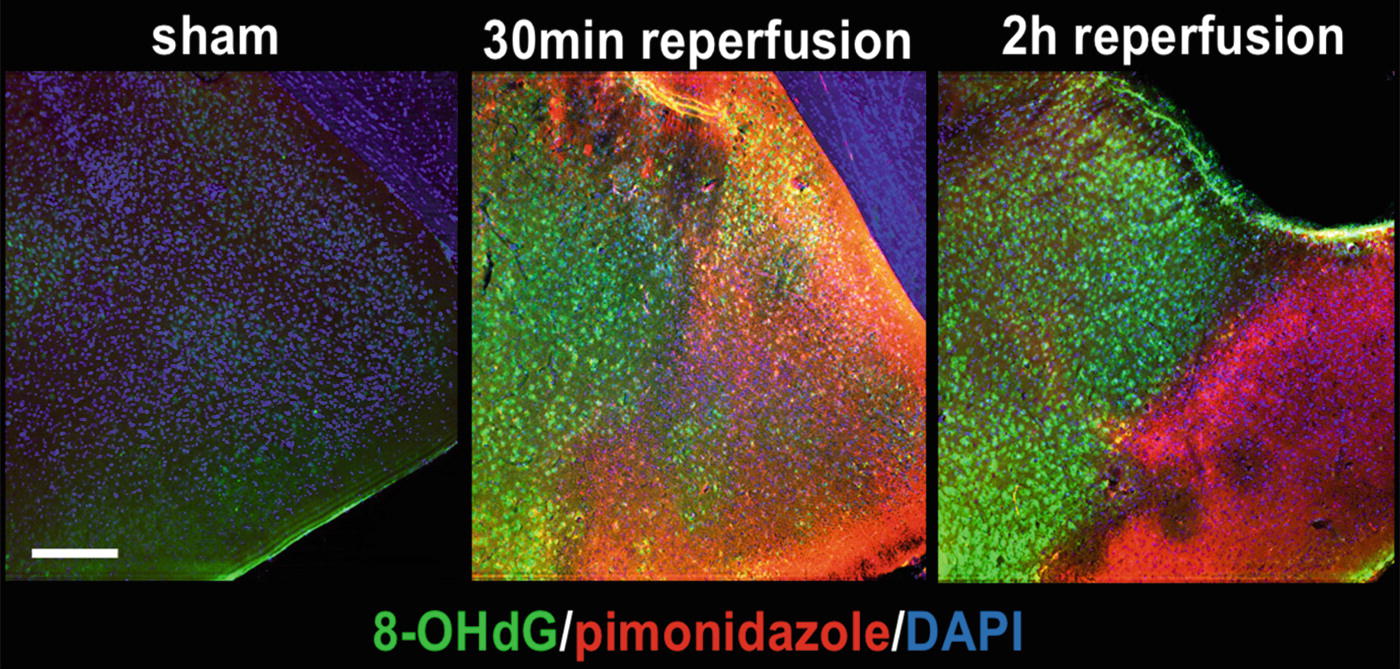
Post-MCAO reactive oxygen species (ROS) generation in ischemic core and penumbra. Following an IV injection of the hypoxia indicator pimonidazole (red) animals were subjected to sham or 1-h middle cerebral artery occlusion (MCAO) and sacrificed at 30 min or 2 hours reperfusion. Fixed brains were co-labeled with the ROS indicator 8-hydroxy-2′-deoxyguanosine (8-OHdG, green) and the nuclear dye 4′,6-diamidino-2-phenylindole (DAPI). Substantial elevation in ROS generation is sustained in penumbra at both 30 min and 2 h reperfusion. Co-labeling of pimonidazole and 8-OHdG in ischemic core is evident at 30 min but not at 2 h. Scale bar = 100 μm
2.6.1 Procedure: Pimonidazole Hydrochloride/8-OHdG Complexing
- 1.
Hypoxyprobe is resuspended at 30 mg/ml in 0.9% sterile saline.
- 2.
Mice are weighed, anesthetized, and intravenously injected with pimonidazole hydrochloride from Hypoxyprobe™ (cat# HP1-1000) at 60 mg/kg body weight, 5 min prior to MCAO.
- 3.
Pimonidazole is circulated in vivo completely for 5 min, followed by MCAO of 60 min, and a follow-up period of 30 min before the mice are euthanized according to IACUC approved protocols. Brains are then perfusion-fixed with 4% paraformaldehyde (PFA).
- 4.
Saline flushed and PFA perfusion fixed brains are removed and set for further fixing in PFA for 48 h in 4 °C.
- 5.
Brains are sectioned using a vibrotome/microtome to 50 μm thickness.
- 6.
Sections are processed for fluorescent immunohistochemistry (IHC):
- (a)
Wash and permeabilize sections in phosphate-buffered saline (PBS-t) twice for 5 min.
- (b)
Block in IHC blocking buffer for 1 h at room temperature, or overnight at 4 °C.
- (c)
Block for endogenous auto-fluorescent molecules with H2O2 for 30 min to 2 h.
- (d)
Wash with PBS-t three times 5 min each.
- (e)
Add primary antibodies 1:200, 4 °C, overnight, gentle agitation (Pimonidazole mouse-AB, 8-OHdG goat-AB).
- (f)
Wash with PBS-t three times 5 min each.
- (g)
Add secondary antibodies 1:200, and DAPI 1:5000 4 °C, overnight, gentle agitation (donkey anti-goat, donkey anti-mouse).
- (h)
Wash three times with PBS-t, mount on glass slides.
- (i)
Image on upright microscope equipped for fluorescent capture at 350 nm (blue), 488 nm (green) and 594 nm (red).
- (a)
Reagents:
- 1.
Hypoxyprobe Kit (100 mg pimonidazole–HCl plus 1.0 ml of 4.3.11.3 mouse MAb) (Hypoxyprobe™, HP1-100Kit).
- 2.
PBS (Sigma-Aldrich, catalog number: P-4417).
- 3.
Goat Anti-8-OHdG antibody (Abcam, ab10802).
- 4.
Donkey Anti-Goat IgG H&L (Alexa Fluor® 488; Abcam, ab150129).
- 5.
Donkey Anti-Mouse IgG H&L (Alexa Fluor® 594; Abcam ab150108).
- 6.
Triton X-100 (Sigma-Aldrich, T8787).
- 7.
ProLong™ Glass Antifade Mountant (Invitrogen, P36980).
- 8.
DAPI (4′,6-Diamidino-2-Phenylindole, Dihydrochloride) (Invitrogen, D1306).
- 9.
Normal goat serum (Invitrogen, 10000C).
- 10.
Slides (Thermo Fisher Scientific, catalog number: 12-550-15).
- 11.
Micro cover glasses (VWR International, catalog number: 48393-106).
Solutions:
- 1.
IHC blocking buffer (5% Normal Goat Serum in PBS) 500 μl of NGS in 10 ml PBS.
- 2.
PBS-t (0.1% Triton X-100 in PBS) 100 μl of Triton X-100 in 100 ml of PBS.
- 3.
0.9% saline: Mix 0.9 g of sodium chloride (NaCl) in 100 ml milli Q H2O.
2.7 Oxidized Phospholipids
Not all reactive oxidant species can oxidize lipids, but it is known that free radicals play a role in lipid peroxidation in ischemia–reperfusion injury [34]. Oxidized lipids are, however, not ideal for direct measurement of antioxidant levels or redox activity. Levels of many of the oxidized lipid products are affected by age and other factors and are therefore generally not regarded as suitable markers to measure redox signaling [35].
3 In Vivo Approaches for Measuring Tissue Redox State
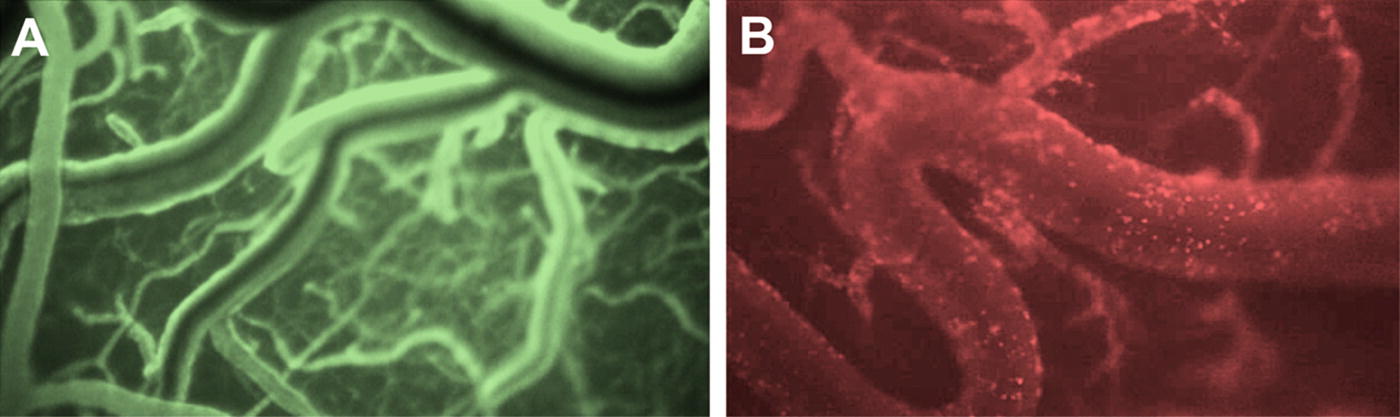
3.1 Intravital Imaging
Stay updated, free articles. Join our Telegram channel

Full access? Get Clinical Tree


