Cavernoma location
#
%
Rolandic (39 cases)
7
38
Speech (43 cases)
5
12
Insular (14 cases)
2
14
Visual (9 cases)
1
11
Surgery-related outcome is presented in Tables 2 and 3. As for superficial cavernomas (Fig. 1) (Table 2), 21 cases out of 39 (54 %) operated in the rolandic/perirolandic cortex showed post-operative neurological deficits: in 16 patients the deficit disappeared within 6 months; 5 patients (13 %) developed permanent deficits, 3 of them with a mild disability (mRS 1–2) and 2 with a significant disability (mRS > 3) (as a consequence of previous hemorrhage in one). Only transient deficits were reported in 14 patients operated on in the speech area, mostly lasting for less than 1 month (64 %). After surgery in the visual cortex, in 4 cases (55.5 %) a visual deficit was present transiently and in only one case it was permanent (quadrantopsia).
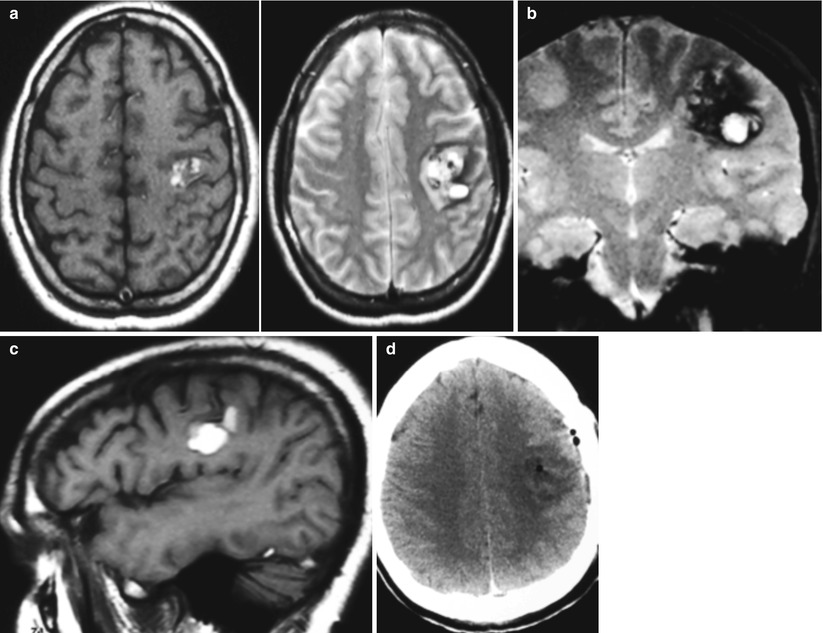
Table 2
Clinical outcome in patients with cavernomas in a superficial location
Transient deficits | Permanent deficits | ||||
|---|---|---|---|---|---|
<1 month | 1–3 months | >3 months | Mild (mRS 1–2) | Significant (mRS ≥ 3) | |
Rolandic (39 cases) | 6 (15 %) | 4 (10 %) | 6 (15 %) | 3 (8 %) | 2a (5 %) |
Speech (43 cases) | 9 (21 %) | 4 (9 %) | 1 (2 %) | – | – |
Visual (9 cases) | 1 (11 %) | 1 (11 %) | 2 (22 %) | 1 (11 %) | – |
Table 3
Clinical outcome in patients with cavernomas in a deep location
Transient deficits | Permanent deficits | ||||
|---|---|---|---|---|---|
<1 month | 1–3 months | >3 months | Mild (mRS 1–2) | Significant (mRS ≥ 3) | |
Insular (14 cases) | 1 (7 %) | 2 (21 %) | 1 (7 %) | 2 (14 %) | 2 (14 %) |
Ventricular (6 cases) | 1 (17 %) | – | – | 2 (33 %) | – |
Basal ganglia (10 cases) | – | 1 (10 %) | – | 6 (60 %) | 2 (20 %) |
Fig. 1
A 31-year-old man with hemorrhage and left subcortical rolandic cavernoma; (a–c) axial, coronal and sagittal view in T1 and T2 weighted MRI sequences; (d) post-operative CT-scan. The patient experienced a transient hemiparesis
As for deep cavernomas (Table 3), 9 of the 14 patients operated on in the insula (Fig. 2) showed post-operative deficits that were transient in 5 cases (55 %) and permanent in 4 cases, with significant disability (mRS > 3) in 2 patients (22 %). As for intraventricular cavernomas (Fig. 3), 3 cases (50 %) out of 6 patients showed post-operative deficits (2 permanent but not disabling). As for basal ganglia cavernomas, 9 patients (90 %) showed neurological deficits that were transient in 1 case (disappearing within 30 h), mild (mRS 1–2) in 6 cases and disabling (mRS > 3) in 2 cases. Statistically, surgery for superficial lesions carried a lower risk of post-operative deficits as compared to deep lesions (p = 0.02), with a highly significant difference in the incidence of permanent deficits (p < 0.0001).
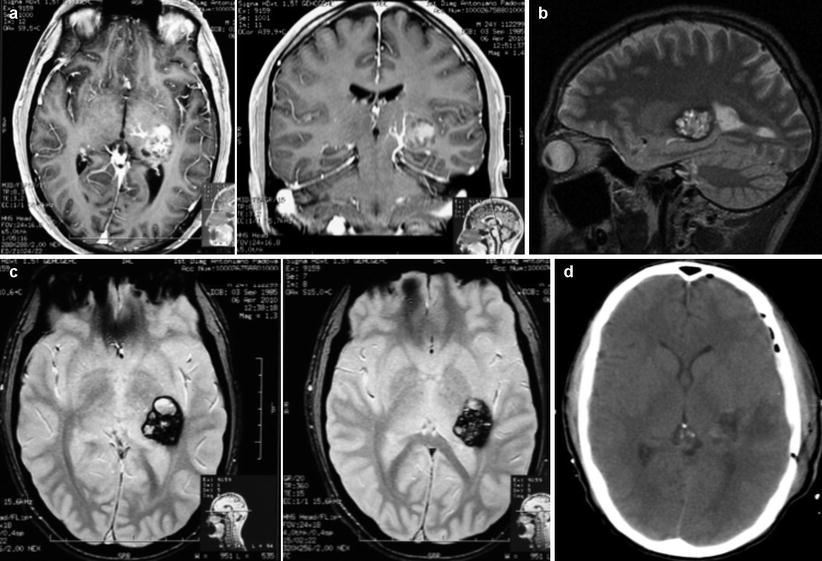
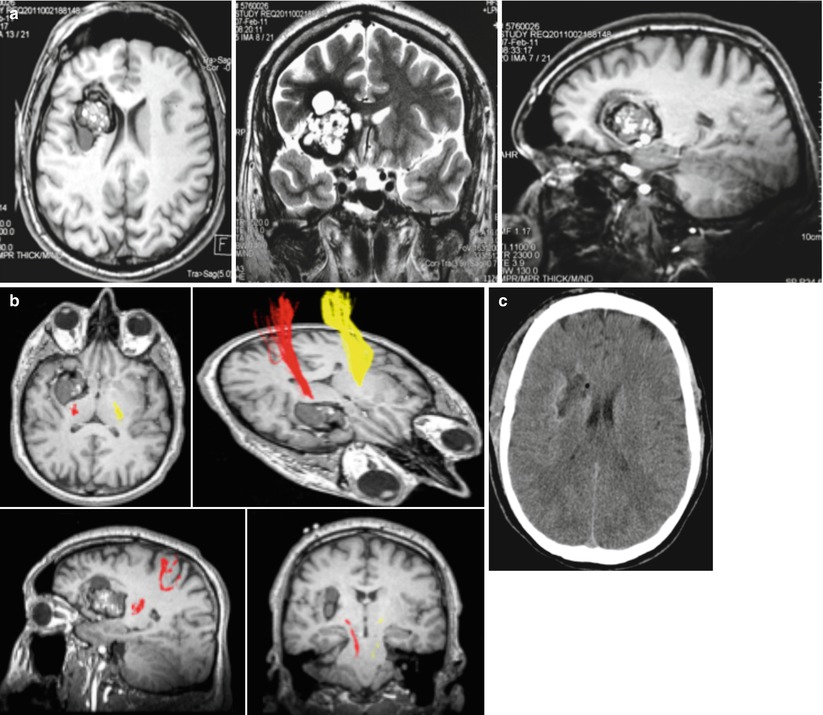
Fig. 2
A 24-year-old man with headache and left posterior insular cavernoma; (a) axial and coronal T1 weighted + Gadolinium MR images, with evidence of a venous anomaly medial to the cavernoma; (b) sagittal view in T2 weighted MR images; (c) axial view in fast spin-echo T2 MR images; (d) post-operative CT-scan. The patient experienced a transient dysphasia, with complete recovery 1 month after surgery
Fig. 3
A 35-year-old man with epilepsy and large right fronto-insulo-caudate cavernoma (with adjacent cystic component); (a) axial, coronal, sagittal view in T2 weighted MR images; (b) reconstruction of the pyramidal tract (DTI); (c) post-operative CT-scan. The patient experienced a transient left hemiparesis (<30 h) and exhibited no deficits at discharge
Epilepsy at follow-up is presented in Table 4, according to the Maraire scale [16]; as a whole, favorable results (Maraire 0) were observed in 44 % of cases, with no seizures and no therapy at follow-up. Moreover, of 15 patients with early post-operative seizures, 13 were seizure-free without therapy at follow-up.
Table 4
Epilepsy at follow-up, in 77 patients presenting with epilepsy
Location | Maraire grade | |||
|---|---|---|---|---|
0 | 1 | 2 | 3 | |
Rolandic (34 cases) | 10 (29 %) | 23 (68 %) | 1 (3 %) | – |
Speech (28 cases) | 16 (57 %) | 12 (43 %) | – | – |
Visual (3 cases) | 1 (33 %) | 2 (67 %) | – | – |
Insular (7 cases) | 4 (57 %) | 3 (43 %) | – | – |
Basal ganglia (5 cases) | 3 (60 %) | 2 (40 %) | –
Related posts: of Combined Coiling and Neuroendoscopy in the Treatment of Intraventricular Hemorrhage Due to Ruptured Aneurysm of Combined Coiling and Neuroendoscopy in the Treatment of Intraventricular Hemorrhage Due to Ruptured Aneurysm
 Endarterectomy for Pseudo-occlusion of the Cervical Internal Carotid Artery Endarterectomy for Pseudo-occlusion of the Cervical Internal Carotid Artery
 Mini Supra-orbital Approach for Cerebral Aneurysm of the Anterior Portion of the Circle of Willis Mini Supra-orbital Approach for Cerebral Aneurysm of the Anterior Portion of the Circle of Willis
 Bypass Technique for Contemporary Revascularization of Unilateral MCA and Bilateral Frontal Territories in Moyamoya Vasculopathy Bypass Technique for Contemporary Revascularization of Unilateral MCA and Bilateral Frontal Territories in Moyamoya Vasculopathy
 Bypass Using Short Interposition Vein Graft Bypass Using Short Interposition Vein Graft
 of Plaque Location Using Indocyanine Green Videoangiography During Carotid Endarterectomy of Plaque Location Using Indocyanine Green Videoangiography During Carotid Endarterectomy
Stay updated, free articles. Join our Telegram channel
Full access? Get Clinical Tree
 Get Clinical Tree app for offline access

| |