The ionic currents are as follows:
The current between neurons is:


3 Results
3.1 Bistability
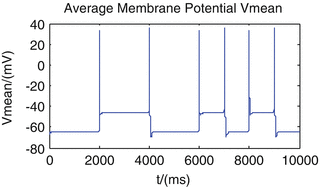
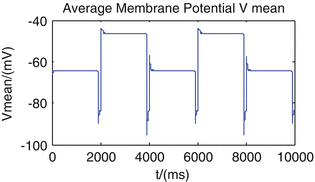
When we study on the single neuron model, we found that transitions between up and down states can be induced by two different kinds of stimulus. One is to add brief outward current pulses, another is to improve the sodium conductance to a certain value instantaneously. Now, we research on the neural network in the same way to try to find out is there exist the similar phenomenon agrees with electrophysiology experiment results. Results are showed in Figs. 1 and 2.


Fig. 1
In the period of 10 s, we add a pulse current which lasts 0.1 s every 2 s, with the current intensity 7.2 μA/cm2. Average membrane potential switches between the up and down states

Fig. 2
In the period of 10 s, we add a stimulation which lasts 4 ms every 2 or 1 s, leading to the intensity of sodium conductance changing from 0.06 to 1.2 mS/cm2 instantaneously. Average membrane potential switches between the up and down states
So from the above two results, we find that the average membrane potential switches between the up state (about −45 mV) and the down state (about −65 mV). So, this dynamic model can describe the bistability of up and down transitions of neural networks. And the transitions can be modulated by external stimulations and intrinsic nature of conductance of sodium.
3.2 Directivity
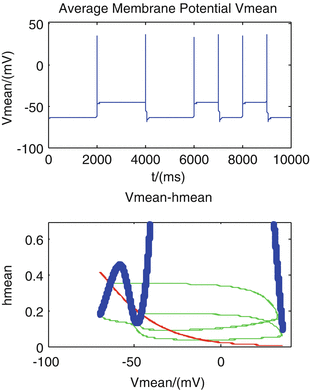
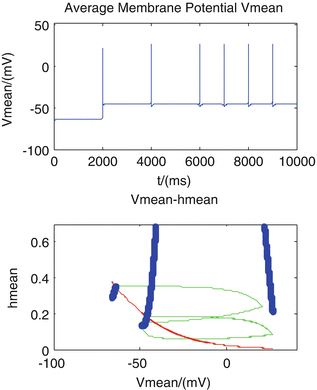
We find that the changing of sodium conductance can modulate the directivity of the transitions. Figures 3, 4 and 5 describe different transition mode adjusted by different values of sodium conductance. The tops of the figures are average membrane potential V of the neural network, while the bottoms are phase plane for the mean of two kinds of dynamic variables h and V, denoted by V mean , h mean . The red solid line shows all the points that  , the blue dot line shows all the points that
  , and the intersection of these two lines are stable point of the system. The green solid line in the figure presents the transit process from one stable point to another.


 , the blue dot line shows all the points that
  , and the intersection of these two lines are stable point of the system. The green solid line in the figure presents the transit process from one stable point to another.
Fig. 3
Average membrane potential can transit from down to up state or from up to down state by adding a stimulation that increase sodium conductance to g Na = 1.2 mS/cm 2 instantaneously. The h-V phase plane further shows that the system transmits between the two stable states

Fig. 4


If the level of sodium conductance is insufficiently activated to g Na = 0.8mS/cm 2, the average membrane potential can only transit from the down to up state. The h-V phase plane also shows the same results
Stay updated, free articles. Join our Telegram channel

Full access? Get Clinical Tree


