Positron Emission Tomography
Thomas R. Henry
Harry T. Chugani
Introduction
Positron emission tomography (PET) generates physiologic images that are complementary to brain structural magnetic resonance images (MRI) in numerous epilepsy research applications and also in a major clinical application (planning epilepsy surgery). Epilepsy research with PET has used various radiopharmaceutical tracers to measure cerebral blood flow, glucose metabolism, neurotransmitter synthesis, receptor density, kinetics of antiepileptic drugs, and effects of antiepileptic drugs and therapeutic neural electrostimulation (Table 1). Cerebral glucose metabolic mapping, using PET and 2-deoxy-2-[18F]fluoro-D-glucose ([18F]FDG), has been extensively studied in the epilepsies. Regions of interictal glucose hypometabolism are highly associated with cerebral sites of seizure generation–propagation in partial epilepsies and in West syndrome. Localization of interictal hypometabolism in planning epilepsy surgery is widely accepted as a clinical application of PET. This chapter reviews essential principles of PET (Table 2) methodology and emphasizes epilepsy research and presurgical epilepsy evaluations using clinical PET.
Methodology
Interictal [18F]FDG PET is readily available in clinical PET centers, whereas research centers typically provide [18F]FDG and multiple other radiopharmaceutical agents. Clinical PET centers are financially supported mainly by whole-body [18F]FDG PET, which is used to screen for metastases of solid tumors. The relatively long half-life of 18F (about 2 hours), the common use of highly standardized protocols for synthesizing [18F]FDG, and the availability of high-resolution tomographic cameras all serve to make [18F]FDG imaging practical and affordable in an advanced oncology center. Epileptologists can easily arrange for brain [18F]FDG imaging in a clinical PET center, which provides the multidisciplinary expertise required for safe and accurate PET imaging. Clinical epileptologists need to understand essentials of PET methodology and [18F]FDG physiology to apply [18F]FDG images in presurgical epilepsy evaluations. Following intravenous injection of radiolabeled [18F]FDG, patients are observed for 30 to 45 minutes, and then scanning is performed. During the observation period after [18F]FDG injection, the labeled [18F]FDG circulates through cerebral arterioles and capillaries, with diffusion into brain tissue; [18F]FDG is taken up by neurons and other cells and is phosphorylated, as is glucose; unlike glucose, [18F]FDG does not enter the rest of the Krebs cycle and remains in place as 18F decays and emits positrons.146 The tomograph detects oppositely directed high-energy photons produced in positron decay. Image data usually are reconstructed into a set of axial [18F]FDG activity images, which are viewed and interpreted by a nuclear medicine physician.
Research studies with PET also use the sophisticated physics (for generation of positron-emitting radionuclides), neurochemistry (for radiopharmaceutical preparation), and computing (for image reconstruction and analysis) widely available in nuclear medicine facilities. Clinical cyclotrons can produce positron-emitting isotopes of fluorine (18F, half-life of 110 minutes), carbon (11C, half-life of 20 minutes), nitrogen (13N, half-life of 10 minutes), and oxygen (15O, half-life of 2 minutes). Radiochemists have perfected reaction sequences rapidly to incorporate these radionuclides into a wide variety of labeled organic molecules, which can be administered intravenously in high purity to image many neurochemical sites and brain processes of interest to epileptologists. The accuracy of PET measurement and anatomic display is determined by the biochemical and physical properties of the selected radiopharmaceutical tracer (Table 1) and its mathematical model, performance characteristics of the tomographic instrument, scanning procedure, and other factors. Several reviews have covered general and epilepsy-related aspects of PET methodology in detail.49,50,71,219,220
Table 1 Positron-emitting radiopharmaceuticals used in Positron emission tomography studies of epilepsy | ||||||||||||||||||||||||||||||
|---|---|---|---|---|---|---|---|---|---|---|---|---|---|---|---|---|---|---|---|---|---|---|---|---|---|---|---|---|---|---|
| ||||||||||||||||||||||||||||||
Table 2 Indications for FDG PET in presurgical evaluation of epilepsy | ||||||||||||||||||||
|---|---|---|---|---|---|---|---|---|---|---|---|---|---|---|---|---|---|---|---|---|
| ||||||||||||||||||||
The performance of each PET tracer and PET scanning system must be considered in four dimensions of physiologic imaging: (a) process, (b) temporal, (c) contrast, and (d) spatial resolutions. Process resolution is the accuracy of a tracer kinetic method in measuring the intended biochemical process. Temporal resolution is the duration of brain function represented in any PET data set. Contrast resolution (“signal-to-noise ratio”) is determined by the ability of a PET system accurately to measure the activity of positron-emitting tracer within the object scanned. Spatial resolution is determined by the ability of an imaging system to detect subdivisions of the object scanned to support image reconstruction that renders the subdivisions in accurate position and shape. Each dimension of a volume of tissue must be at least twice the linear resolution of the imaging system if the volume is to be accurately resolved in space and functional intensity on the image.126 Structures smaller than this will have their functional activity averaged with those of adjacent structures (the partial volume effect). The higher spatial resolution of current PET tomographs compared with those reported in earlier [18F]FDG imaging research has been shown to generate more sensitive and accurate detection of hypometabolism, with greater ability to correlate [18F]FDG image coordinates with brain MRI locations.72 Epileptologists who use MRI in research are accustomed to spatial resolution and signal-to-noise ratio in determining which reported findings are supported by the imaging techniques. Results of PET-based epilepsy research must be critically analyzed with respect to all four dimensions of resolution in physiologic imaging.
Evaluation of [18F]FDG images is complex with respect to temporal resolution, but otherwise it is fairly straightforward. The [18F]FDG kinetics generates a nonlinear temporal resolution, in that glucose metabolism is averaged over about
40 minutes, with earlier periods during scanning weighted more heavily in this average. The tracer kinetic model of [18F]FDG requires steady-state conditions for absolute measurements of glucose metabolic rate, and so only relative comparison of metabolism within different regions of the image set can be made if a single seizure occurs during [18F]FDG imaging.146 Ictal [18F]FDG PET studies cannot be quantified because glucose metabolism is not at steady-state.146 Dynamic [15O]H2O PET imaging of cerebral blood flow (CBF) is in theory superior for ictal scanning of single seizures to either
[18F]FDG PET or single photon emission computed tomography (SPECT) techniques due to its superior temporal resolution and the possibility of fully quantifying CBF (without requirement of correction for nonlinear activity–CBF relationships, as occur with SPECT agents). In practice, the short half-life of 15O and the usually unpredictable timing of seizure onsets render ictal [15O]H2O PET impossible except for the study of reflex seizures. Relative increases and decreases in ictal regional metabolism have been observed with [18F]FDG PET.127 Ictal [18F]FDG studies are most useful when the duration of continuous seizure activity approximates the duration of [18F]FDG uptake and phosphorylation following bolus [18F]FDG injection, that is, when seizures last 10 minutes or longer. Epilepsia partialis continua is required for “purely” ictal [18F]FDG scanning.59 Occurrence of a brief complex partial seizure shortly after [18F]FDG injection may actually be associated with false normalization of apparent [18F]FDG activity, presumably due to averaging of interictal hypometabolism and ictal hypermetabolism in the same region.71
Many centers perform continuous scalp electroencephalographic (EEG) monitoring immediately prior to and following [18F]FDG administration, including for outpatient PET. Continuous EEG is useful in determining wake–sleep state, frequency of interictal epileptiform discharges, and occurrence of electrographic seizures. Scalp electrodes do not significantly attenuate or scatter the high-energy (511 keV) photons that are produced by positron annihilation. Some centers do not routinely perform EEG monitoring because this slightly increases the cost of [18F]FDG scanning and because some believe that subclinical or unreported seizures rarely occur in the imaging suite and that single seizures do not alter [18F]FDG images.6 The latter point has been disproved (see, e.g., the case presented by Henry et al.71). Nonetheless, the cost–benefit ratio of continuous EEG during clinical [18F]FDG studies has not been established. Continuous EEG monitoring is standard in PET research protocols, not only for [18F]FDG, but also for other radiopharmaceuticals; focal seizures cause marked focal increases on cerebral blood flow and therefore cause marked increases in delivery of any PET ligand to areas of maximal seizure involvement, resulting in altered physiologic images.
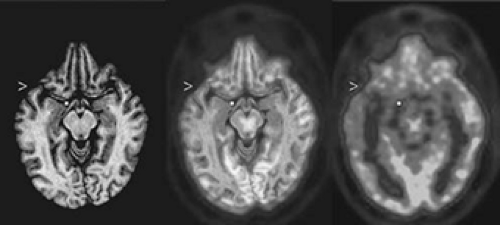 FIGURE 1. Coregistered axial image plane of magnetic resonance imaging (MRI) and interictal 2-deoxy-2-[18F]fluoro-D-glucose ([18F]FDG) positron emission tomography (PET) images of a limbic temporal lobe epilepsy (TLE) patient. The gray-scale MR image (left) and the color PET image (right) are coregistered in the center image. The MRI and PET data were reoriented parallel to a line through the anterior and posterior commissures. A widespread area of reduced [18F]FDG activity is evident on the left side of the PET image; inspection of the PET image alone does not clarify whether the reduction extends from mesial structures (at the dot internal to the brain FDG image) of the temporal lobe into the basal frontal lobe, nor whether the lateral temporal hypometabolism (at the arrowhead) extends above the sylvian fissure. The dot and arrowhead appear at the same coordinates in the MRI and the coregistered MRI–PET images as in the PET image, clarifying that all sites with severe hypometabolism are confined to the temporal lobe. (See the color insert.) |
Structural imaging data should guide anatomic analysis of PET images. An individual’s MRI and PET images can be coregistered and then viewed side by side or with superimposition of the functional and structural images (Fig. 1). Accurate PET–MRI coregistration permits comparison of anatomically specific metabolic measurements of the individual with normal subjects’ means and variances of regional metabolism.34 Statistical parametric imaging detects some abnormalities that cannot be appreciated with qualitative interpretation. For example, unilateral temporal lobe epilepsy often causes bilateral temporal hypometabolism with marked asymmetry of temporal metabolism (with lower [18F]FDG activity on the epileptogenic side). Bilateral but asymmetric temporal lobe hypometabolism can be detected readily with statistical parametric imaging techniques, but it usually appears only as unilateral temporal hypometabolism on visual interpretation. Quantitative analyses that determine an asymmetry index also will fail to detect bilateral temporal hypometabolism, although the temporal lobe with relatively greater metabolic decrease will be accurately noted as the more hypometabolic. Issues regarding the construction of regions of interest for regional sampling of [18F]FDG activity have been previously discussed.71 Despite the advantages of statistical parametric imaging techniques, visual interpretation and quantification of asymmetry remain useful in current clinical applications because unilateral TLE often has asymmetric, bilateral temporal hypometabolism interictally.
Research Findings in the Epilepsies
Mesial Temporal Lobe Epilepsy: Glucose Metabolism and Cerebral Blood Flow Studies
Interictal [18F]FDG PET usually demonstrates hypometabolism of one temporal lobe (Figs. 2,3,4) or bilateral temporal hypometabolism with more severe hypometabolism of one temporal lobe (Fig. 5) in adults and children with refractory mesial temporal lobe epilepsy (TLE).1,3,10,11,39,40,41,42,60,61,67,71,72,74,75,98,106,108,118,137,151,164,165,167,168,186,187,189,197,204,208,210,212,215 Qualitative visual analysis of [18F]FDG scans obtained with high-performance tomographs detects unilateral (or bilateral, but asymmetric) temporal lobe hypometabolism in >70% of refractory TLE patients. Higher-resolution tomographic systems support a higher detection rate for hypometabolism, and greater concordance among readers, in qualitative interpretation of [18F]FDG imaging in localization-related epilepsies.72 With quantitative analysis, detection of significant temporal lobe hypometabolism may exceed 90% in this group.92,98,216
Temporal lobe hypometabolism usually extends over mesial and lateral portions of an interictally dysfunctional temporal lobe on [18F]FDG scans in mesial TLE.72,74,167,215 Regional hypometabolism in mesial TLE typically is diffuse, with graded demarcations from adjacent areas of normal metabolism and a relatively large area of hypometabolism. Even in the presence of a temporal lobe foreign-tissue lesion, patients with refractory mesial temporal seizures usually have widespread temporal lobe hypometabolism rather than focal hypometabolism restricted to the site of the lesion. When using older tomographs with lower spatial resolution, the lateral temporal hypometabolism often appeared more severe than the mesial temporal hypometabolism of an affected temporal lobe on qualitative scan interpretation and even with quantification.72,167 Using an ultra-high-resolution tomograph, however, one study of mesial TLE found that small volumes of anterior mesial
temporal structures were more severely hypometabolic than were any other temporal or extratemporal areas in many mesial TLE patients.215 As shown in FIGURE 3, current tomographs more often provide [18F]FDG scans that show mesial temporal greater than lateral temporal hypometabolism of the affected temporal lobe. This suggests that partial-volume averaging of severe hypometabolism in the epileptogenic amygdala-hippocampus together with less depressed metabolism of adjacent basal temporal areas may cause the mesial temporal areas to appear less severely hypometabolic than they actually are when older clinical PET systems are used. In contrast to lateralized temporal lobe predominance of metabolic dysfunction most often observed in refractory TLE, some TLE patients have symmetric hypometabolism of both temporal lobes (Fig. 6).10,93 Normal interictal metabolism also occurs in refractory mesial TLE, but normal [18F]FDG scans are more common in nonrefractory than in refractory mesial TLE.55,124
temporal structures were more severely hypometabolic than were any other temporal or extratemporal areas in many mesial TLE patients.215 As shown in FIGURE 3, current tomographs more often provide [18F]FDG scans that show mesial temporal greater than lateral temporal hypometabolism of the affected temporal lobe. This suggests that partial-volume averaging of severe hypometabolism in the epileptogenic amygdala-hippocampus together with less depressed metabolism of adjacent basal temporal areas may cause the mesial temporal areas to appear less severely hypometabolic than they actually are when older clinical PET systems are used. In contrast to lateralized temporal lobe predominance of metabolic dysfunction most often observed in refractory TLE, some TLE patients have symmetric hypometabolism of both temporal lobes (Fig. 6).10,93 Normal interictal metabolism also occurs in refractory mesial TLE, but normal [18F]FDG scans are more common in nonrefractory than in refractory mesial TLE.55,124
 FIGURE 3. Interictal 2-deoxy-2-[18F]fluoro-D-glucose ([18F]FDG) positron emission tomography (PET) images of a limbic temporal lobe epilepsy (TLE) patient. These coronally oriented images were reconstructed from the same [18F]FDG data as shown in FIGURE 2. It is evident that mesial is greater than lateral temporal hypometabolism (at arrow and on adjacent planes). On each row, the coronal images are arranged with the most anterior plane to the left and 4 mm spacing. Subject left is displayed on image right. |
Many TLE patients have unilateral frontal, parietal, thalamic, or basal ganglial hypometabolism ipsilateral to temporal hypometabolism, but occipital hypometabolism is rare in mesial TLE.3,11,72,74,161,168,186 The temporal hypometabolism is nearly always more severe than is any extratemporal hypometabolism. The thalamus ipsilateral to the affected temporal lobe is the extratemporal site most likely to demonstrate hypometabolism in limbic TLE.72,74 Thalamic asymmetries in [18F]FDG activity are mainly dorsal (Fig. 4), and in some cases are associated with dorsal thalamic hypovolemia on structural MRI. The ipsilateral putamen is significantly more likely to be interictally hypometabolic in patients whose complex partial seizures involve dystonic posturing than in patients without ictal hemidystonia.161 The cortical hypometabolic area typically is contiguous across its entire temporal and extratemporal extent (Fig. 4). In particular, the insular and inferior frontal regions are most often the portions of the ipsilateral frontal lobe that are hypometabolic in association with temporal lobe hypometabolism.3,11,72,137 Bilateral cerebellar hypometabolism is common.203 Thus, interictal [18F]FDG PET in refractory mesial TLE usually reveals unilateral diffuse regional hypometabolism of one mesial-lateral temporal area, with or without ipsilateral extratemporal cortical hypometabolism or contralateral temporal hypometabolism; ipsilateral extratemporal hypometabolism almost always appears to be less severe than does the temporal lobe hypometabolism.
The pathophysiologic basis of regional hypometabolism imaged with [18F]FDG interictally in TLE is unclear. Ablative structural lesions must contribute to localized decreases in glucose metabolism. Nonetheless, it has been recognized for some time that the volume of hypometabolism is greater than the volume of associated structural lesions in localization-related epilepsies.39 Acute-subacute cerebral infarction is associated with hypometabolism at the site of neuronal loss, and additional extra-infarctional sites of hypometabolism are considered to represent “diaschisis” as passive and usually impersistent effects of a focal insult on remote brain regions that receive projections from the insulted area. Neuronal loss and diaschisis were considered the causes of the anatomically
distributed interictal hypometabolism in TLE patients with hippocampal sclerosis. This hypothesis was refuted, however, by a study of quantified preoperative [18F]FDG PET in patients whose resected temporal tissue underwent quantitative neuronal volumetric densitometry.67 Subsequent studies, using different methodologies, confirmed this observation.15,33,47,112 Similarly, several studies of MRI volumetry and interictal [18F]FDG PET found that hippocampal atrophy and temporal lobe hypometabolism are not highly correlated in mesial TLE.53,99,139,205 Furthermore, MR spectroscopic determination of the neuron-specific peaks of N-acetylaspartate (NAA) also found limited association of mesial temporal glucose hypometabolism and NAA decreases.2,97 Although neuronal loss and diaschisis probably cause some of the disseminated glucose metabolic depression in mesial TLE, other factors must also influence regional metabolism interictally. Indeed, surgical ablation of epileptogenic temporal lobe tissue might be expected to increase diaschisis effects on extratemporal glucose metabolism. Instead, comparisons of preoperative and postoperative [18F]FDG scans have shown postoperative increases in [18F]FDG activity of the contralateral temporal lobe and of ipsilateral thalamus and frontal sites.37,61,183 Several pathophysiologic processes other than diaschisis have been proposed, including reduced transmembrane glucose transport rates and reduced mitochondrial glucose oxidation of viable neurons in sites of ictal onset and habitual propagation.155,217 On comparing the anatomic distributions of ictal hyperperfusion (using SPECT) and interictal glucose hypometabolism (using [18F]FDG PET) within individual TLE patients, it is evident that many TLE patients have an identical or highly similar distribution of ictal hyperperfusion–interictal hypometabolism that predominates in the temporal lobe and thalamus ipsilateral to the epileptogenic site (including but extending beyond the electrographic ictal onset zone), often with less severe involvement of ipsilateral frontoparietal and basal ganglial sites and of contralateral temporal cortex76; one exception is the occipital hyperperfusion often observed in the absence of occipital hypometabolism in TLE. Possibly long-duration postictal dysfunctions may underlie some of the reduction in [18F]FDG activity, as suggested by differential associations of specific distributions of extrahippocampal hypometabolism with specific patterns of electrographic seizure propagation in groups with unilateral hippocampal sclerosis, for example, patients with bitemporal hypometabolism having earlier spread of ictal discharges from one hippocampus to the other.16,171 Altered energy use in neurotransmitter metabolism might mediate such spatial relationships between ictal dysfunctions and postictal dysfunctions, as suggested by a study using MR spectroscopic determination of the glutamate-glutamine peaks in which localized interictal decreases and ictal increases of [18F]FDG activity and glutamate-glutamine peaks were coupled.144 Dual pathology undetectable with MRI—specifically, microscopic cortical dysplasia accompanying some but not all cases of hippocampal sclerosis—might generate some of the heterogeneity of [18F]FDG topography in TLE.32 The diagnostically robust patterns of interictal glucose hypometabolism in TLE are not fully explained by macrostructural, microstructural, and biochemical alterations.
distributed interictal hypometabolism in TLE patients with hippocampal sclerosis. This hypothesis was refuted, however, by a study of quantified preoperative [18F]FDG PET in patients whose resected temporal tissue underwent quantitative neuronal volumetric densitometry.67 Subsequent studies, using different methodologies, confirmed this observation.15,33,47,112 Similarly, several studies of MRI volumetry and interictal [18F]FDG PET found that hippocampal atrophy and temporal lobe hypometabolism are not highly correlated in mesial TLE.53,99,139,205 Furthermore, MR spectroscopic determination of the neuron-specific peaks of N-acetylaspartate (NAA) also found limited association of mesial temporal glucose hypometabolism and NAA decreases.2,97 Although neuronal loss and diaschisis probably cause some of the disseminated glucose metabolic depression in mesial TLE, other factors must also influence regional metabolism interictally. Indeed, surgical ablation of epileptogenic temporal lobe tissue might be expected to increase diaschisis effects on extratemporal glucose metabolism. Instead, comparisons of preoperative and postoperative [18F]FDG scans have shown postoperative increases in [18F]FDG activity of the contralateral temporal lobe and of ipsilateral thalamus and frontal sites.37,61,183 Several pathophysiologic processes other than diaschisis have been proposed, including reduced transmembrane glucose transport rates and reduced mitochondrial glucose oxidation of viable neurons in sites of ictal onset and habitual propagation.155,217 On comparing the anatomic distributions of ictal hyperperfusion (using SPECT) and interictal glucose hypometabolism (using [18F]FDG PET) within individual TLE patients, it is evident that many TLE patients have an identical or highly similar distribution of ictal hyperperfusion–interictal hypometabolism that predominates in the temporal lobe and thalamus ipsilateral to the epileptogenic site (including but extending beyond the electrographic ictal onset zone), often with less severe involvement of ipsilateral frontoparietal and basal ganglial sites and of contralateral temporal cortex76; one exception is the occipital hyperperfusion often observed in the absence of occipital hypometabolism in TLE. Possibly long-duration postictal dysfunctions may underlie some of the reduction in [18F]FDG activity, as suggested by differential associations of specific distributions of extrahippocampal hypometabolism with specific patterns of electrographic seizure propagation in groups with unilateral hippocampal sclerosis, for example, patients with bitemporal hypometabolism having earlier spread of ictal discharges from one hippocampus to the other.16,171 Altered energy use in neurotransmitter metabolism might mediate such spatial relationships between ictal dysfunctions and postictal dysfunctions, as suggested by a study using MR spectroscopic determination of the glutamate-glutamine peaks in which localized interictal decreases and ictal increases of [18F]FDG activity and glutamate-glutamine peaks were coupled.144 Dual pathology undetectable with MRI—specifically, microscopic cortical dysplasia accompanying some but not all cases of hippocampal sclerosis—might generate some of the heterogeneity of [18F]FDG topography in TLE.32 The diagnostically robust patterns of interictal glucose hypometabolism in TLE are not fully explained by macrostructural, microstructural, and biochemical alterations.
Peri-ictal [18F]FDG PET studies have shown a complex time course of changes in regional cerebral metabolic rate of glucose utilization (CMRGlc) following seizures. In a group of patients with complex partial seizures who had PET at different intervals following the most recent seizure, quantified regional metabolic changes evolved for >48 hours after a single complex partial seizure.116 The most severe regional hypometabolism occurred >48 hours after the seizure, the least severe hypometabolism occurred at 24 to 48 hours postictally, and metabolism was intermediate in the first 24 hours postictally. In a study in which [18F]FDG studies were performed on average <60 hours after the most recent seizure, the type of seizures that preceded the scan had a strong influence on the regional distribution of hypometabolism.171 In general, the most localized ictal discharges preceded scans with the smallest volumes of hypometabolism, and secondarily generalized seizures preceded scans with the most widespread patterns of unilateral hypometabolism. In both lesional and nonlesional partial epilepsies, the volume of hypometabolism expands with increasing numbers of seizures over the course of the epilepsy, even with nonprogressive lesions,88,124 and in limbic TLE, the severity of mesial temporal hypometabolism increases with increasing duration of epilepsy.209
Focal mesial temporal hypermetabolism sometimes occurs interictally in children with mesial TLE, but it rarely occurs in adults with localization-related epilepsies.23,41,210 Continuous or repetitive focal mesial temporal seizures, which are subclinical and not detectable with scalp electrodes, may cause “interictal” deep temporal hypermetabolism.185 Alternatively, there may be interictal epileptogenic processes that are peculiar to childhood and that generate greater glucose metabolism interictally. The latter speculation is encouraged by the presence of interictal regional hypermetabolism in some young children with Sturge-Weber syndrome or with infantile spasms, which does not occur in older children with Sturge-Weber syndrome or with Lennox-Gastaut syndrome (a common “endpoint” for patients with infantile spasms earlier in life), the older children having exclusively hypometabolism or normal metabolism interictally.
Ictal or peri-ictal (representing mixed ictal–postictal–interictal states during the [18F]FDG uptake period) [18F]FDG scans are difficult to obtain and interpret. True ictal imaging with [18F]FDG is restricted to status epilepticus due to the relatively poor temporal resolution of the [18F]FDG method. Occurrence of a single complex partial seizure during the [18F]FDG uptake period may be associated with the usual interictal findings of unilateral temporal hypometabolism. In one reported case, a partial seizure occurred about 2 minutes after [18F]FDG injection and the scan appeared normal; the same patient later had marked hypometabolism of the epileptogenic temporal lobe on an interictal [18F]FDG scan.71 Presumably, ictal hypermetabolism was averaged with interictal–postictal hypometabolism over the temporal lobe to cause “normalization” of [18F]FDG activity on the peri-ictal scan. In another case, a TLE patient had repeated complex partial seizures following [18F]FDG injection, and the scan showed hypermetabolism over the epileptogenic temporal lobe, with ipsilateral frontal and thalamic metabolic increases.44 Alterations on ictal and peri-ictal [18F]FDG images likely reflect ictal dysfunction at the site of ictal onset, but they also reflect dysfunctions in areas of ictal propagation and interictal and postictal dysfunction in these areas. It is difficult or impossible to sort out the relative contributions of these various dysfunctions to a single set of [18F]FDG images.
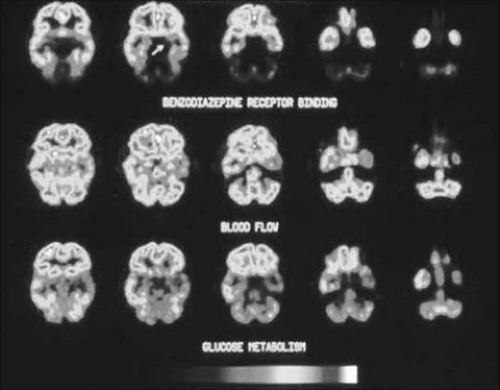 FIGURE 7. Coregistered interictal [11C]flumazenil and 2-deoxy-2-[18F]fluoro-D-glucose ([18F]FDG) positron emission tomography (PET) images of a mesial temporal lobe epilepsy (TLE) patient. Flumazenil transport rate is determined predominantly by regional cerebral blood flow. Flumazenil distribution volume is determined by the regional density of central benzodiazepine receptors. Five adjacent image planes are displayed for each modality. The more superior image plane is to the left of each row. The subject’s left is on the right of each image. Images of glucose metabolism and flumazenil transport rate show a widespread left mesial and lateral temporal decrease. Images of flumazenil distribution volume show a highly localized left anterior mesial temporal decrease (arrow). The specimen at efficacious temporal lobectomy demonstrated sclerosis of the left anterior hippocampus. (From Henry et al. with permission.) (See the color insert.) |
Cerebral glucose metabolism and CBF normally are “coupled” (increasing and decreasing in parallel with changes in synaptic activity within each region of cortex), but interictal PET measurements show uncoupling of CBF and [18F]FDG activity in TLE.53,114 Interictal CBF imaging with PET often shows “diffuse” regional hypoperfusion, consisting of a relatively large area of hypoperfusion with indistinct boundaries from adjacent areas of normal CBF and with inhomogeneous severity of hypoperfusion.9,48,108,118 Interictal regional CBF decreases often occur predominantly contralateral to the ictal onset zone in mesial TLE.118,206 Ictal CBF imaging of complex partial seizures with [15O]H2O is nearly impossible to obtain, given the 2-minute half-life of [15O], except with seizure induction by proconvulsant drugs or during complex partial status epilepticus.196 For these reasons, ictal imaging and resting
interictal imaging with [15O]H2O have no clinical role in presurgical evaluation. It has been suggested, however, that detection of regional glucose metabolic–CBF uncoupling might be more sensitive in detecting epileptogenic tissue than is [18F]FDG mapping alone.226
interictal imaging with [15O]H2O have no clinical role in presurgical evaluation. It has been suggested, however, that detection of regional glucose metabolic–CBF uncoupling might be more sensitive in detecting epileptogenic tissue than is [18F]FDG mapping alone.226
Mesial Temporal Lobe Epilepsy: Neuroreceptor and Other Ligand Studies
Imaging of the GABAergic Inhibitory System in Temporal Lobe Epilepsy
The γ-aminobutyric acid A (GABAA) receptors in temporal lobe epilepsy have been examined using [11C]flumazenil ([11C]FMZ), a high-affinity, highly selective ligand of central benzodiazepine receptors (BZRs) that are consistently present in the GABAA-receptor complex.28,62,63,73,90,91,101,102,103,105,162,163,172,173,176,177,178,193,194 The doses of [11C]FMZ required for PET receptor studies do not have detectable pharmacologic effects. The first study in TLE reported averaged imaging data of six patients; it showed unilateral temporal lobe decreases in receptor density that were significantly different from averaged normal control values, whereas calculated receptor affinity was normal.176 Subsequently, individually quantified [11C]FMZ scans showed that in mesial TLE patients, highly focal decreases in BZR density were usually limited to the anterior mesial temporal lobe.73,75 Cerebral MRI studies in some of these patients showed significant decrease in hippocampal volume. Quantitative analysis of coregistered [11C]FMZ PET and MRI showed that hippocampal atrophy did not account for the decreased hippocampal BZR density.73,105,113,193
Decreased hippocampal BZR density is evident on autoradiography of resected hippocampi in mesial TLE,14,87 including that resected from patients who had anterior mesial temporal decreases in [11C]FMZ activity on preoperative PET.102 These autoradiographic observations support the assertion that focally decreased anterior mesial temporal activity on [11C]FMZ PET, in fact, represents a decrease in anterior hippocampal BZR density. Nonetheless, it appears that [11C]FMZ binding on PET studies can be altered by recent or increased seizures shortly before PET data acquisition.13,177 Such seizure-related temporal changes may not only alter the quantitative measurement of [11C]FMZ PET, but it may also rarely even cause false lateralization of [11C]FMZ PET abnormalities in refractory TLE.163 Furthermore, developmental changes in the composition and regional density of GABAA receptor complexes are detectable with [11C]FMZ PET.18 Many patients who have focal anterior mesial temporal BZR decreases on [11C]FMZ PET are shown on [18F]FDG PET to have widespread temporal and extratemporal hypometabolism (Fig. 7), but TLE patients with mesial temporal [11C]FMZ reductions sometimes have more restricted mesial temporal hypometabolism or normal metabolism interictally.73,173 In addition to unilateral mesial temporal [11C]FMZ reductions, ipsilateral thalamic, insular, and neocortical regions sometimes show reduced [11C]FMZ binding in mesial TLE.63,73,91 Although extratemporal [11C]FMZ reductions appear to be less common and less widespread than are [18F]FDG reductions, on comparing these PET modalities in refractory TLE, all of these factors pose complexities in possible clinical application of [11C]FMZ PET.
Stay updated, free articles. Join our Telegram channel

Full access? Get Clinical Tree


