Relationship between hyperglycemia, retinal, cardiovascular, and cerebrovascular disease. Hyperglycemia causes chronic inflammation, endothelial dysfunction leading to atherosclerosis, and ultimately end organ disease. Dynamic retinal vessel analysis allows detection of early disease stages allowing initiation of early treatment for prevention of vascular disease
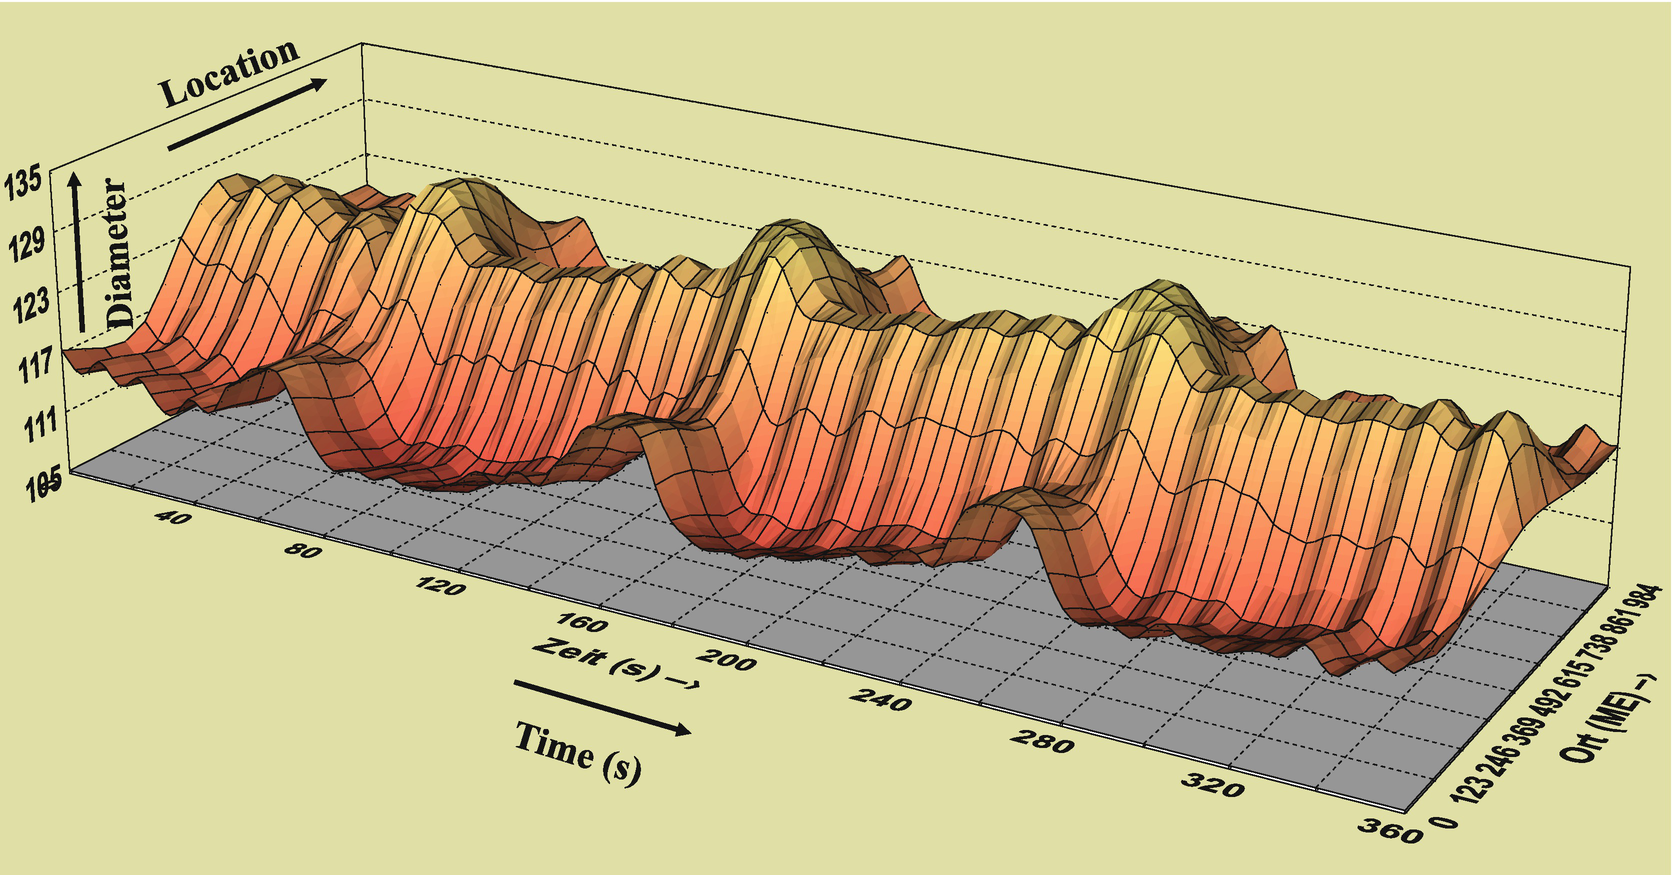
Dynamic Vascular Assessment (DVA, Imedos Inc., Jena, Germany) of retinal arterioles and venules allows measurement of early endothelial dysfunction in prediabetes and diabetes. The DVA utilizes a flickering light stimulus to induce changes in retinal vessel diameters allowing assessment of retinal vascular function. Flickering light is a well-established metabolic stimulus for the retinal vasculature [2, 12] which causes vasodilation and increased blood flow in healthy individuals [16–18]. In diabetic individuals this retinal vasodilation response is attenuated [14, 18, 19].
Reduced retinal vasodilation in response to flickering light in prediabetes and diabetes may indicate several underlying pathological processes. These include impaired autoregulation and endothelial dysfunction. Vascular abnormalities may cause retinal damage such as pericyte loss which may change the release of local metabolites. Animal and human studies suggest that part of the flickering light vasodilation can be explained by an increase in the production of nitric oxide (NO) [20]. In a recent study, it was shown that retinal vessels in persons with type-1 diabetes have similar responses to exogenous NO as healthy controls [19], implying that the diabetic retinal endothelium is not less sensitive to NO. Thus, other factors may play a role in the altered vasoreactivity observed in prediabetes and diabetes. Arterioles and venules may already be in a maximally dilated state in hyperglycemia to meet metabolic demand, or the altered retinal vasomotor response could result from impaired signaling between the neurosensory retina and retinal vessels. These impaired neurosensory coupling mechanisms may include glial cell or retinal barrier dysfunction and altered vascular endothelium growth factor signaling pathways [7, 21, 22].
In summary, morphologic and dynamic assessment of retinal vessels are helpful to identify patients at stroke risk.
2 Materials

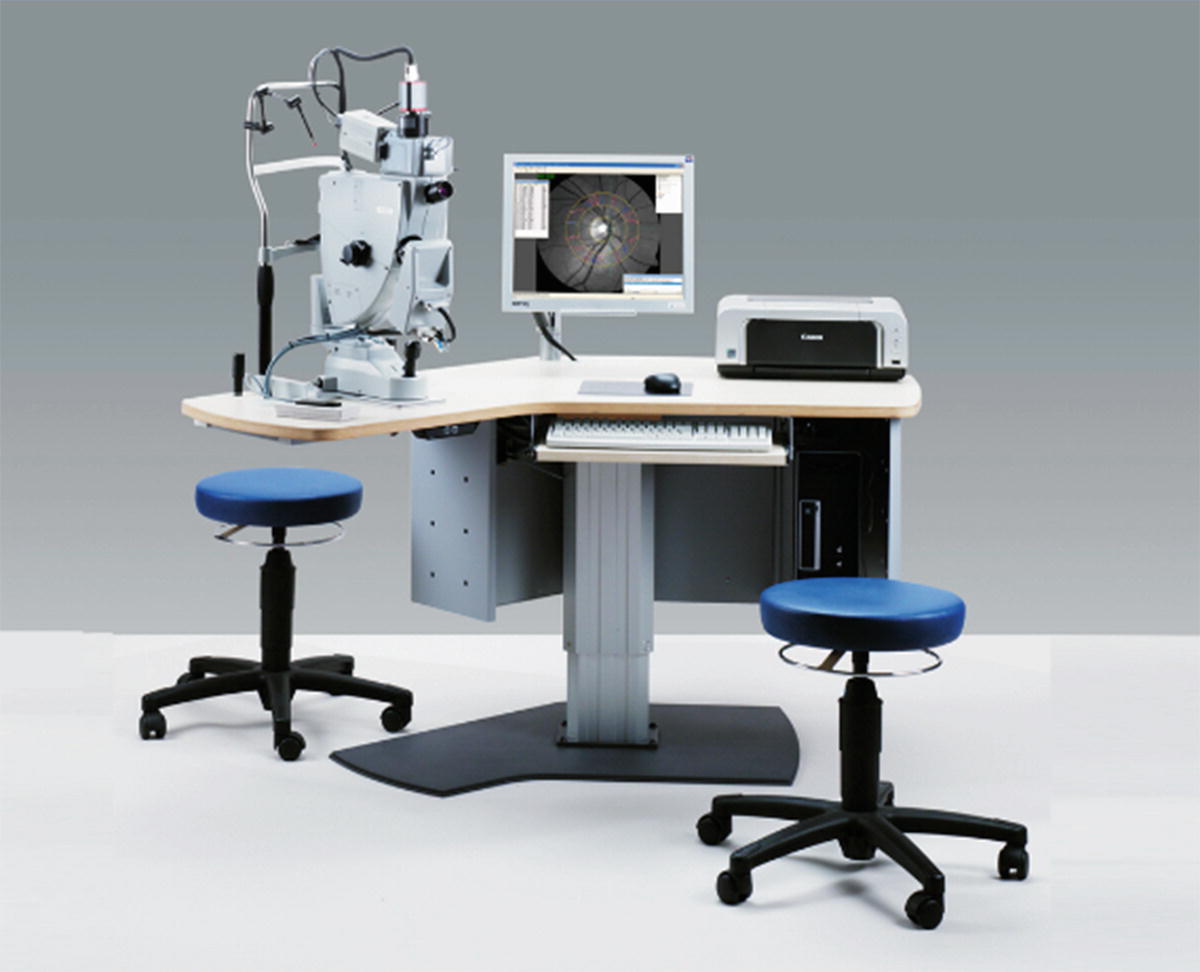
Modified Zeiss FF450 mydriatic fundus camera (Zeiss Jena, Germany) with video digital high-resolution color CCD camera and PC based imaging software (Imedos Inc., Jena, Germany) allowing static and dynamic retinal vessel measurements and funduscopic photography
3 Methods
3.1 Structural Vessel Imaging of the Retinal Arteriole-to-Venule (AVR) Ratios
One challenge of measuring retinal vessels by fundus photography is the calibration of retinal photographs. This is addressed through normalizing artery-to-vein diameters (AVR) or arterial length to diameter ratios (LDR) to obtain dimensionless ratios.
3.1.1 Procedure
Before any measurements are taken it is important to talk to the subject about what to expect during the examination. All measurements should be performed in a dark and quiet examination room (see Notes 1–3). Prior to the funduscopic examination, the pupils are pharmacologically dilated to allow easier and better view of the macula and retinal vessels. Short-acting topical parasympatholytic eye drops are used to paralyze the pupillo-constrictor muscle of the iris. Before obtaining any photographs, the pupils should be maximally dilated to avoid poor image quality.
Eyeglasses, but not contact lenses will be removed. The subject will fixate on a blinking light attached to the fundus camera. The patient fixates only with the eye that is not being examined. The fixation will be adjusted by the examiner so that the optic nerve head is in the center of the fundus monitor. The fundus camera’s focus and background light will be adjusted to provide crisp images. All photographs will be taken using a field angle of 50°. Flash light intensity will be adjusted as needed to provide well illuminated images, while avoiding reflection and discomfort of the study subject by overly bright flash intensities. Subjects are encouraged to blink multiple times during the examination (see Notes 4–6). Multiple images will be taken and stored to obtain optimal photographs for data analysis.
3.1.2 AVR Measurements

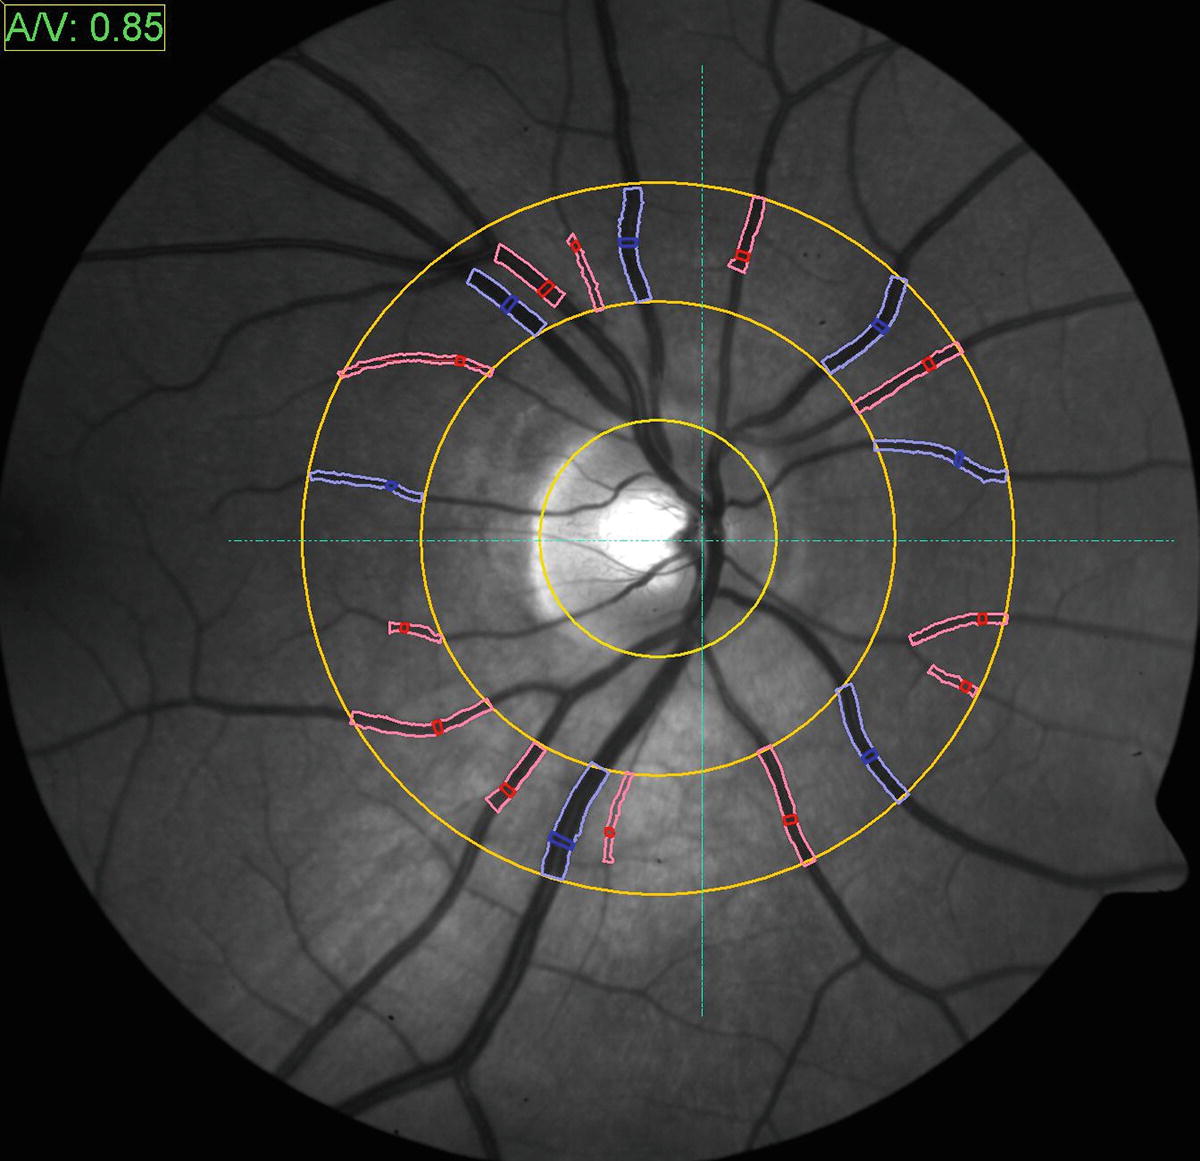
Morphologic retinal vessel analysis. The VesselMap software enables determination of the arteriolar to venular ratio which is a quantitative parameter to determine vascular risk. Concentric rings are positioned over the center of the papilla and measurements are taken within the most outer ring. Arteriolar segments (in red) are marked yielding a sum score of diameters (the arterial vessels artery equivalent, CRAE), and venule segments (marked in blue) yielding the venule vessel equivalent (CRVE). In combination with an individual’s medical history and an evaluation of microvascular fundus result, a valuable risk assessment can be made
Interpretation of measurements: Smaller CRAEs, larger CRVES, and lower AVRs are associated with chronic cerebrovascular and cardiovascular disease [24, 28–30]. The implemented AVR software also automatically generates stroke risk scores based on the Atherosclerosis Risk in Community (ARIC) study [31].
Validation: Reproducibility coefficients for static AVR measurements have been previously reported to be between 0.78 and 0.99 [26].
3.2 Dynamic Retinal Vessel Analysis


Stay updated, free articles. Join our Telegram channel

Full access? Get Clinical Tree


