17
CHAPTER
![]()
Scalp Video EEG Monitoring
Abeer J. Hani and Aatif M. Husain
While about 60% to 70% of patients with epilepsy will respond to a first- or second-line antiepileptic drug (AED), the remaining 30% to 40% end up developing medically resistant epilepsy. In these refractory cases, epilepsy surgery when possible is often considered to give these patients a chance at seizure freedom. The presurgical workup often involves careful analysis of the clinical semiology and electrographic presentations of the patient’s seizures in order to identify the ictal onset zone. To achieve that, scalp video EEG (vEEG) monitoring is used as a first fundamental step. Scalp vEEG is used to identify spells that mimic seizures and to identify patients with nonepileptic seizures (NES), particularly psychogenic NES (PNES).
In this chapter, an overview of the preparations needed to start scalp vEEG monitoring including AED withdrawal is presented. Following that, the common interictal and ictal patterns seen in the setting of presurgical evaluation using scalp vEEG monitoring will be highlighted. Finally, the range of EEG findings seen in PNES will be reviewed.
PREPARATIONS FOR vEEG MONITORING
Technical and Personnel Considerations
vEEG monitoring is often performed in specialized units referred to as epilepsy-monitoring units (EMU). The National Association of Epilepsy Centers (NAEC) has published detailed guidelines on the technical aspects of EMU monitoring (1).
Given the relative ease of use and the synchronized acquisition of video and EEG recordings, digital vEEG acquisition systems are now widely used in various epilepsy centers.
The presence of experienced personnel including EEG technologists and nurses is very important to provide continuous surveillance of the patient and the recording. Many centers also have 24-hour technologist assistants who watch the vEEG recordings and immediately notify the clinical staff of any seizures to allow for timely interventions. This, however, does not obviate the need for an observer, often a caregiver, present in the patient’s room who can identify events and press the EEG event button when an event occurs.
The review of the vEEG by experienced neurophysiologists and epileptologists must always be available even after hours, which often involves remote access to the vEEG study. Dedicated information technology (IT) personnel often can help set up such access and monitor the appropriate recording of large volumes of data.
Patient Safety
It is well known that patients with epilepsy may sustain multiple types of seizure-related injuries, including head, dental and soft tissue injuries, as well as fractures. The more serious of these injuries includes tongue bites, vertebral compression fractures, shoulder dislocations, subdural hematomas, and skull fractures seen with falls. There is also risk for sudden unexpected death in epilepsy patients (SUDEP) and prolonged seizures/status epilepticus (SE), mostly in patients with poorly controlled seizures and generalized tonic–clonic (GTC) seizures. Besides these potential risks, postictal psychosis has been found to arise rarely in the setting of vEEG monitoring and is seen more often in patients with medically refractory temporal lobe epilepsy (TLE) (2).
When vEEG monitoring is conducted for presurgical evaluation or spell characterization, the patient’s seizures are often induced using various provocative measures like photic stimulation, hyperventilation, sleep deprivation, visual patterns, video games, mental calculation, and most seriously rapid AED withdrawal (3). Ensuring the patient’s safety is important in the EMU when spells are being induced. There is no one single way of ensuring complete safety, but padding the bed rails should be performed routinely and maintaining constant 24-hour surveillance may help lessen the likelihood of potential complications.
Standardized plans and protocols to address SE, postictal psychosis, and falls also help ensure the readiness of the clinical team and avoid undue delays and confusion in periods of acute seizure emergencies.
Antiepileptic Drug Withdrawal
The limited time available to record an adequate number of seizures for presurgical evaluation often prompts the rapid tapering of the patient’s home AED regimen. There has been no consensus on how to best wean AEDs. Most of the literature available is based on expert opinions and surveys (4). The recurring theme is the need to individualize the rate and degree of AED withdrawal to patient- and drug-related factors. It is vital to know the frequency of seizures prior to admission and the presence of previously seen seizure-related complications, as well as the risk for seizure clustering and SE. In case of previous admissions for presurgical evaluation, inquiring and obtaining records that detail need for AED withdrawal and rate of seizure occurrence during these admissions may be very helpful. A patient with high seizure frequency may not require medication withdrawal, whereas patients with high risk for seizure clustering may merit a cautious, slow taper. The consensus is that slow withdrawal is overall favored over fast withdrawal and that close monitoring as medications are being withdrawn is very important. One approach is taper one medication by 33% to 50% on the first monitoring day and then to continue reducing the doses of other AED at a similar rate on each subsequent day until a sufficient number of seizures has been recorded (5). The plan of tapering AED should be clearly discussed with the patient, caregiver, nurses, and medical team.
USE OF vEEG FOR SEIZURE LOCALIZATION
Clinical Localization
The use of vEEG monitoring as part of the presurgical evaluation for epilepsy surgery permits the observation of the clinical semiology of the seizure and the detection of localizing signs by reviewing the video of the event. These signs often aid in determining the site of seizure onset and progression. A detailed discussion of localizing signs and seizure semiology may be found in Chapter 16.
Electrographic Localization
The EEG is analyzed to identify interictal and ictal abnormalities that further aid in localizing the ictal onset zone. Often electrodes are placed according to the International 10-20 system of electrode placement. Other electrodes including subtemporal chains or more specific electrodes according to the 10-10 system may be used to further help in seizure localization. Optimal EEG analysis often requires the use of bipolar and referential montages.
Interictal Abnormalities
Interictal abnormalities include intermittent or continuous focal slowing and suppression as well as focal or generalized epileptiform abnormalities. The location, type, frequency, and association with specific awake, asleep, or rapid eye movement (REM) states need to be identified for these abnormalities. In cases of multifocal discharges, the burden of discharges present in each region may need to be evaluated by performing a spike count. This is especially important in cases of bitemporal epilepsy and has been found in some studies to be predictive of the degree of seizure freedom following resection. A sample of these interictal abnormalities can be found in Figures 17.1–17.4.
Ictal Patterns
The most important factor in the presurgical evaluation for epilepsy surgery is the careful analysis of the EEG ictal pattern. In this discussion, only the ictal patterns of partial seizures will be discussed, as most generalized seizures are not considered for surgical treatment. Often, such patterns have a definite onset, evolution, and end. The onset could be nonspecific with either focal or generalized desynchronization, low-voltage fast activity, or irregular focal or bilateral delta activity (6).
It is important to know that scalp vEEG monitoring has several limitations. To start with, simple partial seizures have an EEG correlate in only 20% to 30 % of the cases. This is in contradistinction to scalp changes seen in about 85% to 90% of complex partial seizures. Frontal lobe seizures, however, may not show a clear ictal pattern on scalp EEG. This is thought to be due to the large surface area of the mesial and inferior frontal cortex that is hard to assay using scalp EEG monitoring. A retrospective study of 72 patients with Engel Class I surgical outcomes showed that ictal EEG localization was possible in 57% of all seizures and in 72% of all patients. False localization occurred in 6% of the seizures, occurring in 28% of occipital seizures and in 16% of the parietal seizures (7). Excessive myogenic artifacts that obscure the recording at times may preclude adequate localization of seizure onset.
The ictal EEG patterns vary depending on the brain regions where seizures start and will be discussed in the following sections.
Mesial temporal lobe epilepsy. The most common ictal onset pattern seen in patients with mesial TLE is lateralized rhythmic theta or alpha pattern and may be seen 10 to 40 seconds after clinical seizure onset (Figure 17.5). This pattern is seen in about 80% of patients with mesial TLE and, when present, it correctly lateralizes seizure onset in 95% of patients. The presence of ipsilateral postictal focal slow EEG activity further confirms the suspected ictal onset zone.
Neocortical temporal lobe epilepsy. Neocortical TLE often has broader distribution of interictal discharges and ictal rhythmic activity. The ictal onset is often slower, broader, and less focal than that of mesial TLE (Figure 17.6). The evolution of the seizures is also less stable in both frequency and amplitude and higher-voltage activity may be seen in the parasagittal electrodes.

FIGURE 17.1 Interictal abnormalities in a patient with left temporal epilepsy in the form of left temporal spikes and intermittent left temporal slowing. Note that the bottom 4 channels belong to a referential montage and show that the spike is of highest amplitude at T5.
![]()

FIGURE 17.2 Interictal EEG showing left temporal intermittent rhythmic delta activity (TIRDA) seen in a patient with suspected left temporal lobe epilepsy with evidence of left mesial temporal sclerosis.
![]()

FIGURE 17.3 Interictal EEG showing independent bitemporal spikes and sharp waves in a patient with suspected left temporal epilepsy in the setting of left mesial temporal sclerosis. Spike count done showed 75% predominance of the spikes and sharp waves in the left temporal lobe and 25% in the right temporal lobe.
![]()
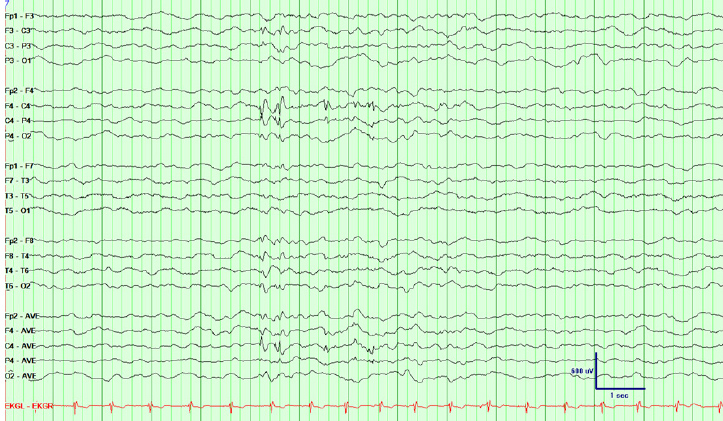
FIGURE 17.4 Interictal EEG showing right central spikes in a patient with suspected extratemporal epilepsy, later found to be right lateral frontal epilepsy using invasive recording. The bottom 4 channels display a referential montage showing that the spike is of highest amplitude at C4.
![]()
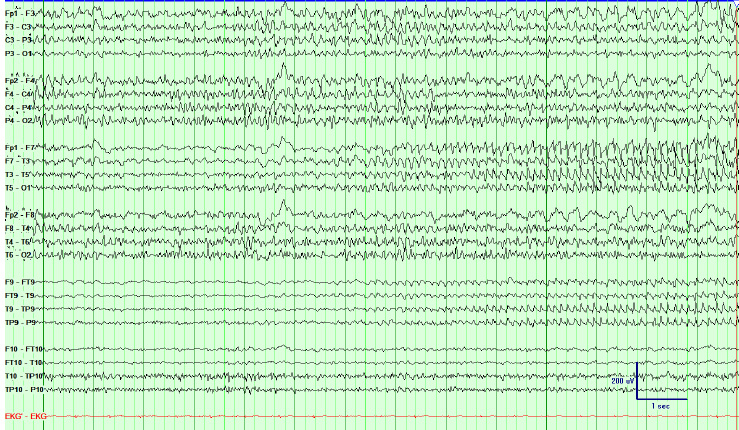
FIGURE 17.5 EEG showing ictal onset in a patient with suspected mesial temporal lobe epilepsy. The use of the subtemporal chain aids in localization of seizure onset. Notice the left temporal fast rhythmic theta activity at seizure onset. The patient has evidence of bilateral mesial temporal lobe sclerosis on her brain imaging.
![]()
Frontal lobe epilepsy. Frontal lobe seizures often do not have a clear, if any, localizing ictal pattern. Ictal onset and evolution may appear generalized, often reflecting secondary bilateral synchrony. With the hypermotor mesial frontal lobe seizures, excessive movement and muscle artifacts may obscure the EEG recording. Figure 17.7 shows an example of a left lateral frontal lobe seizure that could not be clearly localized using scalp EEG requiring more invasive monitoring. Orbitofrontal seizures often propagate to the ipsilateral temporal region or frontal region and may cause erroneous localization of seizure onset zones.
Parietal lobe epilepsy. Parietal lobe epilepsy is considered the most difficult to evaluate and localize with scalp EEG monitoring. Less than 10% of the ictal patterns are well localized to the parietal regions and 30% of them are associated with secondary bilateral synchrony. Often invasive monitoring is needed for these types of epilepsies.
Occipital lobe epilepsy. The ictal patterns are poorly localizing in occipital lobe epilepsy as well. Ictal patterns localizing to the occipital region are seen in only 15% to 20 % of patients. Often there is rapid spread to the motor areas with secondary generalization or to the ipsilateral temporal lobe mimicking mesial TLE. The clinical semiology with visual symptoms is more helpful than the EEG in suggesting an occipital onset.
USE OF vEEG FOR SPELL CHARACTERIZATION
Although EEG monitoring is most widely used in the setting of presurgical evaluation for seizure localization, scalp vEEG is considered the gold standard to differentiate epileptic from nonepileptic spells. There are many seizure mimickers that are discussed in other chapters where the use of vEEG may be very helpful. However, the discussion in this section will be focused on evaluation of PNES.
It is estimated that 15% to 30% of patients referred to the EMU for refractory epilepsy have PNES. The first step in the identification of PNES is suspecting the diagnosis. This could sometimes be done through obtaining a detailed history, but the actual observation of the clinical behavior and interpretation of the EEG during an event is most helpful in establishing the diagnosis. When watching the video of such events, there is often gradual onset and termination of the event along with other clues that may suggest PNES, including pelvic thrusting, eye closure, asynchronous movements, lack of stereotypy, side-to-side arrhythmic head movements, and opisthotonic posturing. Given that simple partial seizures and some frontal lobe seizures may show no clear EEG changes, watching the video for these clues helps rule out the possibility of partial seizures without ictal patterns. Sometimes capturing multiple events helps determine the true nature of the spells. The ILAE has put together a staged approach outlining the minimum requirements to diagnose PNES. It includes elements of the history, use of EEG, and other investigations (8). The suggestibility of the events and the ease with which the events may be provoked also help identify PNES.
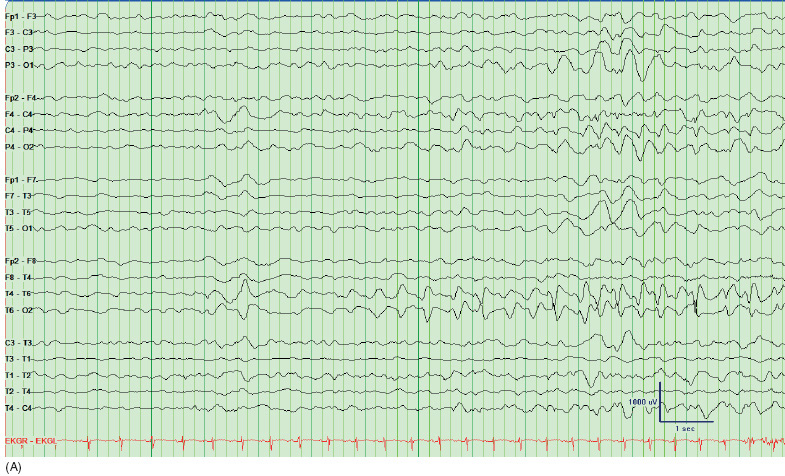

FIGURE 17.6 Ictal EEG showing right posterior temporal onset (A), with subsequent evolution in the frequency of the ictal activity immediately afterward (B). This patient had suspected periventricular heterotopia in her left and right temporal lobes.
![]()

FIGURE 17.7 Ictal EEG showing bilaterally synchronous onset with better evolution in the left hemisphere in a patient with left lateral frontal epilepsy who had undergone invasive monitoring that localized the seizure onset to the left hand area.
![]()
The EEG is often normal and shows no ictal patterns or epileptiform abnormalities during the events. In cases of excessive movement or muscle artifacts, the EEG recording may be hard to interpret. The review of EEG recordings in patients who were wrongly diagnosed with epilepsy showed over-reading of patterns that are normal variants or variations of normal background activity. A good knowledge of these common variants and common artifacts seen in EEG recordings is important to avoid misinterpretation. Figure 17.8 shows an example of midline theta of drowsiness, which is a normal variant that may be mistaken for an ictal pattern. Figures 17.9–17.12 show various examples of EEG recordings during PNES, highlighting some of the typical EEG findings seen during these events.

FIGURE 17.8 EEG showing a normal variant, midline theta of drowsiness, in a 17-year-old adolescent with history of generalized tonic–clonic seizures. It is important to identify these rhythms to avoid misinterpretation of the recording. Although there is some waxing and waning of the amplitude, there is no significant change in the frequency of this normal pattern.
![]()

FIGURE 17.9 EEG during monitoring for spell characterization. The patient started shaking with asynchronous movements that would wax and wane with eyes closed. EEG shows no clear evolution or buildup with myogenic artifact seen during the event.
![]()

FIGURE 17.10 EEG showing another event of the same patient as that shown in Figure 17.9. Notice again the fast myogenic artifact seen with the fast whole body movement. The patient had opisthotonic posturing and eyes closed during this event with whole body trembling.
![]()

FIGURE 17.11 EEG showing repetitive poor rhythmic myogenic artifact during a PNES induced by intermittent photic stimulation. The patient was having small amplitude front-to-back poorly synchronous head movements and would pause briefly when asked to interact with examiner.
![]()

FIGURE 17.12 EEG recording during a PNES of staring and poor responsiveness. This recording shows persistence of the normal awake baseline background during the event.
![]()


