Transcranial Magnetic Stimulation
Charles M. Epstein
Roberto Michelucci
Mark Hallett
Introduction
Transcranial magnetic stimulation (TMS) depolarizes neural elements through electromagnetic induction. It might more properly be called “transcranial electromagnetic stimulation.” However, emphasizing the magnetic component distinguishes TMS more clearly from direct electrical stimulation and highlights the easy penetration of the magnetic field through skin, skull, and cerebrospinal fluid. TMS provides unique, non-invasive measures of neurologic function, along with the possibility of focally augmenting or inhibiting cortical activity.
Principles of Transcranial Magnetic Stimulation
The fundamental principles of electromagnetic induction are that an electric current produces a magnetic field B and a changing magnetic field induces a flow of electric current in nearby conductors— including human tissue. A static magnetic field, however large, produces no current in the brain. Thus, the key parameter for a magnetic stimulator is not the absolute magnetic field strength in teslas but its first time derivative, dB/dt, combined with the duration of the stimulating pulse. Typical magnetic stimulators operate at a few thousand volts and several thousand amperes per pulse. Peak power output is measured in megawatts and lasts a few score microseconds. The very high peak currents are obtained by discharging a large capacitor directly into the stimulation coil (Fig. 1).
The resulting pulse waveforms are determined by the resonant frequency of the capacitor plus coil. These waveforms fall into two categories: (a) monophasic and (b) biphasic. “Monophasic” magnetic pulses have the general shape illustrated in FIGURE 2A, with a large initial peak and a much smaller, longer-lasting tail that presumably has no biologic effect. Biphasic pulses form a cosine wave, as shown in FIGURE 2B, with the later peaks smaller than the first because of energy losses in the circuitry.
These induced voltage waveforms mirror the voltage across the stimulation coil during the course of the discharge cycle. They do not reflect the actual coil current, which lags the coil voltage by 90°. The biphasic waveform appears to stimulate neurons maximally at the second (downgoing) shaded region, which represents the longest epoch of induced voltage across neuronal membranes.
Monophasic pulses have prominent directional effects, which may be important for some applications. They can be produced with circuitry that is lighter and cheaper than that needed for biphasic pulses. However, simple monophasic stimulators dissipate the entire capacitor charge with every pulse, incurring a high energy cost. This power loss translates into additional heating of the stimulation coil and other components, making monophasic stimulators more difficult to adapt for sustained repeat stimulation. Biphasic stimulators conserve energy by recapturing much of the original charge in the capacitor, and the biphasic wave shape has somewhat greater biologic effect for a given output voltage. This makes biphasic stimulators three to four times more efficient than monophasic devices, and the most practical choice for rapid repetitive stimulation.
TMS pulses may be single, paired, or repetitive (rTMS). rTMS can be fast (more frequently than once per second) or slow (less than once per second). Paired-pulse TMS most commonly involves passing two separate pulses through the coil within a few milliseconds. The large capacitors used for TMS cannot be recharged that rapidly, so paired-pulse stimulation requires two separate power modules coupled to a single coil.
Transcranial Magnetic Stimulation Coils
Circular Transcranial Magnetic Stimulation Coils
The simplest TMS coil is a circular loop. As shown in FIGURE 3, the changing current in the coil loop induces an antiparallel current flow of opposite direction in the underlying brain. Although the magnetic field is maximum directly under the center of the coil, the induced current is maximum near the outer edge of the coil. This discrepancy is an occasional source of confusion and may lead to the erroneous assumption that the site of magnetic stimulation is beneath the coil center.
Large circular TMS coils have good penetration to the cerebral cortex. They are commonly placed at the cranial vertex, where they can stimulate both hemispheres simultaneously. However, the effect on motor cortex tends to be asymmetric, especially with monophasic pulse waveforms. The main drawback of circular coils is their lack of focality. Not only does the circumference of the coil overlie a large area of brain, but in addition the radius of strongest stimulation is difficult to specify.
Figure 8 Transcranial Magnetic Stimulation Coils
If two round coils are placed side by side so that the currents flow in the same direction at the junction point, the induced electric fields will add together and be maximum below the junction (Fig. 4). This design, known as a “figure-8,” “butterfly,” or “double-D” coil, allows focal stimulation at a limited and clearly definable location. Because of this greater focality, figure-8 coils are chosen much more often than round coils for research and clinical applications. In typical use, the area of stimulated cerebral cortex is several square centimeters and its contours resemble an oval or rounded rectangle. The long axis of the rectangle parallels the junction of the two coils.
 FIGURE 1. Simplified transcranial magnetic stimulation (TMS) circuit. The capacitor is first charged to a high voltage and then is discharged into the inductor (the stimulation coil) when the switch is closed. Additional components are needed to shape monophasic TMS pulses and to stop biphasic TMS pulses after a single cycle. |
 FIGURE 2. Monophasic (A) and biphasic (B) transcranial magnetic stimulation waveforms. Darker curves represent the induced voltage in the brain, and lighter curves the simultaneous current in the stimulation coil. Shaded areas are the periods of highest induced voltage, when neuronal membranes are most likely to be depolarized. |
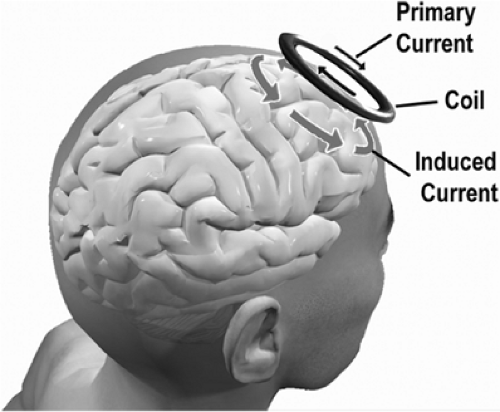 FIGURE 3. Round transcranial magnetic stimulation coil. Small dark arrows show the primary current in the coil. Large arrows show the path of maximum induced current, which lies below the outer coil edge. |
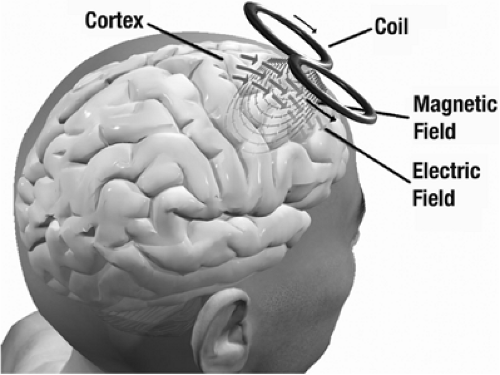 FIGURE 4. Figure-8 type transcranial magnetic stimulation coil. Small dark arrows show the primary current in the coil. Very small gray arrows (forming loops and penetrating into the brain) show the position and orientation of the maximum magnetic field, which lies perpendicular to the coil junction. Larger gray arrows show the position and orientation of the maximum electric field, which lies parallel to the junction and largely tangent to the cortical surface. |
Iron-core Transcranial Magnetic Stimulation Coils
The efficiency of energy transfer from TMS coils to tissue is extremely small, on the order of 0.0001%. This striking inefficiency is responsible for the high power requirement of magnetic stimulation, bulky power supplies, and an annoying tendency to overheat with repeated firing. Ferromagnetic cores have much greater magnetic permeability than air, and consequently produce equivalent magnetic fields with much lower coil currents, increasing efficiency by a factor of four and reducing heat production by a factor of 5 to 10. In return for this improved performance, iron-core coils may be several pounds heavier.
Sham Transcranial Magnetic Stimulation Coils
The need for placebo stimulation in TMS research has led to the development of sham TMS coils, which are intended to prevent the subject and even the operator from knowing whether a given session involves real or sham stimulation. Ideally, sham stimulation should reproduce the external appearance of the coil and lead wires, the auditory click and mechanical tapping when it fires, and the complex sensations of scalp muscle contraction and electrical paresthesias that accompany real TMS, without actually projecting a magnetic field into the brain. The most advanced sham coils are integrated with scalp electrodes, which deliver a small current and produce subjective scalp paresthesias at the moment of sham stimulation. Most
placebo coils have been less complex. Properly designed experiments rely in part on presenting real and sham stimulation to different subjects, or at widely separated times to the same subjects, so that any difference is difficult to detect.
placebo coils have been less complex. Properly designed experiments rely in part on presenting real and sham stimulation to different subjects, or at widely separated times to the same subjects, so that any difference is difficult to detect.
The Site of Transcranial Magnetic Stimulation Activation
The electric currents induced by TMS in brain are strongly constrained to lie parallel to the superficial surface of the cerebral cortex. Evidence from varied sources suggests that TMS induces depolarization of myelinated axons that are aligned parallel to the cortical surface, and lie near the gray–white matter junction. The sites of activation are likely to be branch points or bends, where induced transmembrane currents will be largest. In motor cortex the depolarized axons belong primarily to interneurons, although the axons of large motor neurons can be activated directly in some experimental paradigms.
Transcranial Magnetic Stimulation and the Neurophysiology of Epilepsy
A large number of studies have investigated cortical excitability in epilepsy by means of TMS to gain new insight into the physiopathology of this disorder. As discussed in a subsequent section, however, antiepileptic drugs (AEDs) can influence TMS parameters. Therefore, the optimal methodologic approach to investigating epileptic processes by TMS is to evaluate untreated patients or, if this first-choice approach is not possible, design TMS studies to evaluate at best the possible effects of AED treatment. In this section the results of TMS studies investigating cortical excitability are separated into two main subsections according to the generalized or focal nature of the epilepsies included in the TMS trials.
Generalized Epilepsies
In a group of untreated patients with IGE, Reutens et al.72,73 found an abnormal motor threshold (MT) reduction. This finding was interpreted as an index of motor cortical hyperexcitability due to the epileptic process. In contrast, Gianelli et al.39 reported increased MT in untreated patients suffering from idiopathic generalized epilepsy (IGE) with typical absence seizures. Another group found no MT abnormality in IGE patients.7,52
Finally, MT increase has been reported in a group of untreated patients who experienced a first generalized tonic–clonic seizure in the previous 48 hours, this finding having been interpreted as a postictal “protective effect.”21 The differences reported in these studies may be related to the clinical heterogeneity of IGE patients. In accordance with this view, Reutens et al.73 found that MT was lower in patients with myoclonic seizures than in patients suffering from absence seizures. In an unusual group of patients with IGE and versive, circling seizures, the interhemispheric difference of the MT was significantly higher than in IGE patients without circling and in normal controls, suggesting an explanation for the clinical phenomena.3 The cortical silent period (CSP) was found to be increased or normal in untreated patients with IGE.21,54,63
According to the finding of increased excitability as demonstrated by MT in generalized myoclonic seizures, an abnormal intracortical inhibition (ICI) reduction and a normal intracortical facilitation (ICF) were found in both treated and untreated patients with juvenile myoclonic epilepsy (JME).10,42,56 ICI suppression suggests impaired functioning of inhibitory circuits in JME, which may result in hyperexcitability of the corticospinal pathways. Increased facilitation at interstimulus intervals of 200 to 300 msec, but not at 100 to 150 msec, corresponds to the mean interdischarge interval of spike-wave activity on the electroencephalogram (EEG).7,54 Patients with progressive myoclonus epilepsies (PMEs) have reduced long-ISI paired-pulse inhibition47,94 as well as exaggerated facilitatory effect of peripheral stimulation on motor-evoked potential (MEP), suggesting a markedly increased influence of afferent input on motor cortical excitability.73 Digital stimulation markedly facilitated conditioned MEPs, suggesting cortical and subcortical components of abnormal sensorimotor integration in addition to hyperexcitability of the sensory and motor cortex.54
Focal Epilepsies
Normal MT was reported in untreated patients with benign rolandic epilepsy (BRE)53 and cryptogenic focal epilepsy (FE),61 as well as in a group of patients with focal seizures in which AED treatment was discontinued at least 48 hours prior to TMS as part of an evaluation for epilepsy surgery.103
Alterations in MT and CSP prolongation have been reported, mostly in patients suffering from seizures involving the motor cortex. In these cases, CSP prolongation may indicate that the mechanisms underlying CSP contribute to the compensatory phenomena in the interictal phase. In contrast, CSP has been shown to be usually normal in FEs localized outside the motor cortex.8,15,17,103 Nevertheless, in a patient with FE due to a lesion within the supplementary motor area19 and in two patients with FE secondary to cortical dysgenesis not involving the motor cortex,16 the CSP was greatly lengthened in the contralateral hand, this effect being more likely related to the structural brain lesions rather than to the epileptic process. One study reported a shortened CSP after high-intensity TMS of the affected hemisphere in a group of patients with cryptogenic focal epilepsy, whose characteristics indicated that the epileptogenic area did not correspond to the motor cortex.14 More recently, a single- and paired-pulse TMS study performed in 23 patients with focal epilepsies not including the primary motor area disclosed that CSP was shorter in epileptic hemispheres of extratemporal epilepsies than in controls, suggesting that FEs chronically influence distant cortex, leading to decrease inhibition in the ipsilateral motor cortex even when the epileptogenic zone is apart from it.42
Studies Performed by Stimulating During the Seizures
Single-pulse TMS performed during the seizures captured by long-term EEG monitoring may disclose a variety of alterations of MT and MEP amplitudes, which are likely to reflect the influences of different seizure types on the motor system.86 In four IGE patients, Gianelli et al.39 compared the size of MEPs following test magnetic pulses delivered during normal EEG segments and during typical 3-Hz spike-and-wave EEG complexes. MEP size was reduced when TMS was time-locked to the slow-wave component, suggesting a transient decrease in excitability of corticospinal pathways.
In a group of BRE patients presenting extreme somato-sensory-evoked potentials, an abnormal MEP facilitation was seen when the test magnetic pulse was delivered during the ascending phase and the peak of the spike evoked by electrical digital nerve stimulation.54 In contrast, peripheral nerve stimulation produced no abnormality of MEP size modulation in IGE patients.74
Effects of Anticonvulsants
Although TMS can be a useful method for evaluating a patient with epilepsy, it is crucial to note that anticonvulsants have a major influence on brain excitability and, therefore, TMS effects. Hence, it is necessary to understand these effects in order to interpret TMS studies. In fact, some of the information on mode of action of anticonvulsants was actually determined in part from TMS studies.
Before looking at anticonvulsant effects, we review the types of information that can be obtained from TMS studies. Virtually all the data come from stimulation of the primary motor cortex, where TMS produces MEPs in muscles topographically related to the site of stimulation.1,41,88 Stimulation can excite the descending axons from M1 directly, called the D-wave, and indirectly by a series of intracortical synaptic influences that produce a number of indirect or I-waves.23 At lowest stimulation intensity, typically the earliest effect comes from the first I-wave, I1.
The threshold for producing an MEP reflects the excitability of a central core of neurons that arises from the excitability of individual neurons and their local density. It can be influenced by drugs that affect Na and Ca channels, and must indicate membrane excitability. Because the MEP is small, the threshold measure reflects the influence of mainly the I1 wave. Threshold can be measured with the muscle at rest, rMT, or with an active background contraction of the muscle, aMT.
The recruitment curve is the growth of MEP size as a function of stimulus intensity and/or background contraction force. This measurement is less well understood because there are many effects, but it must involve neurons in addition to the core region activated at threshold. These neurons have higher threshold for activation because either they are intrinsically less excitable or they are spatially further from the center of activation by the magnetic stimulus. These neurons would be part of the “subliminal fringe” and contribute to I2 and later I-waves. D-waves are also recruited with higher intensities of stimulation.
Intracortical inhibition and facilitation are obtained with paired-pulse studies and reflect interneuron influences in the cortex.108 In such studies, an initial conditioning stimulus is given, enough to activate cortical neurons but small enough that no descending influence on the spinal cord can be detected. A second test stimulus at suprathreshold level follows at a short interval (Fig. 5). Intracortical influences initiated by the conditioning stimulus modulate the amplitude of the MEP produced by the test stimulus. At very short intervals, <5 msec, there is inhibition, and at intervals between 8 and 30 msec, there is facilitation. ICI is likely largely a GABAergic effect, specifically γ-aminobutyric acid A (GABAA).24 This type of inhibition is also referred to as “short ICI” or SICI to contrast it with ICI studied at longer time intervals, called LICI.78
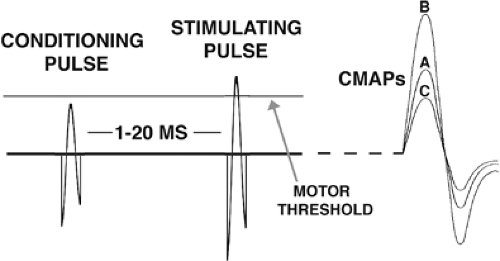 FIGURE 5. Intracortical inhibition and facilitation with paired-pulse stimulation. The first, conditioning pulse is just below motor threshold; the second, stimulating pulse, is just above. Depending on the time interval between the two pulses, the recorded compound muscle action potential (CMAP) may be (A) normal, (B) facilitated, or (C) inhibited. |
The silent period (SP) (or cortical silent period, CSP) is a pause in ongoing voluntary EMG activity produced by TMS. Although the first part of the SP is due in part to spinal cord refractoriness, the latter part is entirely due to cortical inhibition. There is evidence that this type of inhibition is mediated by GABAB receptors.102 SICI and the SP reflect different aspects of cortical inhibition.
Intracortical inhibition can also be assessed with paired suprathreshold TMS pulses at intervals from 50 to 200 msec. This is called LICI to differentiate it from SICI as noted previously. LICI and SICI differ, as demonstrated by the facts that with increasing test pulse strength, LICI decreases but SICI tends to increase, and that there is no correlation between the degree of SICI and that of LICI in different individuals.78 In addition, LICI appears to inhibit SICI and shows some interaction of inhibitory mechanisms within the human motor cortex.78 The mechanisms of LICI and SP may be similar.
Short afferent inhibition (SAI) is produced at short latency by somatosensory stimulation of the hand.24 This has been demonstrated to be mediated by muscarinic synapses because it is selectively blocked by scopolamine.
The data on the influence of anticonvulsant drugs on TMS measures were reviewed in depth by Ziemann.106 Only the highlights are addressed here and summarized in Table 1. As he noted, the literature is not completely consistent, and the acute and chronic effects of these agents may differ, which makes the interpretation of the literature a bit more complex.
Certain anticonvulsants affect mainly Na channels and thus should influence the threshold for the MEP selectively. This is true of carbamazepine (CBZ),106 phenytoin (PHT),11 and la-motrigine (LTG).106 These agents do not affect MEP recruitment, SP, SICI, or ICF.
Some anticonvulsants, such as lorazepam107 and diazepam,67 appear to facilitate the action of GABAA in a straightforward fashion. These drugs do not influence the motor threshold, but they suppress MEP recruitment, increase SICI, and depress ICF. On the other hand, a more recent finding is that these two agents have different effects on SAI.26,27 Lorazepam decreases SAI and diazepam increases it. This result shows how complex interneuronal networks are and that even similar compounds might have differing effects.
Related posts:

Stay updated, free articles. Join our Telegram channel

Full access? Get Clinical Tree


