Vascular Diseases of the Brain

Chapter 4 Vascular Diseases of the Brain


Imaging is an essential component of the workup of patients presenting with symptoms of stroke. Stroke is a nonspecific term denoting a sudden loss of neurologic function by any cause (e.g., ischemic infarction, spontaneous hemorrhage, postictal state). Although this term has little clinical value, it is useful because it is familiar to the public and the lay press. In our information age, where diseases compete for attention and dollars, it is a widely recognized trademark for a most important category of diseases. Over the past two decades, a host of new and evolving imaging techniques have been developed, allowing for ever more accurate and timely detection and characterization of strokes. The development and utilization of these techniques have been spurred by therapeutic advances, most notably the 1996 approval by the U.S. Food and Drug Administration of thrombolytic therapy with tissue plasminogen activator (tPA) for intravenous use as well as the positive results reported from intra-arterial thrombolysis. The imaging techniques available for the assessment of stroke include computed tomography (CT), magnetic resonance imaging (MRI), noninvasive angiography (CTA and MRA), catheter angiography, and CT and magnetic resonance (MR) perfusion imaging. In this chapter we discuss primary ischemic abnormalities and then turn to the hemorrhagic causes of stroke. Our goal is to provide a foundation to understand the diseases and problems that exist under the gamut of stroke.


ISCHEMIC CEREBROVASCULAR DISEASE (STROKE)


Clinical Features


Ischemic stroke has been recognized since the work of Hippocrates. Its etiology has been aggressively debated and remains as controversial as its recognition is old. Thromboembolic disease consequent to atherosclerosis is the principal cause of ischemic cerebrovascular disease. Ischemic stroke has been classified by subtypes (Box 4-1) based on a multicenter clinical trial, TOAST, or Trial of ORG 10172 in Acute Stroke Treatment. The most common causes of infarction include large-artery atherosclerosis, cardioembolism, and lacunes. This widely accepted classification scheme allows for assessment of etiology, prognosis, and treatment options. Outcomes differ depending on subtype. Large artery lesions have a higher mortality than lacunes. Recurrent strokes are most common in patients with cardioembolic stroke and have the highest 1-month mortality. Using the TOAST classification, treatment decisions and the outcomes of these treatments can be measured, allowing for both documentation of individual clinical competency and evidence-based assessment of therapeutic efficacy of different treatments and devices. For instance, carotid endarterectomy or stenting is the treatment of choice for large-vessel disease, whereas anticoagulation therapy is most useful in patients with small-vessel disease. Terms such as significant stenosis become rigorous when explicitly defined as greater than 50% to 70%, in particular when this definition has proven prognostic value.


Nonatherosclerotic causes of ischemic stroke include vasculopathies, migraine headache, and systemic/metabolic events (e.g., anoxia/profound hypoxia). They make up a small proportion of strokes in patients over age 50 years. In younger patients these nonatherosclerotic causes of ischemic stroke are more common, in particular in the absence of cardiovascular risk factors (i.e., hypertension, diabetes, smoking, and hyperlipidemia).


Thromboembolic events are the principal causes of ischemic stroke. Emboli can arise from arterial stenosis and occlusion—atherosclerotic debris and ulceration—in the extremities with coexistent right-to-left shunts, or cardiac sources (a cardiac source of emboli is responsible for 15% to 20% of ischemic strokes). The extent to which narrowing of the arterial lumen contributes to stroke is complex. Even in the absence of severe stenosis the reduction in flow may decrease the ability to “wash out” distal emboli before they produce ischemia (Box 4-2).


Extracranial/proximal intracranial large-vessel atherosclerosis leads to infarction when there is “hemodynamically significant narrowing”; that is, when the diameter of the vessel is decreased by 50% to 70% or the vessel lumen is reduced to less than 1.5 mm. Hemodynamically significant lesions are manifested by a pressure gradient across the stenosis, but cerebral blood flow (CBF) reduction does not occur until the diameter is decreased by approximately 90% as a result of autoregulation in the brain, where flow is maintained by decreasing cerebrovascular resistance. Blood flow may be preserved and infarction may even be prevented with complete occlusion of the vessel because of collateral circulation (circle of Willis and leptomeningeal vessels). Conversely, patients with complete internal carotid artery occlusions in the neck may still have cerebral infarctions from emboli. Emboli may be multiple and simultaneous, or a single embolus may break up and produce multiple infarctions.


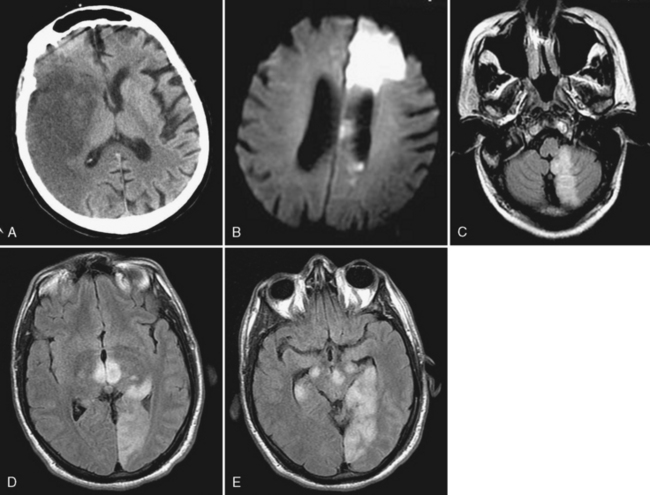
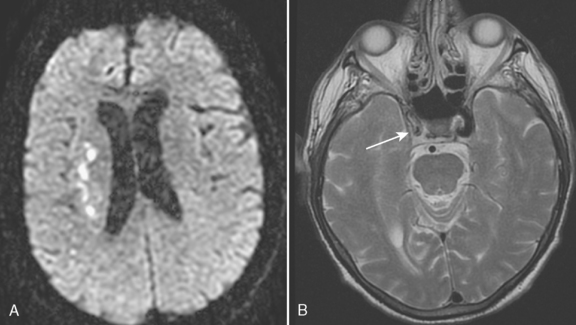
Atherosclerosis is common and typically affects multiple extracranial and proximal intracranial vessels or multiple regions within the same vessel. Thirty-five percent of patients over age 50 years have atherosclerotic changes in cervical cerebral arteries, but only one third of these individuals have symptoms of vascular disease. Primary stenosis/occlusion most often results in infarction when there is a preexistent stenosis with either new occlusion or a period of systemic hypotension. Acute extracranial carotid occlusion may produce large areas of infarction involving the deep (ganglionic) and superficial (cortical) middle cerebral artery (MCA) distribution (Fig. 4-1A). In these cases the infarcts are likely the result of large distal emboli associated with the proximal occlusion. The anterior cerebral artery (ACA) territory is typically spared because of collateral supply from the contralateral ACA via the anterior communicating artery (ACoA) of the circle of Willis. Isolated ACA and combined MCA/ACA (“holohemispheric”) (see Fig. 4-1B) infarcts are rare; holohemispheric infarcts are usually fatal. They most often occur in patients with acute myocardial infarction and atrial fibrillation due to the combination of large emboli and poor cardiac output. Alternatively carotid stenosis or occlusion may occur without marked distal embolization, producing “watershed” or border-zone infarction. Vascular watersheds are the distal arterial territories often at borders between two vascular distributions (see Chapter 2). Major border zones are found between the anterior and middle cerebral arteries and the middle and posterior cerebral arteries. Reduction in flow affects these zones to the greatest extent because they are furthest from the heart. Borderzone infarcts occur in the posterior parietal region (MCA/PCA border zone), the frontal lobes (ACA/MCA border zone), and the basal ganglia (Fig. 4-2). These infarcts are often small and may be confused with lacunar infarcts. The key to diagnosis is the presence of multiple infarcts at the interface between different vascular territories and evidence of carotid occlusion or slow flow. Other sites in the brain are selectively jeopardized by hypoxia or hypotension due to increased susceptibility to ischemia from increased metabolic rate and a lack of redundancy of blood supply. These include the hippocampus (Ammon’s horn), globus pallidus, and amygdala (anterior choroidal-posterior cerebral watershed), cerebellum, and occipital lobes, in that order.


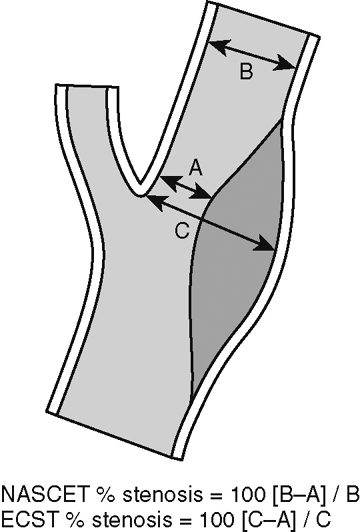
Interest in the detection and treatment of extracranial carotid artery disease has been heightened by the results of two large trials for the treatment of symptomatic and asymptomatic patients. The North American Symptomatic Carotid Endarterectomy Trial (NASCET) and the Asymptomatic Carotid Atherosclerosis Study (ACAS) confirmed the benefit of carotid endarterectomy in patients with high-grade carotid stenosis (>60% or more). The widespread availability of noninvasive vascular imaging (ultrasound, MRA, and CTA) and the introduction of stent devices for the carotid artery have resulted in a dramatic increase in the number of individuals being treated for carotid stenosis. The assessment of degree of stenosis is complicated by the existence of various methods for measuring stenosis. NASCET uses the ratio of the stenosis to the “normal lumen” distal to the stenosis, whereas ACAS and the European studies use the degree of stenosis relative to the estimated normal lumen at the same site. Each method has its limitations. The NASCET criteria can lead to underestimation of stenosis when the distal lumen narrows as a result of the severe proximal stenosis. The ACAS method is problematic because the observer must extrapolate what is thought to be the true lumen (Fig. 4-3). A more promising technique may be to simply measure the cross-sectional area of the stenosis. Recent studies have shown that when the vessel lumen is less than 1.3 mm the stenosis is at least 70%.


Intracranial embolic occlusion most commonly produces infarction in the midsection (posterior frontal, anterior parietal, and superior temporal) of the MCA distribution (see Fig. 4-1A). Emboli entering the carotid artery preferentially lodge in these MCA branches. Pure ACA embolic infarcts are rare. Isolated ACA infarcts (see Fig. 4-1B) typically occur as a result of intrinsic arterial disease and occlusion (e.g., diabetes, hypertension, vasospasm, and vasculitis) or from severe subfalcine herniation rather than emboli. The location and extent of the infarct will be determined by the site of embolic occlusion and extent and location of collateral supply to the brain distal to the occlusion. Occlusion of the distal carotid bifurcation and proximal MCA and ACA vessels (T occlusions) may result in infarction of the cortical (superficial) and ganglionic (deep) portions of the MCA territory. If there is good cortical collateral supply, the infarct may be confined (at least initially) to the basal ganglia and insula, in part due to lenticulostriate branch obstructions. Embolic infarcts in the vertebral basilar system may affect single or multiple vessels. Complete basilar occlusion produces cerebellar and brain stem infarcts and variable bilateral infarction of the inferior medial temporal and occipital lobes and posterior thalami, whereas basilar tip occlusions spare the posterior fossa structures (see Fig. 4-1D and E). The extent of posterior cerebral artery involvement depends on the status of the posterior communicating arteries (PCoA). Focal occlusion of the distal vertebral artery produces infarcts in the distribution of the posterior inferior cerebellar artery (PICA), leading to infarcts in the inferior cerebellum and lateral medulla (Wallenberg syndrome) (see Fig. 4-1C).


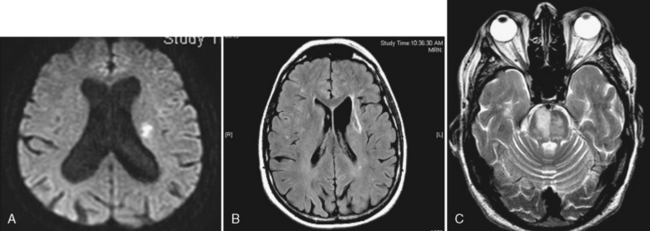
Lacunar infarcts are small lesions produced by occlusion of deep perforating arteries. Lacune is a venerable pathologic term indicating a fluid-filled hole in the brain (Fig. 4-4). The TOAST criteria define lacunes based on size, location, and etiology rather than gross pathology. I used to rail against the use of the term lacunar infarct on CT reports because one cannot tell on CT whether the lesion is fluid filled or just gliotic. Although this distinction can be made on fluid-attenuated inversion recovery (FLAIR) MRI, the point is moot because lacune now has a formal meaning; by definition, it is an infarct of less than 15 mm. Lacunes have a predilection for the basal ganglia, internal capsule, pons, or corona radiata (see Fig. 4-3A and B). Occlusion of brain stem perforating arteries produces distinctive infarcts that are paramidline, unilateral, and tubular in appearance on axial imaging, reflecting the location and course of the pontine perforating arteries (see Fig. 4-4C). Although these infarcts were originally thought to arise from small-vessel atherosclerosis and lipohyalinosis associated with hypertension, many other causes have been proposed, including emboli, hypercoagulable states, vasospasm, and small intracerebral hemorrhages.


Transient ischemic attack (TIA) is a sudden functional neurologic disturbance limited to a vascular territory that usually persists for less than 15 minutes, with complete resolution by 24 hours. The diagnosis of TIA is difficult because it is by definition retrospective. In approximately 25% of cases the clinical diagnosis of TIA is incorrect. The event is either a completed infarct or has another etiology (e.g., intracranial hemorrhage, migraine or seizure). Although TIAs have a variety of causes, the common pathway is temporarily inadequate blood supply to a focal brain region. TIAs are not benign events. Almost one third of patients will eventually have cerebral infarction (20% within 1 month of the initial TIA) or, despite resolution of symptoms, have a diffusion-positive event on MRI. Quantitative measurement of apparent diffusion coefficients (ADC) from MR diffusion-weighted images (DWI) may reveal mild decreased diffusion (<25%) in symptomatic areas without signal abnormality on DWI, indicating that although there is no permanent functional deficit, neurons have been lost (25% in some animal studies). Thus, proceeding with the workup after the TIA is urgent. A reversible ischemic neurologic deficit lasts less than 7 days and symptoms should resolve. Again, DWI is positive in about 50% of these cases, even with symptom resolution. So are these entities truly reversible/transient or just compensated?


PATHOLOGY OF ATHEROSCLEROSIS


The process begins in the first decade of life in the aorta with subendothelial fatty deposition (fatty streak) consisting of smooth muscle cells, foam cells, T lymphocytes, and an extracellular matrix of lipid and collagen. Fat is discharged into the extracellular space, precipitating intimal thickening, proliferation of smooth muscle cells, and inflammatory changes, eventually resulting in fibrosis and scarring. A fibrous plaque consists of collagen, lipid, smooth muscle cells, and fibroblasts. The endothelial surface of the plaque may degenerate with ulceration and discharge of lipid or calcified debris into the vessel lumen. Platelets may accumulate on the ulcerated intimal surface and become exposed to collagen, leading to thrombus formation and platelet emboli. Arterial bifurcations are subject to the greatest mechanical stress and are especially prone to atherosclerosis. The composition of plaques is variable, with some becoming large and fibrotic, producing luminal narrowing, whereas others accumulate lipid and cholesterol. The composition of the plaque may have significant prognostic and therapeutic implications. Plaques with thick fibrous caps may be stable and asymptomatic even while producing significant stenosis. These lesions may require no therapeutic intervention. Plaques with a thin or absent cap (unstable plaque) with exposed lipid or hemorrhage are prone to development of thrombus and embolization. Aggressive therapy may be warranted regardless of the degree of stenosis. Imaging of carotid plaques with MR and CT is an area of active research; it may be that by the time of the next edition of this book plaque imaging will be a standard diagnostic tool. Surface coil carotid plaque imaging readily identifies enhancement of fibrous caps and plaque hemorrhage (blood intensity) and calcification (dark on all sequences). Platelet accumulation at the site of plaque disruption through a thin fibrous cap (nodules interrupting enhancing cap) can now be readily identified with surface coil carotid plaque imaging.


IMAGING TOOLS


Brain


Computed tomography has been the mainstay of stroke imaging since its inception in the mid-1970s. Unenhanced CT scans are fast and readily available. They are excellent for detecting large ischemic infarcts of more than 6 to 8 hours’ duration. Nonischemic causes of stroke, including hemorrhage, infection, and tumor, are easily detected although often poorly characterized. There are, however, significant limitations to CT. It does not reliably detect infarcts of less than 4 hours’ duration and the extent of the infarct is often difficult to characterize. Acute lacunar infarcts often go undetected and are typically impossible to distinguish from chronic lacunar infarcts. Overall detection rates for acute infarction are approximately 58% in the first 24 hours. Detection of hyperacute infarction (<6 hours) on unenhanced CT is a skill that requires expertise and experience. Initial results from the European Cooperative Acute Stroke trial of intravenous tPA indicated that the drug was not effective. Review of the imaging studies by expert neuroradiologists revealed that the lack of efficacy was the result of protocol violations caused by incorrect interpretations of CT scans. The Massachusetts General Hospital group recommends using very narrow CT window widths and levels to spot subtle low-density changes that portend infarct. Unfortunately, patients with acute infarction do not have the option of having their scans read by experts. The introduction of low-dose algorithms to limit radiation exposure may be necessary from the perspective of the overall population safety, but the increased noise inherent in these scans makes detection of subtle infarct changes more difficult. Unenhanced CT can provide limited information about the intracranial vessels (the dense vessel sign of acute embolic occlusion) and no information on the status of the brain that surrounds the already infarcted tissue. Perfusion CT shows promise in identifying strokes that may develop and are inapparent on enhanced CT.


MRI is much more sensitive than CT in the detection of hyperacute infarction. T2-weighted FLAIR scans have a sensitivity of 85% within the first 24 hours. Hemorrhage (either within the infarct or as an independent cause of stroke) is readily seen and, in contradistinction to early opinions, MR is more sensitive than CT, even in the hyperacute phase. Detection of hemorrhage has been greatly facilitated by the routine use of gradient echo and more recently susceptibility-weighted (SWI) sequences. Other causes of stroke, including venous thrombosis, vascular malformations, infections, and tumors, are detected and characterized with greater accuracy than is possible with CT. Arterial and venous occlusion or slow flow can be detected on MRI, in particular with the use of gradient echo scans and FLAIR. Focal acute embolus in a major vessel (the corollary of the dense vessel sign on CT) is best detected on gradient echo scans, and slow flow can be seen on FLAIR and enhanced T1-weighted images (T1WI).


Of course, the advent of DWI has greatly enhanced our ability to detect hyperacute infarction and to characterize all infarction. Whereas “routine” MRI has an 85% sensitivity for infarction within 24 hours, MR with DWI has a sensitivity of approximately 95% in this period, including the first 3 hours after infarction, when CT typically does not demonstrate any parenchymal abnormality. The dramatic hyperintensity seen in acute infarction (the “light bulb sign”) also makes detection easier, especially for the inexperienced observer. CT is easy to do and hard to interpret. MRI is hard to do but easy to interpret.


So how does DWI work? Diffusion imaging is a technique that is sensitive to the movement of water molecules (Brownian motion). In pure water, protons move about and jostle each other. Many of us remember high school science class experiments where we trained low-tech light microscopes on small pools of water and watched as particles of dust wobbled around under the influence of unseen water molecules. Fewer of us are aware that the mathematical proof of Brownian motion published by Albert Einstein in 1905 confirmed once and for all the existence of molecules. In pure water, the extent of water molecule motion (self-diffusion) will be determined by temperature. The higher the temperature, the more energy the protons possess and the farther they will move. Biologic tissues are more complex. The water molecule encounters various barriers and impediments to motion, including cell membranes, intracellular organelles, and extracellular proteins. The term apparent is applied to modify the word diffusion, connoting the uncertainty of the water motion in biologic samples caused by these barriers. In gray matter these structures are relatively randomly arrayed so diffusion is the same in all directions (isotropic). In white matter diffusion is constrained by the orientation of the white matter tracts. Water will diffuse preferentially along rather than across these tracts and is therefore anisotropic. The distance traveled by a particular proton will depend on the number of impediments it encounters and the period of time during which the molecule is “observed” during the MR sequence. If the observation time is too short, the paths of most molecules will not be differentially affected by cellular barriers (i.e., membranes, proteins); however, when the observation time is long enough encounters with barriers will restrict diffusion. Thus DWI is unique among all imaging techniques in that it is a direct window into the spatial scale of molecules and cells. The effect of this diffusion can be measured as a change in signal intensity on MR. This measurement can be made by applying two gradient pulses to dephase and rephase the water molecules during the image acquisition. Those molecules that diffuse the greatest distance (i.e., subject to the greatest gradient strength difference) will be unable to rephase completely and will lose signal. The signal loss depends on the diffusion coefficient of the molecule and the strength and duration of the gradient pulses. This can be defined mathematically by the following equation:


image


where D is the diffusion coefficient, S0 is the signal intensity of the unweighted image, S(b) is the signal intensity of the images for various b values, and the b value is specific for the particular pulse sequence used to measure diffusion. b is a function of the diffusion gradient strength, the duration of the diffusion gradient pulse, and the time of the diffusion measurement. The b value determines the degree to which an image is sensitive to diffusion (the higher the b value the more diffusion weighted an image becomes). The ADC can be calculated by using images with varied gradient strengths (different b values). At a minimum ADC can be calculated if there are at least two b values, one of which must be set to approximately 0; that is, with no diffusion weighting. In clinical practice two b values are generally used; however, four or more b values can be measured to improve accuracy of measurement. Commonly used values include a b value of 800 to 1,200 sec/mm2, with time to echo (TE) of 90 to 120 msec.


Diffusion images can be created to be (1) directionally sensitive (with a T2 component); (2) directionally insensitive (the cube root of the product of three directions—with a T2 component); or (3) directly correlated to ADC values (no T2 component). In clinical practice, DWI sequences include approximately 30 slices, with individual images obtained in approximately 20 msec. Four acquisitions are obtained at each location (total acquisition time for the brain < 1 min). One acquisition is acquired with no diffusion gradients (the b0 image—a T2- and susceptibility-weighted image) and three sets of orthogonal (anteroposterior, superoinferior and right-left) images are acquired with a b value of ~1000. The three orthogonal images are averaged to produce a “trace” image that is insensitive to the anisotropy created by the orientation of white matter tracts. For instance, on a DWI acquired with the diffusion gradients applied in the anteroposterior direction the corpus callosum will appear bright because there is almost no anteroposterior motion of water molecules in the highly organized right-to-left–oriented callosal fibers. On the other hand, on images where the diffusion gradients are applied in a right-left–orientation the vertically oriented white matter of the corticospinal tract will appear bright. The trace image is the average of these three acquisitions that eliminates the effects of fiber tract orientation on signal intensity. In clinical practice only the trace image is viewed because in processes like infarction and other diseases it is the magnititude, not the directionality, of diffusion that is important. However, information on the direction of diffusion and the degree of anisotropy are obtained and can be used to create images that record the direction and integrity of white matter tracts. This technique, called diffusion tensor imaging, requires image acquisition in at least six planes rather than the three planes used in clinical DWI to completely describe the diffusion tensor. (A tensor is any measurement with at least three components.) The diffusion data can be used to generate ADC maps by performing a voxel-by-voxel calculation of ADC using the trace diffusion and b0 image. Subtractions of the diffusion and b0 data can also be used to generate “exponential” diffusion images. Generation of these maps is fast and simple. In clinical practice it is common to generate and view DWI, ADC, and exponential images. ADC maps and exponential maps eliminate the T2 component of intensity (T2 shine-through) on diffusion sequences (see below). All DWI start life as T2WI, from which signal is subtracted based on the extent of diffusion; therefore, with routine DWI there is always a contribution of T2 to signal intensity. It is also helpful to have the b0 images available for viewing. Because of speed, these images are rarely motion degraded; therefore, in uncooperative patients or in patients having very rapid MR studies, the b0 can serve as a “poor man’s” T2WI or SWI.


On diffusion-weighted imaging, tissues that most nearly approximate water will have the highest rates of diffusion (high ADC) and will lose signal more rapidly than those with low ADC. Thus, cerebrospinal fluid (CSF) appears dark on DWI as the water molecules can freely diffuse for relatively large distances, whereas gray matter is light gray and white matter slightly darker gray. On ADC maps contrast is reversed. Increased diffusion is bright; therefore CSF is bright while brain tissue is dark. Some clinicians prefer exponential diffusion images to ADC maps because the relative signal intensities are the same as with DWI (high diffusion such as CSF is bright). In reality the reversal of signal between DWI and ADC maps is not a problem if one simply remembers that CSF has the highest diffusion and that lesions with low diffusion will look the opposite of CSF. In tissues where diffusion is more restricted than in normal brain (e.g., hyperacute infarction) there will be less water molecule motion than in normal tissue and therefore less signal loss during the diffusion acquisition. These regions will appear dark on ADC maps. When water motion is increased in tissue due to vasogenic edema (increased extracellular water) or gliosis (decreased cellularity), tissue will appear isointense on DWI and hyperintense on ADC maps. Tissues with increased diffusion are typically isointense rather than hypointense on DWI because of T2 effects. Increased tissue water (vasogenic edema) increases the T2 of the tissue; therefore, the effects of increased T2 (increased signal) and increased diffusion (decreased signal) tend to cancel each other out. In circumstances when diffusion is equal to normal brain but T2 is increased (subacute infarction), the tissue will look bright on DWI and isointense on ADC maps, a phenomenon known as T2 shine-through.


Vessels


It is obviously important to have knowledge of the arteries and veins in assessing individuals presenting with “stroke.” Identification of occlusion or stenosis of extracranial and intracranial arteries can confirm the ischemic nature of a lesion and help to determine whether an infarct is due to slow flow, proximal (e.g., MCA) embolic occlusion, or small-vessel disease. Direct visualization of the dural venous sinuses and cortical veins is often critical to the correct diagnosis of venous thrombosis in particular, given the protean clinical manifestations, etiologies, and imaging findings in this disorder. In the past, assessment of vascular structures required invasive catheter angiography, but there are now multiple noninvasive ways of assessing the cervicocerebral vessels, including CTA, MRA, and ultrasound. Each of these techniques has its advantages and limitations; the choice of the technique or combination of techniques to be utilized will depend on the circumstances and diagnostic questions in each case. Catheter angiography is reserved for those cases in which noninvasive studies do not provide a definitive diagnosis and, most importantly, when endovascular intervention (e.g., angioplasty, stenting, aneurysm coiling) is performed.


Carotid Ultrasound/Transcranial Doppler


Ultrasound uses sound waves to image structures or measure the velocity and direction of blood flow. Color-coded Doppler ultrasound can depict the residual lumen of the extracranial carotid artery more accurately than conventional duplex Doppler. However, the results from color-coded Doppler ultrasound examination are operator dependent and controversial. Problems include distinguishing high-grade stenosis from occlusion, calcified plaques interfering with visualization of the vascular lumen, inability to show lesions of the carotid near the skull base, difficulty with tandem lesions, and inability to image the origins of the carotid or the vertebral arteries. In the NASCET study, Doppler measurements were 59.3% sensitive and 80.4% specific for the detection of stenosis greater than 70%. A battery of sonographic noninvasive carotid studies, including indirect tests monitoring the superficial and deep orbital circulations and direct studies using imaging and function, has been advocated to increase the accuracy, particularly in significant vascular disease.


Transcranial Doppler ultrasound is a noninvasive means used to evaluate the basal cerebral arteries through the infratemporal fossa. It evaluates the flow velocity spectrum of the cerebral vessels and can provide information regarding the direction of flow, the patency of vessels, focal narrowing from atherosclerotic disease or spasm, and cerebrovascular reactivity. It can determine adequacy of MCA flow in patients with carotid stenosis and evidence of embolus within the proximal MCA. It is very useful in the detection of cerebrovascular spasm after subarachnoid hemorrhage (SAH) or surgery, and can rapidly assess the results of intracranial angioplasty or papaverine infusions to treat vasospasm.


Angiography


MRA is a critical and important tool for assessing the extracranial and intracranial vascular system. The technique is noninvasive and does not involve use of ionizing radiation. (The effects of radiation exposure from CT scanning on population cancer risk have recently become of concern; therefore, use of MRA may be preferred, in particular in younger patients.) In many cases, MRA does require an injection of contrast material. Three different techniques are used to generate MRA: time-of-flight (TOF), phase contrast (PC), and contrast-enhanced MRA (CEMRA). Once the imaging data is gathered, it may be processed by several display techniques. The one most commonly used is termed maximal intensity projection (MIP), which finds the brightest pixels along a ray and projects them along any viewing angle. MIP is fast and insensitive to low-level variations in background intensity.


In TOF MRA (the most commonly used technique) protons not immediately exposed to a radiofrequency (RF) pulse (unsaturated spins) flow into the imaging volume and have higher signal than the partially saturated stationary tissue (which has lost signal secondary to the RF pulse). This is a T1 effect and has been termed flow-related enhancement. The images can be acquired as individual slices (2D) or as a volume (3D) acquisition. In 3D TOF MRA the volume of tissue to be imaged is limited because as protons “flow” through the volume they are exposed to RF pulses and become saturated. To cover large areas, (e.g., the cranial cavity) 2 to 3 volumes are acquired with overlap between the volumes. In either case flowing blood will appear bright. To visualize the arteries without interference from the veins, an initial superior nonspatially localized saturation pulse is applied. Thus blood flowing inferiorly in the venous system will be saturated and will not be visible on the MRA. With TOF MR venography (MRV) the saturation pulse is applied inferiorly to saturate the arterial blood. The 2D TOF techniques are very sensitive to slow or moderate flow (as flow-related enhancement is maximized), whereas 3D techniques are better than 2D MRA for rapid flow and have higher resolution. They are also less likely to be degraded by patient motion. In the evaluation of cervical vasculature, it is common to perform a 2D sequence of the entire cervical region and a small-volume 3D sequence centered on the carotid bifurcation. Intracranial arterial evaluation is performed with 3D TOF. A pitfall in the evaluation of TOF MRA can occur when there are T1 hyperintense lesions or structures within the tissues. These areas of T1 hyperintensity will be visible on the MRA images because the MIP images will include all regions with an intensity above a predefined threshold. Thus, subacute hematomas and fat-containing lesions will appear bright. Subacute intramural clot in dissections and venous sinus thrombosis will also appear bright and may be mistaken for flow.


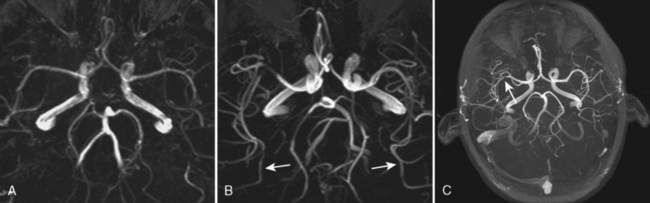
The advent of 3 Tesla (3T) MR scanners has produced a dramatic improvement in TOF MRA (Fig. 4-5). This is related in part to increased signal-to-noise ratio; however, a more important cause is increased T1 of normal tissues when imaged at 3T. Because the T1 is longer it is easier to suppress background signal at 3T, resulting in a marked improvement in visualization of flowing intravascular protons. This effect is most notable on intracranial MRA. At 1.5T visualization of second-order intracranial branches (e.g., intrasylvian MCA branches) is limited; therefore, detection of distal occlusions, vasculopathy, and arterial spasm is not reliable. At 3T these vessels and even smaller arteries (e.g., lenticulostriate arteries) are well visualized in almost all cases (see Fig. 4-5). Therefore, it is preferable to perform MRA studies on 3T scanners.


In phase-contrast MRA, bipolar flow-sensitizing gradients of opposite polarity are used to “tag” moving spins (protons) that are then identified owing to their position change at the time of each gradient application. The operator chooses the flow velocities that the angiogram will be sensitive to, termed the VENC, which vary in neuroradiology from 30 cm/sec for arterial flow to 15 cm/sec for venous flow. (At lower VENC levels phase-contrast techniques can be used to assess spinal fluid flow.) Complex subtraction of data from the two acquisitions (one of which inverts the polarity of the bipolar gradient) will cancel all phase shifts except those due to flow. This technique provides excellent background suppression to differentiate flow from other causes of T1-shortening, such as subacute hemorrhage or fat. In the “early” days of MR, phase-contrast was an alternative to TOF for the routine assessment of arterial disease but TOF proved superior for this task. Phase-contrast MRV is, however, routinely used for suspected venous thrombosis because of its ability to differentiate between flow and subacute (bright) thrombus that obfuscates TOF MRV.


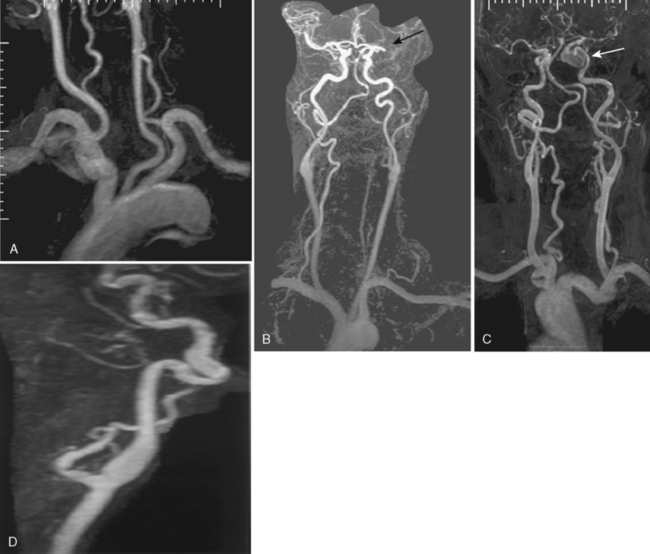
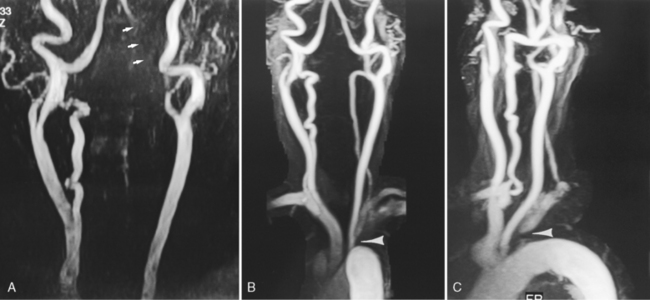
Contrast-enhanced MRA uses paramagnetic contrast enhancement in association with 3D TOF imaging. This method has many advantages over the noncontrast approach. Like CTA (see below) the technique visualizes contrast within vessels and is not dependent on flow. The result is a rapidly acquired (<30 sec) high-resolution image of the extracranial and proximal intracranial vessels with typical coverage from the aortic arch to the circle of Willis (Fig. 4-6). Timing is critical because enhancement of veins confounds the ability to demonstrate arterial anatomy and the sequence is typically triggered with MR fluoroscopic techniques. This technique offers excellent visualization of the aortic arch and proximal cervical vessels. These structures are not seen on routine TOF MRA and may be difficult to visualize on CTA. Because it is not dependent on flow and not affected by turbulence it is superior to noncontrast MRA for evaluation of carotid bifurcations and cervical and intracranial vertebrobasilar systems. It also can decrease ambiguity in cases with flow reversal such as subclavian steal (Fig. 4-7). CEMRA is not used for the routine assessment of intracranial vessels because of problems produced by venous contamination and enhancing normal (sinus mucosa) and pathologic tissues (e.g., brain tumors).


MRA is a good tool for the noninvasive evaluation of the extracranial vasculature for the presence of a hemodynamically significant lesion of the carotid arteries, dissection of the vertebral and carotid arteries, extracranial traumatic fistula, extracranial vasculitis such as giant cell arteritis, or congenital abnormalities of the vessels such as fibromuscular disease. Because it is noninvasive and does not utilize ionizing radiation, it is an excellent screening test for cervical vascular disease. Although noncontrast MRA is simple to perform, in clinical practice CEMRA is now routinely used in the outpatient assessment of the cervical vasculature. In the evaluation of acute infarction it is more common to perform noncontrast MRA of the extracranial and intracranial vessels. This allows for a good global assessment of the vasculature. Limitations of MRA in assessment of patients presenting with “stroke” include motion degradation in ill or uncooperative patients, limited ability to differentiate extremely slow flow (e.g., the “string sign” of long segment internal carotid narrowing due to tandem lesions) from occlusion, and susceptibility artifacts caused by atherosclerotic calcification (typically at the cervical carotid bifurcation and within the cavernous carotid artery) and air-bone interfaces (in the petrous segments of the internal carotid arteries). Cervical MRA tends to overestimate moderate stenosis, in particular if only unenhanced 2D TOF methods are used. Thus, apparent severe stenosis (>85%) may actually be moderate (~50%). The limitations of noncontrast MRA can be overcome in most cases by careful assessment of MRA source images and routine MRI.


Intracranial MRA can be used to reliably detect proximal stenosis and occlusion as well as vasculopathy (at 3T). MRA has been shown to accurately detect aneurysms (90% accuracy for aneurysms >3 mm). It is therefore useful as a screening tool for asymptomatic patients with a risk of intracranial aneurysm (e.g., patients with polycystic kidney disease or individuals with a first-degree relative with a history of ruptured aneurysm). It can also be used to follow patients with known nonruptured aneurysms and patients who have undergone endovascular coiling of aneurysms. In the workup of patients with known or suspected SAH, CTA is preferred. CTA acquisition is faster and provides more precise anatomic detail on aneurysm morphology and relationship to parent vessels. Although MRA may easily detect arteriovenous malformations (AVM), the superimposition of feeding arteries and draining veins makes assessment of this lesion of limited value. 4D CTA and MRA, in which a time element is superimposed to show inflow and outflow, may solve some of the ambiguities around AVMs and fistulas.


MRA images, particularly the extracranial portion of the examination, are challenging to interpret. Source image should always be evaluated with care. The cross-sectional area of the common carotid bifurcation and proximal internal carotid arteries should be determined (in particular on 3D images) because this can provide the most accurate assessment of presence and degree of stenosis. The intracranial circulation should be looked at on source images as well. Source images allow for detection of susceptibility artifacts (see above) and for assessment of cross-sectional luminal narrowing. Dissections are best demonstrated on these images (in combination with T1- and T2-weighted brain or neck images) because of the ability to differentiate the luminal narrowing from the vessel wall thickening and for the detection of false lumens and webs. Careful evaluation of the common locations of aneurysms (e.g., anterior communicating artery, posterior communicating origin from the internal carotid artery, MCA trifurcation) is highly recommended in all cases. Isolated MIPs of each vessel should be performed and evaluated in multiple projections to eliminate the effects of arterial overlap. MRA (and for that matter CTA) interpretation has been markedly facilitated by the interpretation of images on PACS workstations.


Computed tomographic angiography (Fig. 4-8) has emerged as an alternative to MRA for imaging both the extracranial and intracranial blood vessels with the development of multirow detector scanners. Current 16- to 64-row scanners can provide excellent visualization of extracranial and intracranial vessels without venous contamination (assuming accurate timing of contrast bolus injection, which is frequently a BIG assumption). New 320-row detector scanners can acquire data from the entire brain simultaneously and therefore, with multiple acquisitions, produce time-resolved angiographic studies that mimic catheter angiography in their appearance. CTA requires the placement of a catheter, usually in the antecubital vein, with rapid injection of approximately 50 to 125 mL of iodinated contrast material. After a short delay following contrast injection, imaging commences and a 3D data set is acquired. CT advances have resulted in thinner images, improving resolution. Computer postprocessing is necessary for MIP images and for excluding the bony base of the skull structures. In the past postprocessing was a relatively time-consuming, labor-intensive task requiring knowledge of anatomy and the ability to use 3D workstations. As 3D workstations have been improved, the task of reconstructing CTA studies has become easier and can now be done (at least preliminarily) by technologists at the CT scanner. It has gained immense popularity in the workup of hyperacute infarction when used in combination with CT and CT perfusion because of availability and ease and speed of data acquisition. It is superior to MRA for detecting and characterizing smaller aneurysms at the cost of radiation and iodinated contrast dye. CT and CTA are typically performed at initial presentation of suspected aneurysmal SAH (aSAH) on the ED scanner because all data can be collected in less than 2 minutes.


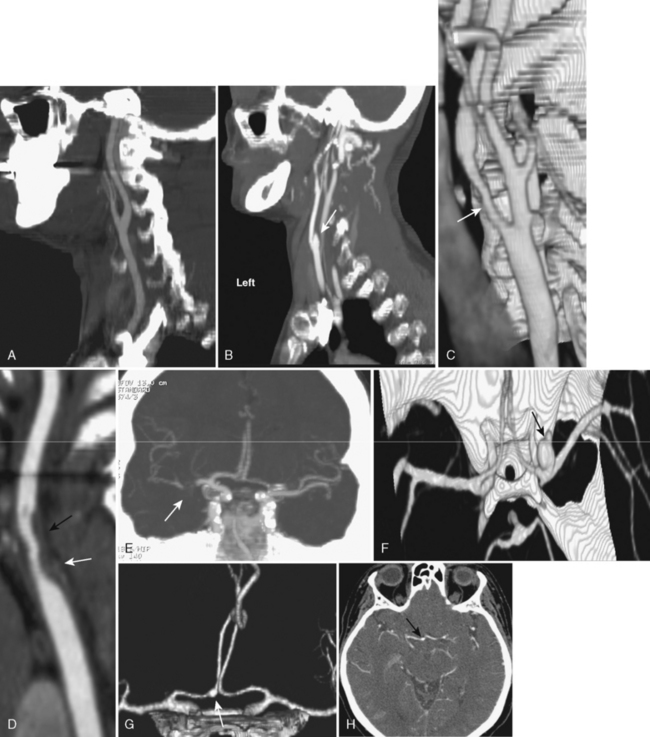
Computed tomography angiography has several advantages when compared to MRA. Because the images are not motion-sensitive, CTA allows for accurate assessment of extracranial stenosis (see Fig. 4-8C and D). Workstations often have software that allows for measurement of cross-sectional areas at multiple sites. Calcification does not cause the same artifacts that are seen on MR, and extremely slow flow and tandem lesions are more reliably detected on CTA than MRA. Intracranial embolic occlusion is more easily seen, and focal clot within proximal intracranial vessels may be directly visualized (see Fig. 4-8E). CTA has better spatial resolution than MRA; therefore, identification of aneurysm morphology (including overall size and neck morphology) and relationship to adjacent and parent vessels is better (see Fig. 4-8F). The superb quality of CTA has prompted many neurosurgeons to operate directly on the basis of CTA findings, reserving catheter angiography for those cases where CTA findings are inconclusive or when endovascular treatment is to be performed. Interestingly, over the past few years there has been a movement back to performing catheter angiography even when surgery is the treatment of choice. This may reflect improvements in digital sub- traction conventional angiography equipment with ability to perform rotational (3D) images during arterial contrast injections. Although MRA is more accurate for the assessment of aneurysms treated with endovascular coils, CTA has proven to be more accurate for the assessment of aneurysms treated with surgical clipping.


The limitations of CTA include: (1) risks of intravenous iodinated contrast injection; (2) exposure to radiation; (3) obscuration of vessels at the base of the skull due to bone and contrast in the cavernous sinus; (5) obscuration of aneurysms by extensive SAH; (6) extensive atherosclerotic calcifications in the walls of the vessels; (7) atherosclerotic calcifications and normal osseous structures, such as the anterior clinoid process, obscuring the underlying vessel and less frequently mimicking the appearance of an aneurysm on CTA surface renditions (see Fig. 4-8G and H); (8) the operator-dependent nature of the 3D reconstruction process. Calcification can be a problem with CTA, MRA, and even catheter angiography. With moderate calcification CTA is superior to MRA for assessing degree of stenosis, but with heavy calcification the lumen may be obscured on CTA but visible on MRA.


Detection of aneurysms near the skull base (e.g., cavern- ous aneurysms) is limited by bony artifact. Although workstations have improved the ability to detect aneurysms near the skull base, in particular within and adjacent to the cavernous sinus, skill at image manipulation is often required to make aneurysms in this region visible. Depending on how one “windows and levels” the source images, small aneurysms may be missed or infundi-bular widening of the origins of small vessels may be mistaken for aneurysms.


Arterial catheter angiography (Fig. 4-9) is the definitive imaging modality for vascular lesions of the brain and great vessels of the neck but has been relegated to a secondary role in the diagnosis of stroke. Patients are referred for angiography for the following reasons: (1) if the MRA, CTA, or carotid ultrasound are equivo- cal; (2) if MRA is contraindicated (e.g., in patients with pacemakers); (3) if cardiac output is too low to produce a diagnostic CTA; (4) to evaluate complex aneurysms or vascular malformations responsible for an intracranial hemorrhage; and (5) for the evalua-tion of vasculitis. The advent of rotational 3D digital subtraction angiography has made it possible to combine the advantages of selective arterial injection of contrast with the 3D imaging intrinsic to CTA.


For assessment of AVMs and fistulas selective catheter angiography is necessary to obtain time-resolved images that separate arterial and venous components of the malformations. Although high-field MRA and CTA may suggest the correct diagnosis of vasculitis, the absence of evidence of vasculopathy does not exclude this diagnosis. Because the treatment of this disorder is not without risk, catheter angiography may be performed to confirm or exclude the diagnosis and may be used to determine the best site for biopsy if necessary. Angiography is a safe (but not harmless) study and in many situations provides crucial information. The incidence of all complications for femoral artery catheterizations is approximately 8.5% with the range of permanent complications (the most significant of which is stroke) from 0.1% to 0.33%, a 2.6% incidence of transient complications, and a 4.9% incidence of local complications.


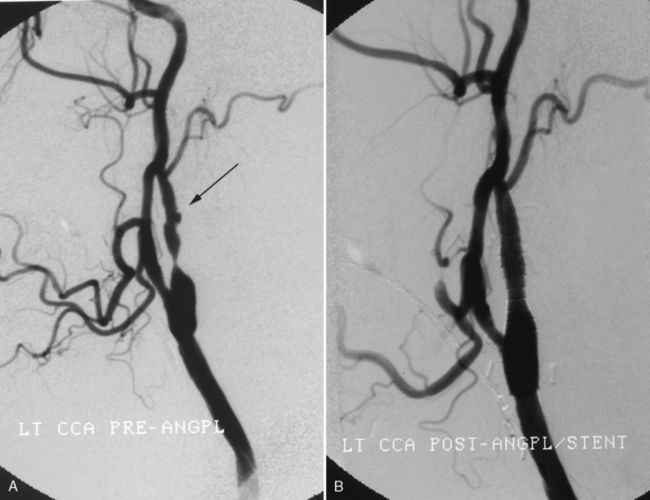
In individuals with acute or chronic ischemic disease angiography is used in selective cases, in particular if endovascular intervention is contemplated. It is an excellent albeit invasive method for determining whether a lesion is hemodynamically significant in the carotid circulation (Box 4-3). Assessment of collateral circulation distal to a stenosis or occlusion is most easily determined with catheter angiography, where serial images show the presence, source, and extent of collateral supply to the brain.


Detection of ulcerated plaques is more accurate with catheter than noninvasive angiography. However, on all types of angiographic examinations it is difficult to distinguish ulceration from irregularity. The most reliable angiographic sign is the penetrating niche, but depression between adjacent plaques and intraplaque hemorrhage may produce a similar appearance (see Fig. 4-9). Luminal bulging secondary to destruction of the media with an intact intima can also appear as an ulcer. One should appreciate that the association of ulcer and stroke is also controversial. Many asymptomatic plaques are ulcerated and many symptomatic plaques are not. Generally, however, ulceration is frequently found on the symptomatic side in association with significant stenosis. High-resolution surface coil-enhanced MR imaging is an excellent way to evaluate ulcerated plaque but requires hands-on study to optimize planes of section and flow suppression. The best approach presently is for the radiologist to describe the plaque as smooth or irregular, and if an undermined niche is present, the term ulceration can be used. It is in the province of the physician caring for the patient to base therapy on the severity of findings and on the patient’s symptoms. No studies have documented any greater risk of angiography during an acute stroke. The vascular supply to the symptomatic region should be the first order of business. What is the current role of angiography in hyperacute stroke? It is primarily used in an interventional mode for thrombolysis and stenting.


Perfusion


Perfusion imaging aims to characterize microscopic flow at the capillary level. The key concept to remember in perfusion imaging is the central volume principle:


image


Cerebral blood flow is determined by the ratio of cerebral blood volume (CBV) divided by the mean transit time (MTT). The CBF of the normal brain ranges between 45 and 110 mL/100 g of tissue/min. Cerebral oligemia (about 20 to 40 mL/100 g/min) is defined as underperfused asymptomatic region of brain that will recover spontaneously, whereas an ischemic hypoperfused brain is symptomatic and at risk to develop irreversible infarct without revascularization. The ischemic threshold identified in animal experiments when there is cessation of action potential generation occurs around 20 mL/100 g/min and the infarction threshold, associated with irreversible neuronal damage, is at approximately 10 mL/100 g/min. Therefore, ultimately, it is CBF that determines whether tissue will live or die, but changes in MTT and CBV reflect the pathophysiologic processes that precede and then determine when CBF decreases to nonviable levels. The initial event is an increase in MTT due to an occlusion or stenosis. MTT will be determined by the site of occlusion or stenosis and the presence and type of collateral supply to the affected brain. The autoregulatory response of the brain is vasodilation of the vascular bed distal to the occlusion or stenosis and increased oxygen extraction from the blood. Vasodilation increases CBV; therefore, initially CBF is maintained or at least does not decrease to the level where neuronal death occurs. However, once maximal vasodilation is achieved any further increases in MTT (due to progressive occlusion, new embolization, or decrease in systemic blood pressure) will result in decrease in central perfusion pressure, collapse of the vascular bed, and decrease in CBV and consequent decrease in CBF.


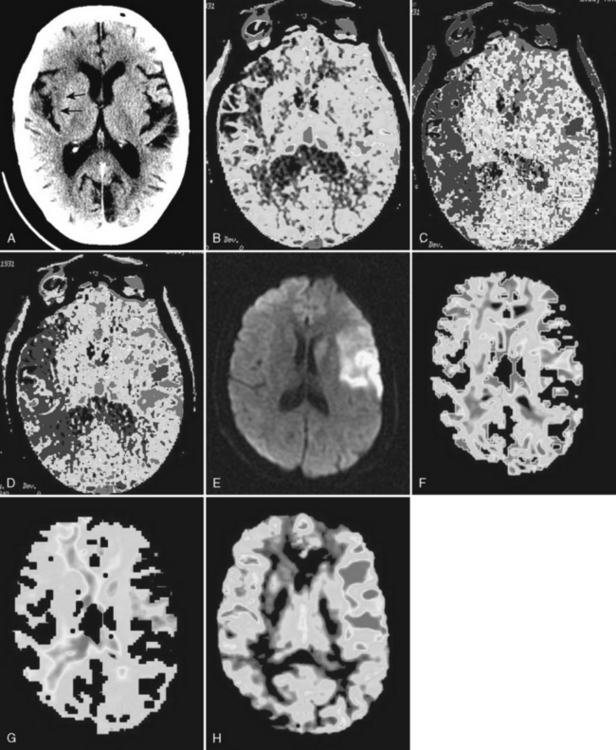
Perfusion imaging can be performed in a number of ways, but by far the most common technique in clinical practice involves an intravenous injection of contrast material that does not traverse the blood-brain barrier. Rapid sequential imaging (images every 15 sec) of all or part of the brain allows the visualization of the effect of the contrast agent as it traverses the vascular system. This “bolus tracking” technique is used for both MR perfusion (MRP) and CT perfusion (CTP). In CTP the density of the brain increases while the iodinated contrast agent passes the vascular supply; with MRP the intensity of the brain decreases because the paramagnetic gadolinium agent causes T2-shortening (dynamic susceptibility imaging). In both cases one obtains direct measurement of CBV (it is the area under the curve of the density/intensity change). The time that it takes the contrast to traverse the brain is the MTT; therefore, the CBF can be calculated using the central volume principle. However, to precisely measure CBV and MTT it is necessary to eliminate the contribution of contrast within small arterioles and venules. This requires mathematical “deconvolution” of the data. This is easy with CTA, where data from the arterial input and venous output (obtained by measuring the changes in density within large arteries such as the anterior cerebral arteries and large veins such as the superior sagittal sinus) can be obtained. With MR, this is more difficult because of the contribution of flow effects within large vessels. Therefore, the values obtained from CTA are precise mathematical measures of the three perfusion parameters, whereas those obtained with MR perfusion are relative values (e.g., rCBV, rCBF, rMTT). With both CTA and MRA parametric MTT, CBV, and CBF maps are generated and evaluated qualitatively. Measurement of absolute values is only possible with CTP. The parametric maps provide somewhat different information, and each has its advantages and limitations. Because the initial event in an infarct is increase in MTT, the MTT maps are the most sensitive to early ischemic changes, but because not all areas of elevated MTT go on to infarction MTT maps tend to overestimate final infarct volume. What measure best correlates with the size of the final infarct? It depends on many factors, including what literature you read. CBV maps appear to have the best correlation with the ultimate infarct volume. However, this is controversial, with some reports indicating that rCBV underestimated final infarct volume whereas rCBF overestimates it. Such differences may, in part, be related to when the measurement is made (12 hours versus 24 hours). Perfusion imaging is critical to determining whether or not there is salvageable brain that can be protected by use of intravenous or intra-arterial thrombolytic therapy (tPA), medical therapy, or mechanical clot removal devices (MERCI and Penumbra). All of these treatments are associated with an increased risk of intracranial hemorrhage; therefore, treatment should be reserved for individuals who can benefit from recanalization. Individuals in whom the area of infarction corresponds to the area of abnormal perfusion should not be treated regardless of other factors (time from onset of symptoms, extent of infarcted brain) since there is no brain to protect. On the other hand in patients where brain at risk is greater than the already infarcted brain by more than 20%, treatment is likely to result in improved outcome. The brain at risk is described as the ischemic penumbra. On MR, the penumbra is the brain tissue surrounding the core diffusion-“positive” (hyperintense) infarcted brain that has normal diffusion but abnormal relative perfusion (diffusion/perfusion mismatch). On CT there is no easy direct way to measure the extent of the already infarcted brain; therefore, it is necessary to use quantitative measures of perfusion to define the predicted infarcted brain (<10 mL/100 g/min) and the penumbra (10–30 mL/100 g/min) (Figs. 4-10 and 4-11).


< div class='tao-gold-member'>

Stay updated, free articles. Join our Telegram channel

Jul 22, 2016 | Posted by in NEUROLOGY | Comments Off on Vascular Diseases of the Brain

Full access? Get Clinical Tree

Get Clinical Tree app for offline access