CHAPTER 62 Statistics in Psychiatric Research
THREE CLASSES OF STATISTICS IN PSYCHIATRIC RESEARCH
Table 62-1 illustrates the characteristics of each class, as well as the order in which the classes must be considered, since each successive class rests on the foundation of the preceding class.
Table 62-1 The Three Classes of Statistics Used in Psychiatric Research (in Order of Applicability)
| Class of Statistic | Purpose | Examples |
|---|---|---|
| Psychometric Statistics | ||
| Descriptive Statistics | Statistics used to summarize the scores of many subjects in a single count or average to describe the group as a whole. After descriptive statistics have been computed for one or more samples, they can then be used to compute inferential statistics to attempt to generalize these results to the larger population from which these samples were drawn. | |
| Inferential Statistics | Statistics computed to compute probability estimates used to generalize descriptive statistics to the larger population from which the samples were drawn. |
Concrete Examples of the Three Classes of Statistics in a Research Article
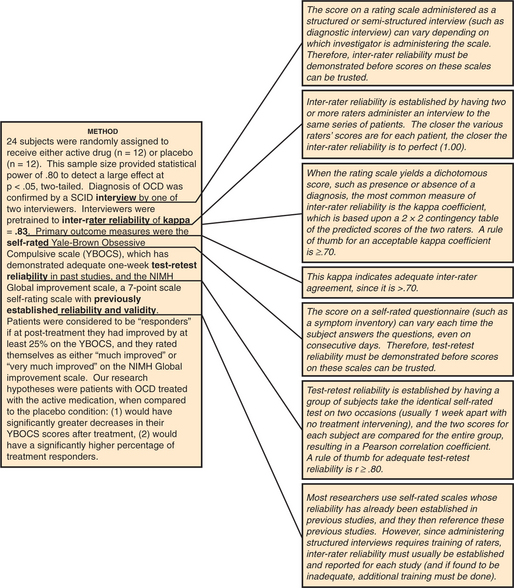
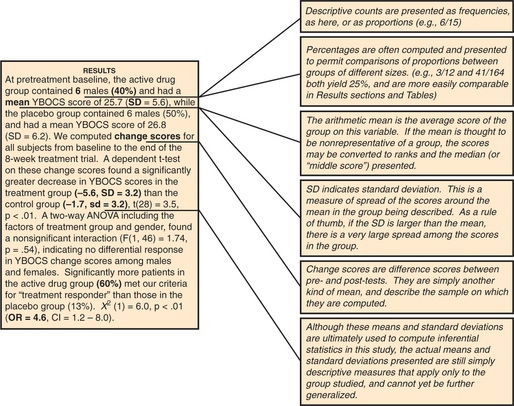
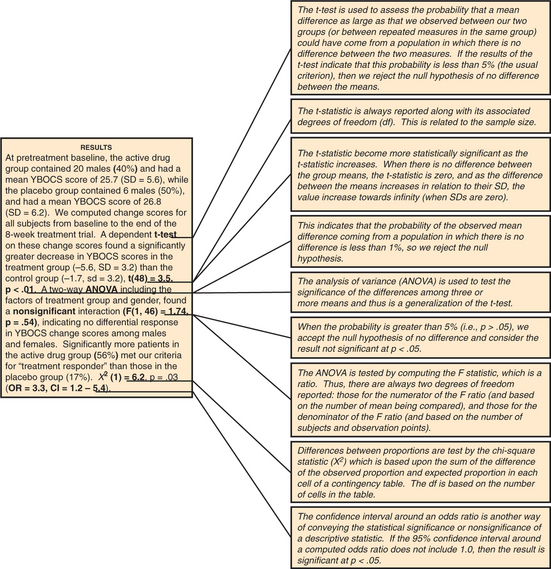
Figures 62-1 through 62-3 contain the annotated Method and Results sections for this fictional study, showing how the various psychometric statistics are presented in the Method section, while descriptive statistics are presented in the Method and Results sections, and inferential statistics are presented in the Results section (for definitions of terms used in these figures, refer to the section on statistical terms and their definitions).
Experiment-wise Error Rate
Researchers should test only a few carefully selected hypotheses (specified before collecting their data!) if their obtained p-values are to have any meaning. The more statistical tests you perform, the greater the chance of finding at least one significant by chance alone. Table 62-2 illustrates this phenomenon.
Table 62-2 Experiment-wise Error: Did the Researcher Find a Single Result Significant Solely by Chance?
| Number of Statistical Tests Performed at p < .05 | Probability of at Least One False-Positive Finding* |
|---|---|
| 1 | .05 |
| 2 | .09 |
| 3 | .14 |
| 4 | .18 |
| 5 | .22 |
| 6 | .26 |
| 7 | .30 |
| 8 | .33 |
| 9 | .36 |
| 10 | .41 |
| 15 | .53 |
| 20 | .64 |
| 30 | .78 |
| 40 | .87 |
| 50 | .92 |
One should not be impressed by a researcher who conducts eight t-tests, finds one significant at p < .05, and proceeds to interpret the findings as confirming his theory. Table 62-2 shows us that with eight statistical tests at p < .05, the researcher had a 33% chance of finding at least one result significant by chance alone.
Selecting an Appropriate Statistical Method
The two key determinants in choosing a statistical method are (1) your research goal, and (2) the level of measurement of your outcome (or dependent) variable(s). Table 62-3 illustrates the key characteristics of the various levels of measurement and provides examples of each.
Table 62-3 Levels of Measurement of Variables
| Level of Measurement | Description of Level | Examples |
|---|---|---|
| Continuous (also known as interval or ratio) | A scale on which there are approximately equal intervals between scores | |
| Ordinal (also known as ranks) | A scale in which scores are arranged in order, but intervals between scores may not be equal | |
| Nominal (also known as categorical) | Scores are simply names for different groups, but the scores do not imply magnitude. Often used to define groups based on experimental treatment or diagnosis | |
| Dichotomous (also known as binary) | A special case of a nominal variable in which there are only two possible values |
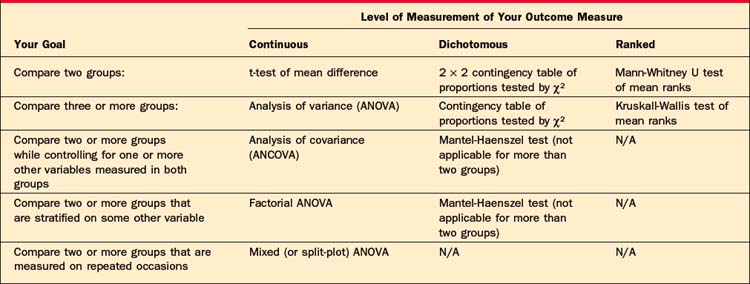
Once the level of measurement of your outcome variable has been determined, you will decide whether your research question will require you to compare two or more different groups of subjects, or to compare variables within a single group of subjects. Tables 62-4 and 62-5 will help you choose the appropriate statistical method once you have made these decisions. (Note that these tables consider only univariate statistical tests; multivariate tests are beyond the scope of this chapter.)
Table 62-4 Choosing an Appropriate Statistical Test to Compare Two or More Groups, Based on Your Research Goal, and the Level of Measurement of Your Outcome Measure