10
CHAPTER
![]()
EEG Instrumentation
Saurabh R. Sinha
EEG involves the measurement of electrical fields generated by the activity of neurons and, possibly, glial cells in the brain. Electrodes are placed on the scalp and the EEG equipment is used to filter, amplify, store, and display the electrical potentials. The proper interpretation of EEG results requires an understanding of the generators of the electrical fields as well as the properties and limitations of the measurement equipment and procedures. In this chapter, basic information about the generators of cerebral potentials, basics of EEG instrumentation, and recording procedures will be reviewed.
CEREBRAL GENERATORS OF EEG POTENTIALS
EEG measures neuronal activity at a relatively large scale. It represents the summated activity generated by large groups of neurons (105 or more). Due to the need for summation of activity over a large population, the main source of EEG potentials are cortical neurons – their arrangement in layers with similar orientations (aligned with their long axis perpendicular to the cortical surface) allows for better summation of activity compared to other types of neurons with a more random orientation. For neurons with a more random orientation, even if their activity is synchronized, the activity may actually partially cancel each other out. In addition to spatial orientation of the neurons involved, the temporal scale of the activity is also important. For example, the duration of a neuronal action potential is approximately 1 msec. For summation to occur across a group of neurons, their firing would have to be very precisely synchronized (at the sub-millisecond level). This cannot occur over a large population of neurons. Thus, even though action potentials are of relatively high amplitude (~100 mV), they make very little contribution to the EEG signal. Instead, activities of longer durations are the main contributors to the EEG signal. These include both excitatory postsynaptic potentials (EPSPs), mainly mediated by the neurotransmitter glutamate, and inhibitory postsynaptic potentials (IPSPs), mainly mediated by the neurotransmitter gamma-aminobutyric acid (GABA). Although postsynaptic potentials have much smaller amplitudes than action potentials (on the order of millivolts to tens of millivolts), their longer durations (tens of milliseconds and longer) lead to better summation. Some other activities that may contribute to the EEG signal include the slow afterhyperpolarization seen in neurons after a burst of action potentials, and even slower changes in glial membrane potentials that occur in response to changes in extracellular ionic concentrations, especially potassium (K+) ions.
The summation of activity is further complicated by the fact that it reflects the flow of current in the extracellular space. Neuronal activity results in the creation of current sources and current sinks, loops of current, and dipoles of electrical potential (a source of electric fields, idealized as a rod connecting a positive and a negative charge) (Figure 10.1). For example, an EPSP occurring in the dendrites of a pyramidal cell results from the influx of cations into the dendrites from the extracellular space, resulting in a current sink. To compensate, current leaves the neurons at other sites, for example, the soma, creating a current source. The circuit is completed by the flow of current in the extracellular space from the current source (soma) to the current sink (dendrites). Thus, an EPSP in the dendrites of a pyramidal cell creates a dipole that is positive at the soma and negative at the dendrites. On the other hand, an IPSP near the soma of a pyramidal cell results from the inflow of anions at the soma, creating a current source (inflow of anions is electrically the same as outflow of cations). Thus, it can be seen that an IPSP at the soma also results in a dipole that is positive at the soma and negative in the dendrites. Similarly, an EPSP near the soma or an IPSP near the dendrites will both result in a dipole that is negative at the soma and positive in the dendrites.
Another determinant of how cerebral activity will be reflected in the EEG is the location and orientation of the activity with respect to the recording electrode. If the dipole representing the cerebral activity is placed inside a sphere (to represent the head), the voltage at each point on the surface of the sphere will be a function of the distance from that point to the positive charge and the negative charge: the charge that is closer will have the bigger effect. Thus, points closer to the positive charge will have a relatively more positive voltage and points closer to the negative charge will have a relatively more negative voltage; points on the sphere that are equidistant from both charges will have zero voltage. Thus, for a radial dipole (one where the dipole is oriented radially out from the center of the sphere out), an electrode place directly above the dipole will have the maximum voltage that can be recorded (Figure 10.2). For a tangential dipole (one where the dipole is oriented parallel or tangential to the surface of the sphere), an electrode placed directly above the dipole will not record any voltage. These factors combined with the convoluted structure of the cerebral cortex, with its many sulci and gyri with different orientations, lead to a very complex relationship between cerebral activity and the recorded EEG signal. All of these issues make it very difficult to draw accurate conclusions about the nature of the underlying cerebral activity based on the EEG signal alone.
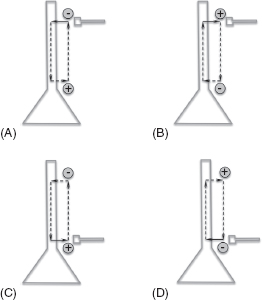
FIGURE 10.1 Dipoles set up by excitatory and inhibitory inputs applied to different parts of a neuron. (A) Excitatory input in the dendrites sets up a dipole in the extracellular space that is positive at the soma and negative in the dendrites. (B) Inhibitory input in the dendrites sets up a dipole that is positive in the dendrites and negative at the soma. (C) Inhibitory input at the soma produces a dipole that is positive at the soma and negative in dendrite. (D) Excitatory input at the soma produces a dipole that is positive in the dendrites and negative at the soma.
![]()
EEG AMPLIFIERS
The voltages created by cerebral activity when measured with electrodes placed on the scalp are on the order of 10 to 100 mV. When measured directly at the cortical surface, these voltages are on the order of 10 mV. To accurately measure such small potentials, the EEG machine must have several components (Figure 10.3). These include electrodes placed on the scalp or cortex to sense the voltage and a jack box to connect wires from the electrodes to the EEG equipment. In older, analog EEG equipment, a montage selector is present to select which pair of electrodes is connected to a particular channel of the EEG amplifier. In digital EEG equipment, each electrode is recorded with respect to a common reference electrode; pairs of recorded channels are combined in the software to produce the desired montage. The activity from each electrode is then filtered (to remove unwanted activity and noise) and amplified (to increase the size of the activity). In analog machines, this signal is then translated into the deflection of a pen on a scrolling piece of paper. The paper speed determines how many seconds of EEG data will be plotted on each page – typical paper speeds are 30 mm/sec for EEG, although slower paper speeds like 10 mm/sec are used for neonatal recordings and for some longer studies. In digital machines, the activity is discretized (broken up into pieces) and digitized (converted to a numerical value) via an analog-to-digital (A/D) converter. The data are then stored on some form of permanent storage like a disk drive. The collected data can then be filtered and reformatted/combined in different ways and sent to a computer monitor for display.
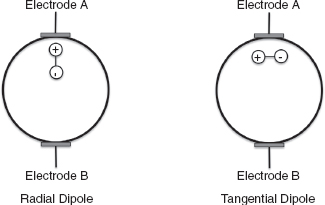
FIGURE 10.2 For a radial dipole, as illustrated on the left, Electrode A will sense a relatively large positive potential, whereas Electrode B will sense a relatively small negative potential. This is due to its greater distance from the dipole. For a tangential dipole, as illustrated on the right, both electrodes will sense a neutral or zero voltage because both ends of the dipole are equidistant from the electrode.
![]()
Electrodes
Various types of electrodes are used to record EEG signals. They are made of a conducting material, commonly metals with some underlying conductive paste or gel to improve contact with the skin. An ideal electrode should transduce the voltage underneath it without altering it in any way. However, real electrodes have limits on their performance, including the frequency range over which they are accurate and the buildup of charge on the electrode (polarization). Gold or gold-plated electrodes have commonly been used for scalp EEG recording, although electrodes made of conductive plastic or other disposable materials are gaining popularity due to concerns for infection and a desire for compatibility with imaging (CT and MRI). Subdermal needles and wires are also sometimes used for EEG recording. The earliest EEG electrodes were made from silver with a coating of AgCl, which offers a near-ideal combination of frequency response and lack of polarization; however, they are difficult to make and maintain and are no longer commonly used. For directly recording from the cortex, discs made out of metal are imbedded in plastic sheets with some of the metal exposed. For implanted electrodes, the discs are normally made from noble metals like platinum or platinum/iridium alloys; for acute use (ie, in the operating room only), stainless steel discs are sometimes used.
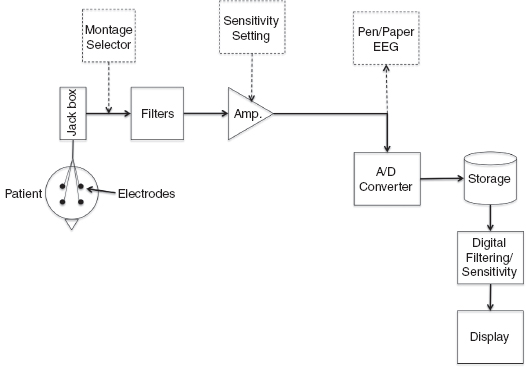
FIGURE 10.3 Schematic of EEG Amplifiers. Electrodes are placed on the patient’s scalp and connected to a jack box. This is then connected to filters and amplifiers to condition and amplify the signal. The objects shown in dashed boxes are components of analog EEG equipment (montage selector, sensitivity settings and pen/paper EEG). Instead of pen/paper, for digital EEG equipment, the signal is digitized via an A/D converter, stored, and then reprocessed, if desired, prior to display on a monitor.
![]()
Electrode placement is important to understand. To capture the variation in cerebral activity in different parts of the brain, the EEG is recorded simultaneously from multiple locations on the head. Standardization of electrode locations is important for reproducibility of EEG signal across repeated studies on the same patient and across patients. The committee of the International Federation of Societies for Electroencephalography and Clinical Neurophysiology (IFSECN) recommends a specific system of electrode placement for use in all laboratories (Figure 10.4A) (1). This system is known as the International 10-20 system. Specific measurements are made based on bony landmarks (nasion, inion, and preauricular point) to determine the placement of electrodes. From these landmarks, specific measurements are made and then 10% and 20% of a specified distance is used as the interelectrode interval. Uniform interelectrode distances and symmetric placement of electrodes over the left and right hemispheres are important for EEG interpretation.
The American Clinical Neurophysiology Society (ACNS) has recommended using a minimum of 21 electrodes from the International 10-20 system. Each electrode is named by a letter/number combination. The letter designates the approximate anatomical location (“F” for frontal, “T” for temporal, “Fp” for frontopolar, “C” for central, “P” for parietal, and “O” for occipital). Odd-numbered electrodes are placed over the left side of the head and even-numbered electrodes are placed over the right. In general, smaller numbers are closer to the midline (with “z” indicating zero being in the midline) and larger numbers are more lateral.
In 1991, the American Electroencephalographic Society added nomenclature guidelines for 75 electrode positions along five anteroposterior planes, lateral to the midline chain of 11 specific sites (Figure 10.4B). In addition, there are eight coronal chains (four anterior and four posterior to the chain of 13 electrode sites between the earlobe electrodes along the midline through the Cz electrode). Several electrodes are named differently in the 10–20 system and the extended nomenclature (the 10% or 10-10 system). Electrodes T3 and T4 in the 10-20 system are referred to as T7 and T8 in the expanded system, and T5 and T6 are referred to as P7 and P8. For infants, fewer electrodes are used and the precise number is somewhat variable from laboratory to laboratory. The ACNS has suggested using at minimum Fp1, Fp2, C3, Cz, C4, T3, T4, O1, O2, A1, and A2 (4).
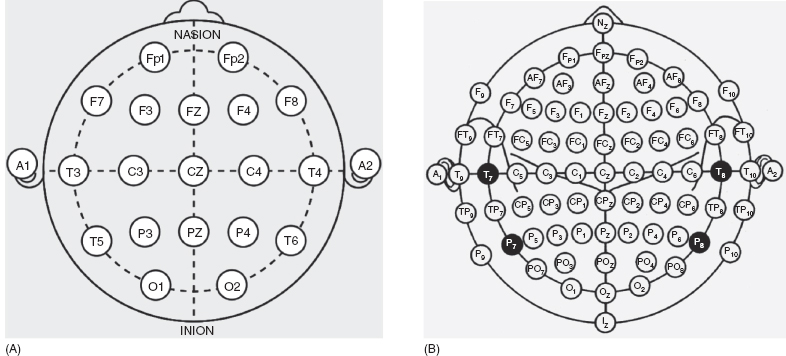
FIGURE 10.4 (A) International 10-20 system for electrode placement. (B) 10-10 or 10% system for electrode placement. Electrodes in black have different names from the corresponding electrodes of the International 10-20 system (T7 = T3; T8 = T4; P7 = T5; P8 = T6).
![]()
Filters
The biological signal must be filtered to optimize recording quality. Filtering refers to selectively removing activity within a certain frequency range from the overall signal. The ultimate goal of filtering is to remove activity that is not of interest. For example, very slow drifts in voltage-related sweating or changes in temperature or very fast activity related to muscle twitches and electrical interference. A secondary objective is to remove activity that may compromise performance of the EEG equipment. For example, very slow signals are distorted by commonly used electrodes, leading to artifacts. Similarly, very fast signals may exceed the maximum speed of pen deflection for analog equipment or sampling/display for digital equipment (discussed further). Taking these factors into account, scalp EEG recordings have traditionally been restricted to the frequency range of 0.5 to 70 Hz; intracranial recordings usually extend up to 200 Hz or higher. There is growing interest in recording both scalp and intracranial EEG at much higher frequencies (approaching 1000 Hz).
Most EEG equipment manufacturers describe filters in terms of the cutoff frequency, fc; this is the frequency at which the filter attenuates the power applied to the input by 50%. In terms of voltage, this equates to a drop of 29.3% or –3 dB. Thus, for a low-pass or high-frequency filter, at fc, the output voltage will be 70% of the input voltage with greater attenuation above that frequency and much less or no attenuation below that frequency. For high-pass or low-frequency filters, frequencies below fc are attenuated by greater than 70% and frequencies above fc are attenuated much less. Some manufacturers describe high-pass filters in terms of time constants (t):
![]()
Thus, a time constant of 0.16 sec is equivalent to an fc of 1 Hz. Commonly used filter settings include low-frequency filters (high-pass filters) of 0.1 to 1 Hz and high-frequency filters (low-pass filters) of 50 to 100 Hz. Another commonly used filter is the notch filter, which selectively attenuates the signals at/around its characteristic frequency. This is used to selectively remove interference from electrical equipment connected to power lines (60 Hz in the United States and 50 Hz in most other countries).
Filters attenuate signals of a given frequency regardless of their source; thus, they can distort the activity of interest just as easily as filtering out noise. Beyond attenuating selected frequencies, filters also introduce subtle changes in the timing of the recorded signal. High-frequency filters will introduce a small time lag: the activity will appear to occur at a slightly later time than it actually did. Low-frequency filters will introduce a small time lead: the activity will appear to occur at a slightly earlier time than it actually did. Thus, filters have the potential to distort signals in unintended ways, including filtering out activity of interest and distorting artifactual activity so that it appears to be real. If filtering is differentially applied to different channels of an EEG, it may even distort the temporal relationships in the activity recorded by different channels.
Differential Amplifier
Due to the low amplitudes of the EEG signal, it is necessary to amplify the potential of interest while ideally rejecting or reducing voltages from other sources, such as nearby electrical equipment and other biological sources like the heart. All EEG amplifiers are differential amplifiers. A differential amplifier takes two input voltages and produces an output that is an amplified version of the difference between the two inputs (Figure 10.5). The amplification factor or gain (A) of most EEG amplifiers is on the order of 1×10⁵ to 1×10⁶ (adjustable); thus, an activity of 1 mV will be amplified at the output to 100 mV to 1 V. An ideal differential amplifier produces an output of 0 V when the two inputs are equal; however, real-world amplifiers have a nonzero output even when the exact same voltage is applied to both inputs. Thus, in addition to its amplification factor (A), a differential amplifier is characterized by its common-mode rejection ratio (CMRR):
![]()
Both amplification and CMMRs are usually expressed in decibels (dB):
A(dB) = 20 log10 (A).
Related posts:

Stay updated, free articles. Join our Telegram channel

Full access? Get Clinical Tree


