(1)
where E is the expected values operator and τ is the offset, or time lag.
To define a network, we define each microelectrode in the MEA as a node, while any connection between them is an edge. We determine the cross correlation function between each pair of nodes, then take the maximum correlation value and measure the lag at which this maximum occurs. The maximum value determines the strength of the connection between the two nodes, while the time lag informs the direction. For example, a lag of 0 would indicate complete synchrony, while a negative lag of the cross correlation peak of signal X compared to signal Y would indicate that Y precedes X.
Coherence
Coherence characterizes correlations within the frequency domain rather than the time domain. The power spectra of the two signals are obtained via Fourier transform. The cross spectrum Sxy, the Fourier transform of cross correlation, is then calculated and normalized by the products of the autospectra of each signal, Sxx and Syy, in order to obtain a coherence value C between 0 and 1 for each frequency ω:

(2)
The phase coherence ϕ can also be determined by taking the inverse tangent of the real and imaginary components of the cross spectrum at each frequency ω:

(3)
The coherence in the frequency band of interest is then averaged to determine the strength of the edge between the pair of nodes. The average phase coherence in the frequency band of interest is then used to define the direction.
Granger Causality
Granger causality is a concept originally formulated by Norbert Wiener, but first developed in economics [20]. The logic behind it posits that if one signal causes another, knowledge of the causal signal should improve our ability to predict the second signal. Formally, this is calculated by building two vector autoregressive models for each pair of signals [21]. The first “reduced” model is created to estimate signal X using the past of signal X:

(4)
The coefficients  are calculated along with the residuals, or errors,
  up to a set number of lags, p, known as the model order.
 are calculated along with the residuals, or errors,
  up to a set number of lags, p, known as the model order.
A second autoregression, the “full” model, is then calculated in which the past of signal Y is additionally included in the model:

(5)
If the error in the full model is significantly decreased relative to the error in the reduced model, then signal Y is said to “Granger-cause” signal X. Formally, the Granger causality value F is calculated by taking the log ratio of the residuals variances from each model:

(6)
Additional signals can also be included in both autoregressive models. This is an important distinction from both cross correlation and coherence, which are calculated in an independent fashion for each pair of nodes. This feature of Granger causality may enable us to rule out, for example, whether a third signal Z is affecting some aspect of the behavior of both X and Y in a linked manner, rather than X directly affecting Y or vice versa.
The magnitude of the Granger causality value is meaningful because it increases in proportion to the degree by which error is reduced by in the full model. Thus, when building a network, this magnitude gives us the strength of the edge. Because Granger causality analysis, especially applied to oscillatory signals, tends to result in a large number of bidirectional connections, we can define unidirectional connections by calculating the difference in Granger causality values for each pair of nodes in which the Granger causality in both directions is significant. The larger this difference, the more certain we can be of the directionality.
A few caveats are important to keep in mind. In particular, periodicity, a hallmark of seizure activity, exerts effects on all three measures. Using either the lag (in cross correlation) or the phase coherence is imperfect for determining the directionality of oscillatory signals, especially at higher frequencies. For example, if a sinusoidal signal X is caused by another sinusoid Y, but has a large enough lag or phase relative to Y, then signal X may erroneously appear to precede rather than follow Y as the waveform repeats. As the period of the sinusoids is decreased, the lag necessary for this error to occur becomes smaller and thus more likely. However, the frequencies examined most here (5–8 Hz) are slow enough relative to direct neuronal connections (0–150 ms for monosynaptic AMPA and NMDA connections [22]) that this concern is somewhat mitigated.
Another limitation is that if a signal that independently drives multiple signals on the array is not measured, for example if it lies outside the array, the current analyses may erroneously find a direct connection between the resulting signals. Additionally, if a common reference signal is used, it must be chosen carefully. When a nonzero reference signal is subtracted from each channel, the incorporation of the common elements of the reference signal may induce artificial correlations between channels [23]. In this study, this possibility was minimized by the use of an extracranial reference electrode; because the amplitude of the extracranial EEG is 1–2 orders of magnitude smaller than the signals recorded by the MEA, the influence of the reference on coherence measurements is negligible [24].
A final caveat is that with these techniques, we examine only linear relationships; any nonlinear relationships between nodes would escape our detection methods.
Defining Networks in a Human Seizure
Recordings were obtained from a 96-microelectrode MEA implanted along with subdural ECoG electrodes in a human epilepsy patient. The study was approved by the Institutional Review Board of the Columbia University Medical Center, and informed consent was obtained from the patient prior to participation. (See [25] for additional details on surgical procedures and patient enrollment.) Cross correlation, coherence and Granger causality were applied to a 30-second segment containing a seizure. These analyses were first demonstrated on a subset of six channels, in order to allow for visual comparison of the EEG trace with the networks created (Fig. 11.1a and b). Spectral analysis revealed that the peak frequency of the seizure was 6.6 Hz, in the theta band (5–8 Hz) (Fig. 11.1c).
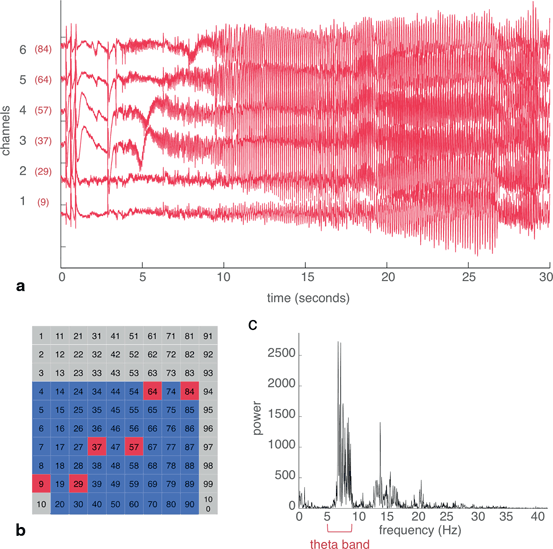

Fig. 11.1
From the MEA recording of a human seizure, a subset of six channels were selected to demonstrate techniques for building networks. a Raw EEG traces of channels 1 through 6. The actual channel numbers, referring to the location on the MEA, are shown in red. b Location of the six channels on the electrode array. Red represents the selected subset of six channels, blue represents other channels with good quality recordings that were used later, and gray refers to channels with artifacts. c Power spectrum of the average signal from the six channels. The theta (5–8 Hz) band contained the peak power of the seizure recording.
As expected, cross correlation of the time domain signals and coherence in the theta band, containing the dominant frequency of the seizure, yielded identically structured networks that exhibited reasonable concordance with visual assessment of the EEG (Fig. 11.2a and c). In this example, cross correlation and coherence pinpoint channels 3 and 4 as the main sources of output, with channels 1 and 2 receiving inputs, and channels 5 and 6 with an intermediate mix of inputs and outputs. Visual inspection of the six channels agrees with this assessment—the seizure begins in channels 3 and 4, spreads to 5 and 6, and finally to 1 and 2.
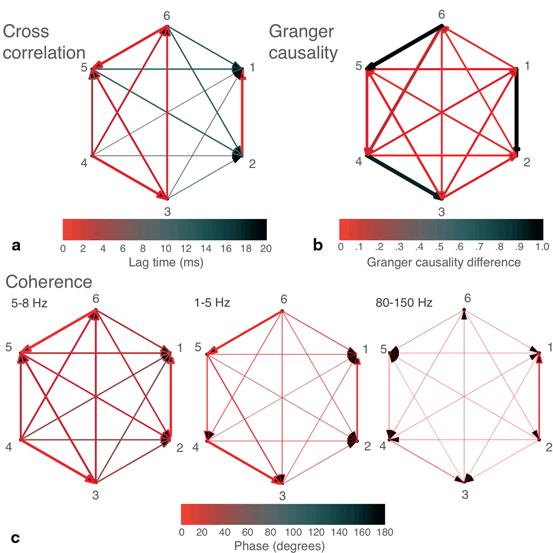

Fig. 11.2
Networks were built from the six-channel recording of a human seizure. a Cross correlation-derived network. Width of arrows (from narrower to wider) represents value of peak cross correlation, while color represents the lag (in ms) of the peak cross correlation, with faster lags in red and slower lags in black. b Granger causality-derived network. If statistically significant Granger causality was found between two nodes in both directions, the larger of the two was plotted. Width of arrows represents the value of the Granger causality. Color represents the difference between the Granger causality values of each direction (larger—smaller), if both values were statistically significant. c Coherence-derived networks in theta (5–8 Hz), delta (1–5 Hz), and high gamma (80–150 Hz) frequency bands. Width represents the mean value of coherence within the indicated frequency band, while color represents the mean phase coherence (in degrees) within the frequency band.
Plotting the lags derived from cross correlation analysis (lags from fastest (0 ms) to slowest (20 ms and above are displayed as colors from red to blue) shows that many of these connections are fast, operating on a biologically plausible timescale of approximately 10 ms, and with subgroups of channels operating nearly synchronously (Fig. 11.2a).
Coherence analysis was also performed in other frequency bands (Fig. 11.2c), such as high gamma (80–150 Hz) due to its frequently reported relationship with epileptic activity [26, 27]. As compared to our previous findings depicted in Figs. 11.2a and c, these yielded less similar networks. Given that the majority of the signal amplitude in the time domain consists of theta frequency signals, this discrepancy of the networks across different frequency bands is not necessarily inconsistent. Most of the connections found in the non-theta frequency bands are of low strength, but the most significant of these may reflect alternative processes either independent of the seizure or underlying a different component of the seizure dynamics.
As compared to the results in Figs. 11.2a and c, Granger causality analysis produced a differently structured network (Fig. 11.2b); however, as mentioned above, this analysis may work best with oscillatory signals when the data is divided into sufficiently small, possibly overlapping epochs.
A still more nuanced approach to constructing networks may be taken by splitting the data into epochs to examine changes in seizure dynamics over time (Fig. 11.3). Here, the data has been segmented into four epochs of 7.5s each and networks constructed for each of the four epochs. The four epochs are of equal length and were arbitrarily selected; however, each contains several general hallmarks of different stages of seizure activity (Fig. 11.3a). The first epoch is representative of seizure onset and includes several heralding spikes. In the second epoch, the seizure further develops and spreads to all channels. The third epoch contains the fully developed seizure, consisting of high amplitude synchronized oscillatory activity. Finally, the fourth epoch is characteristic of seizure offset. For each of the three methods of defining networks, it can be appreciated that networks from the later epochs (in which signal power is largest) more closely resemble the networks derived from the whole dataset (Fig. 11.3b, 11.3c, 11.3d).
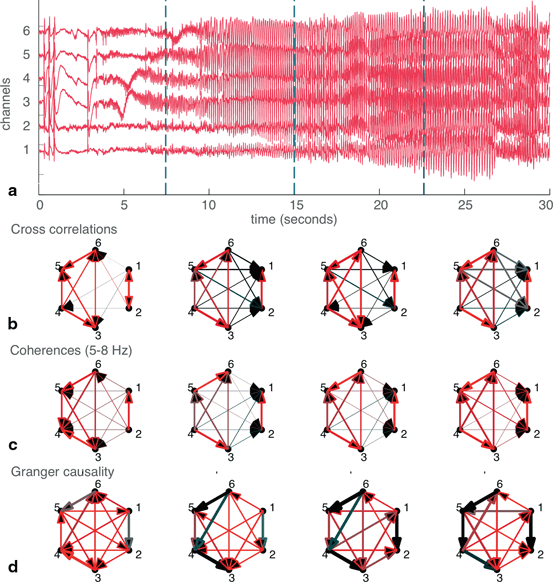

Fig. 11.3
Splitting the data into epochs yields information about how networks change over time. a The six-channel recording split into four epochs of equal (7.5s) length. b Cross-correlation derived networks for each of the four epochs. c Coherence-derived networks, taken in the theta frequency band. d Granger causality-derived networks. Widths and colors of arrows show strength and “speed” of each connection, as defined in Fig. 11.2
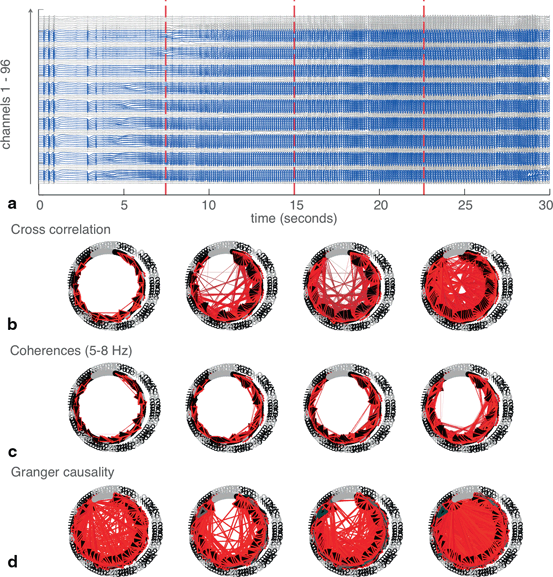
Having demonstrated the validity of these techniques at a smaller scale, we then applied them to the entire dataset in which we removed channels with artifacts (62 channels total; 34 channels were removed) (Fig. 11.4a and 11.4b). Even on a larger scale, networks derived from cross correlation and coherence appear to resemble each other (Fig. 11.4c, 11.4d, 11.4e). The Granger causality-derived network, however, found a much larger number of significant connections. This may point to alternative uses for Granger causality as compared to the other techniques—when applied to such large datasets, it may be best for picking up many relationships between nodes. Cross correlation and coherence, on the other hand, can be easily thresholded to pick up only the most dominant connections.
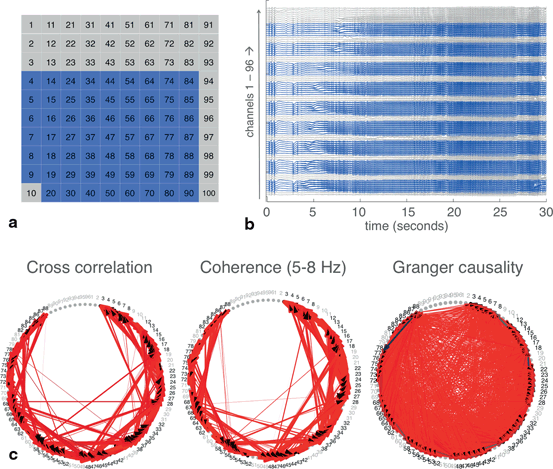

Fig. 11.4
Techniques for defining networks were applied to the full set of MEA recordings. a The spatial layout of the MEA. Blue indicates the 62 channels with good quality recordings, which were used for analyses, while gray indicates the 34 channels with artifacts. b The raw EEG trace from the 96 channels, with good channels in blue and channels with artifacts in gray. c Networks built using each of the three techniques. Widths and colors of arrows show strength and “speed” of each connection, as defined in Fig. 11.2. Channels with artifacts, which were not included in the analysis, were plotted in gray. Threshold for plotting connections determined from both cross correlation and coherence was 0.95. Criteria for plotting connections from Granger causality was as indicated in Fig. 11.2.
Again, splitting the data into four epochs and applying network analyses to each epoch reveals change in network structures over time (Fig. 11.5). The number of significant connections increases dramatically as the seizure develops. At first, connections are mainly local (adjacent channels are generally numbered consecutively) but over time, more long-range connections appear. Additionally, the lag of these connections appears to decrease until channels are largely synchronous with each other. This also demonstrates that Granger causality results may become more congruent with other techniques when it is applied to smaller epochs of data.
