-molecules, study the properties of the atoms and the inter-molecule interactions like hydrogen bridges and van-der-Waals bounds. Now, to describe a water wave, one has to study millions and millions of these molecules and their interactions. To this end, the researchers take the reasonable approach to start simulating two, three, then even hundreds of these molecules. The numerical analysis is demanding, but still there is no description of the water waves, since the system appears to be so complex taking into account all the different interactions of molecules and the research in this hard task got stuck in some way.
Of course it is well-known that it is not necessary to study single molecules to describe water waves, today we take the famous Navier-Stokes equation (NSE) which includes the solution for this phenomenon. This equation involves mean fluid properties, e.g., inner friction and viscosity [52]. Hence the NSE considers average properties of interacting single molecules. In other words, it does not know single molecules, but provides a powerful description of a large ensemble or mass of molecules. It allows to describe several different rather complex fluid phenomena, but of course no phenomena related to single molecules. Hence the NSE equation provides a very good mathematical description of the system at a macroscopic description level only. Going back to the intended description of water waves by a single molecule study, this approach is not reasonable, probably it will not lead to a good description level of macroscopic phenomena and hence it is not constructive.
In todays’ neuroscience, the approach of linking single neuron activity to macroscopic phenomena is attractive, e.g. in the context of cognition [7, 31, 57], sleep [67] or anaesthesia [4, 13, 39]. These studies state a relationship between the single neuron activity (microscopic scale) and behavioral phenomenon (macroscopic scale). However, to our best knowledge it is not understood how the different experimental findings on different scales are linked to each other, i.e., the link between the two scales is not understood and no model linking the scales has been developed yet. This situation resembles closely the water wave task described above: it is clear that there is a relation between small sub-units (molecules or neurons) to large complex systems units (water wave or cognition), since the dynamics of the large units is generated by the sub-units, but a link appears to be too complex. Consequently, learning from physics and the NSE, it is necessary to consider more abstract, intermediate models whose elements are based on small sub-units properties but which allow to model large unit phenomena. In other words, it is much more effective to consider mesoscopic population models involving average properties of interacting neurons and which allow to describe macroscopic experimental phenomena, such as Local Field Potentials (LFP), encephalographic activity (EEG/MEG) or even behaviour. Promising candidates for such models are neural mass or neural field models which have been validated by LFPs and EEG in many previous studies, cf. [18, 27, 69, 71]. The present book chapter discusses recent advances in these models rendering the standard neural population models more realistic.
The subsequent sections do not give a complete overview over the recent advances in the field, a recent excellent review article already provides this information [17]. The present chapter first introduces briefly two types of neural field models. Then it gives some details of few selected extensions, always introducing the neuroscientific problem by experimental data before presenting a mathematical description of the phenomena described. In each example, the experimental data validates the neural population model and elucidates how to model experimental data.
Two Classes of Neural Field Models
Amari Model
The first neural field models developed by Wilson and Cowan [68] and Amari [3] are continuum limits of large-scale neural networks. Typically, their dynamic variables describe either mean voltage [3] or mean firing rate [46, 68] of a population element of neural tissue, see also the excellent review article of Bressloff [17]. In some subsequent sections we consider the paradigmatic Amari equation [3] describing the spatiotemporal dynamics of mean potential  over a cortical
  -dimensional manifold
  :
:
over a cortical -dimensional manifold :![$$\tau \frac{\partial V(x,t)}{\partial t}=-V(x,t)+\int_{\Omega }{}K(x,y)S[V(y,t)]y+I(x,t)\,.$$](/wp-content/uploads/2016/12/A319630_1_En_6_Chapter_Equ1.gif)
(6.1)
with the spatial synaptic kernel  , which defines the connectivity between site
  and site
  . The transfer function
  is nonlinear and typically of sigmoidal shape. This model considers external inputs
  , e.g., originating from other extra-cortical populations and from external stimulation. The model (6.1) takes into account a single synaptic time scale
  assuming an exponential synaptic response function. However, we point out that re-scaling of time allows to set
  .
.
, which defines the connectivity between site and site . The transfer function is nonlinear and typically of sigmoidal shape. This model considers external inputs , e.g., originating from other extra-cortical populations and from external stimulation. The model (6.1) takes into account a single synaptic time scale assuming an exponential synaptic response function. However, we point out that re-scaling of time allows to set .In general, the connectivity kernel  fully depends on both sites
  and
and  reflecting spatial heterogeneity. If the connectivity solely depends on the difference between
  and
and  , i.e.
 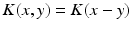 , then the neural field activity does not depend on specific spatial locations and hence is translational invariant. This case is called spatially homogeneity [3]. If the connectivity even depends on the distance between
  and
and  only, i.e.
 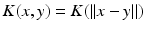 , with
  as some norm in
  , then the neural field is spatially homogeneous and isotropic [24].
fully depends on both sites and reflecting spatial heterogeneity. If the connectivity solely depends on the difference between and , i.e. , then the neural field activity does not depend on specific spatial locations and hence is translational invariant. This case is called spatially homogeneity [3]. If the connectivity even depends on the distance between and only, i.e. , with as some norm in , then the neural field is spatially homogeneous and isotropic [24].Several extensions of the Amari model (6.1) are possible, such as the consideration of finite axonal transmission speeds [41, 42], constant feedback delays [36, 61] (see also section “Delayed Nonlocal Feedback Between Populations”), heterogeneity [9, 10] (see also section “Heterogeneous Neural Fields”), spike-frequency adaption [22], statistical properties of single neurons [28], the combination of several brain areas [60], electromagnetic fields [11, 12] and many more [17].
Mathematically, Eq. (6.1) is an integro-differential equation. Spatially homogeneous (respectively isotropic) neural fields have been intensively studied in the literature due to their nice analytical properties [23, 29, 41, 42]. Moreover, these models may be transformed to derive partial differential wave equations [23, 37, 47] for certain classes of synaptic kernels.
Robinson Model
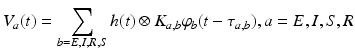
As mentioned at the end of the previous paragraph, under certain conditions integro-differential equations may be transformed to partial differential equations. In the 1990s James Wright and David Liley started developing partial differential equation models for neural population activity [70]. Their work has inspired other teams, e.g., Peter Robinson and colleagues, who developed a similar neural model which has been proven to be very successful. This type of neural field model [34, 59, 66] is based on a population-level model of a single thalamo-cortical module consisting of excitatory (E) and inhibitory (I) cortical population, thalamic relay neurons (S), and thalamic reticular neurons (R). The average soma membrane potential is modeled by
(6.2)
where  denotes temporal convolution and
  is the pulse firing rate of the population
  . The constants
  are the strengths of the connections from population of type
  to population of type
  . The delay term,
  is zero for intra-cortical and intra-thalamic connections and non-zero for thalamocortical or corticothalamic connections [66].
denotes temporal convolution and is the pulse firing rate of the population . The constants are the strengths of the connections from population of type to population of type . The delay term, is zero for intra-cortical and intra-thalamic connections and non-zero for thalamocortical or corticothalamic connections [66].The model assumes that only axons of excitatory cortical neurons are long enough to emit axonal propagating pulses. Moreover,  obeys the damped oscillator equation
obeys the damped oscillator equation
(6.3)
with the operator 
(6.4)


(6.5)
where  and
and  are the synaptic decay and rise rate of synaptic response function, respectively.
and are the synaptic decay and rise rate of synaptic response function, respectively.In addition, the pre-factor  defines the response function amplitude subject to the aneasthetic concentration. For more details of the model and the nominal parameter values, see [34].
defines the response function amplitude subject to the aneasthetic concentration. For more details of the model and the nominal parameter values, see [34].Delayed Nonlocal Feedback Between Populations
In neural fields, one might include delays in several ways. The finite axonal transmission delay is proportional to the fraction of distance between two spatial locations and transmission speed and takes into account the finite propagation speed of action potentials along axonal branches [43], or in more general terms, it considers the finite-time interaction between two elements in a spatially extended system [37]. In addition, one could argue that delayed interactions happen on a single-neuron scale between neurons and it is more reasonable to treat these inter-neuron delays as a kind of effective delay [61, 62]. This latter type of delay is constant. In addition to these two delay types, the nonlocal feedback delay takes into account the finite axonal transmission speed along axonal pathways between two brain areas. Since this axonal pathway has a finite defined length, the transmission delay is fixed and hence also constant [36]. Variations of all these delay types may be considered by distributed transmission speeds and/or distributed delays [6, 42]. The subsequent paragraphs consider constant delays reflecting the finite transmission speed along axonal branches between brain areas, experimental data validate quantitatively the models proposed.
The Primary Sensory Area in Weakly-Electric Fish
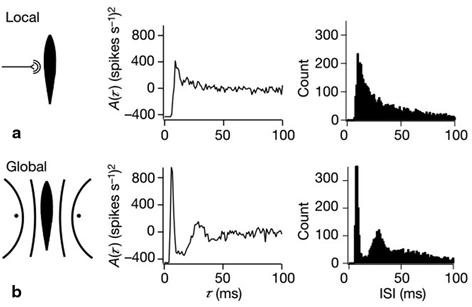
To examine the neural decoding in weakly electric fish, Doiron et al. [26] had performed an experimental in vivo stimulation study. A dipole was placed near the skin of a fish to stimulate only a part of the receptive field. Figure 6.1 sketches the experimental setup, the spike autocorrelation  and the interspike interval (ISI) histograms of a typical pyramidal cell response to a local and global stimulus. The stimulus was temporal noise evoking spatially weakly correlated sensory receptor activity for local stimulation and strong spatial correlations in the receptor dynamics in case of the experimentally global stimulation. The global random stimulus evokes bursting in the neuron activity whereas the local stimulus evokes a single principal firing mode. This experiment raises the question how the spatial correlations in the input stimulus interact with those imposed by the physiological system.
and the interspike interval (ISI) histograms of a typical pyramidal cell response to a local and global stimulus. The stimulus was temporal noise evoking spatially weakly correlated sensory receptor activity for local stimulation and strong spatial correlations in the receptor dynamics in case of the experimentally global stimulation. The global random stimulus evokes bursting in the neuron activity whereas the local stimulus evokes a single principal firing mode. This experiment raises the question how the spatial correlations in the input stimulus interact with those imposed by the physiological system.Fig. 6.1
Experimental setup and firing statistics of stimulation experiment [26]. In (a), the electric skin stimulation is local (left panel) and induces a single main oscillation as seen in the spike autocorrelation function  (center panel) and the corresponding histogram (right panel). In (b) the stimulus was global inducing an additional oscillation mode. Taken from [26] by permission
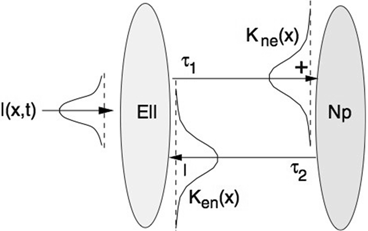
(center panel) and the corresponding histogram (right panel). In (b) the stimulus was global inducing an additional oscillation mode. Taken from [26] by permissionA rather simple population model considers the primary sensory areas in the electro-sensory system of weakly electric fish [14], but similar configurations can also be found in parts of the vertebrate brain [2]. The model sketched in Fig. 6.2 [44] is made up of the ELL, a layer of pyramidal cells driven by the primary receptors that receive an external stimulus, and the higher area  . These areas are spatially coupled via a delayed topographic feedback with connectivity kernels
  and
and  which reflect connections from the
  to the
  and vice versa, respectively, see Fig. 6.2. The neurons in both populations have insignificant direct couplings and the coupling from the ELL to
  is excitatory and delayed in time by
  , the coupling back to the ELL is inhibitory with delay
  . Moreover, according to the experimental setup in [26], the model considers excitatory spatiotemporal stimuli
  to the ELL.
. These areas are spatially coupled via a delayed topographic feedback with connectivity kernels and which reflect connections from the to the and vice versa, respectively, see Fig. 6.2. The neurons in both populations have insignificant direct couplings and the coupling from the ELL to is excitatory and delayed in time by , the coupling back to the ELL is inhibitory with delay . Moreover, according to the experimental setup in [26], the model considers excitatory spatiotemporal stimuli to the ELL.Fig. 6.2
Topography of the delayed feedback model. The plus and minus signs indicate the excitatory and inhibitory connections, respectively
The aim of the study is to learn more about the mechanism how to change the principal oscillation frequency by the properties of an external stimulus. The model considers spatiotemporal noise with a well-defined and adjustable spatial correlation length. The population model [44] describes two coupled neural fields whose activities are strongly related to experimentally observable local field potentials [55].
Then the theoretical power spectrum in the ELL reads
(6.6)
where  is the spectral response function and
  is the scaled Fourier transform of the input correlation function. It turns out, that the power spectrum Eq. (6.6) does not depend on the spatial scale of the feedback loop
  and the input correlation scale
  independently, but just depends on their ratio, called
  . This finding reflects the coupling of the spatial scale of the external input to the intrinsic spatial scale of the system.
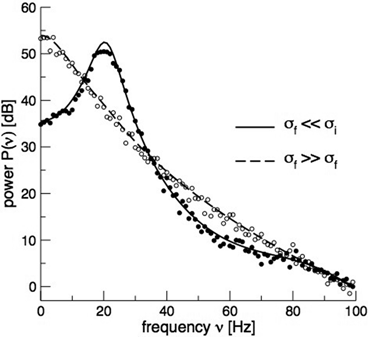
is the spectral response function and is the scaled Fourier transform of the input correlation function. It turns out, that the power spectrum Eq. (6.6) does not depend on the spatial scale of the feedback loop and the input correlation scale independently, but just depends on their ratio, called . This finding reflects the coupling of the spatial scale of the external input to the intrinsic spatial scale of the system.Figure 6.3 shows the resulting power spectra for two values of the spatial scale ratio  . We observe that a small ratio
  generates a spectral peak at about 20 Hz, whereas the large ratio
  generates a power peak at about 0 Hz. Hence retaining the topographic feedback but decreasing the input correlation function from large values of
  (global noise) to small values of
  (local noise) switches the spectral peak, similar as observed experimentally by Doiron et al. [26].
. We observe that a small ratio generates a spectral peak at about 20 Hz, whereas the large ratio generates a power peak at about 0 Hz. Hence retaining the topographic feedback but decreasing the input correlation function from large values of (global noise) to small values of (local noise) switches the spectral peak, similar as observed experimentally by Doiron et al. [26].Fig. 6.3
Theoretical power spectrum computed for  (solid line) and
  (dashed line)
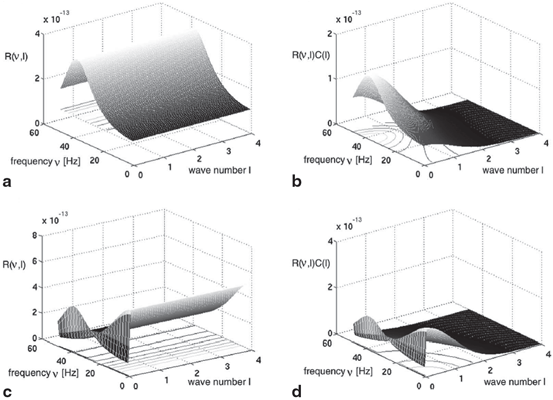
(solid line) and (dashed line)To understand this, Fig. 6.4 shows the response function  and the integrand
  in the definition of the power spectrum Eq. (6.6). The response function
  and
and  have a single maximum at about 20 Hz for global noise (Fig. 6.4a and 6.4b), whereas
  and
and  have two local maxima at 20 Hz and 0 Hz (Fig. 6.4c and 6.4d). Since the peak of
  at 0 Hz is broader than the peak about 20 Hz and the power spectrum is the integral over
  , cf. Eq. (6.6), the contribution of
  to the power at 0 Hz exceeds the contribution at 20 Hz yielding a strong peak at 0 Hz.
and the integrand in the definition of the power spectrum Eq. (6.6). The response function and have a single maximum at about 20 Hz for global noise (Fig. 6.4a and 6.4b), whereas and have two local maxima at 20 Hz and 0 Hz (Fig. 6.4c and 6.4d). Since the peak of at 0 Hz is broader than the peak about 20 Hz and the power spectrum is the integral over , cf. Eq. (6.6), the contribution of to the power at 0 Hz exceeds the contribution at 20 Hz yielding a strong peak at 0 Hz.Fig. 6.4
The response function  and the integrand of the power spectrum integral
  for (a, b)
  (global noise), (c, d)
  (local noise). Taken from Ref. [44] by permission
and the integrand of the power spectrum integral for (a, b) (global noise), (c, d) (local noise). Taken from Ref. [44] by permissionThis result reveals that the spectral peak in Fig. 6.3 at 0 Hz results from the selection of one mode out of two possible modes at frequencies of 0 Hz and 20 Hz, whereas the spectral peak at 20 Hz is the only oscillation mode present in the system. The switch between these two configurations depends on the spatial correlation of the stimulus noise. These modes reflect activity subnetworks from which only one is engaged. Hence the rather simple population model reveals the underlying mechanism of the switch-on of oscillations at a certain frequency induced by an external stimulus. This study may explain the occurrence of certain oscillations observed in EEG by an underlying change of stimulation, as found in the mammalian olfactory bulb during breathing [19] or in anaesthesia at increased levels of anaesthetic concentrations [56, 64].
General Anaesthesia
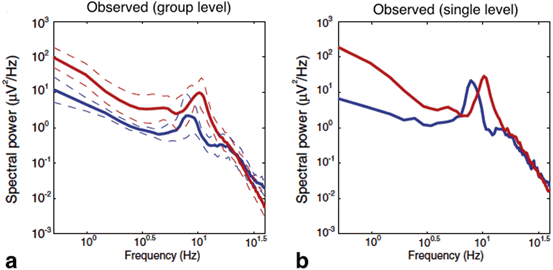
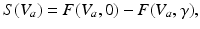
General anaesthesia is an important medical application in today’s hospital surgery, but its underlying neural interactions is still a mystery. In the last decades, general anaesthesia has attracted theoretical researchers [15, 20, 45, 53, 65]. Most theoretical studies aim to explain signal features of electroencephalographic data (EEG) observed during anaesthesia, such as the attenuation or enhancement of  activity accompanied by a subsequent enhancement of
  activity while increasing anaesthetic concentration [21, 54], cf. Fig. 6.5. The subsequent paragraphs show how neural field models may explain on the power enhancement and the frequency shift of maximum power while increasing the anaesthetic concentration.
activity accompanied by a subsequent enhancement of activity while increasing anaesthetic concentration [21, 54], cf. Fig. 6.5. The subsequent paragraphs show how neural field models may explain on the power enhancement and the frequency shift of maximum power while increasing the anaesthetic concentration.Fig. 6.5
The power spectra measured in frontal EEG electrodes in the absence of anaesthesia (blue line) and during propofol anaesthesia (red line) in a group of subjects (a) and for a single subject (b). Taken from [34] by permission
To this end, we consider a derivative of the Robinson model introduced in Sect. “Two Classes of Neural Field Models” and introduce a new sigmoid function derived from properties of type-I neurons [39]
(6.7)
with
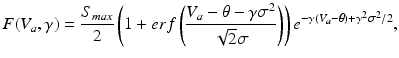
(6.8)
in which the parameter  takes into account the properties of type I-neurons,
  is the maximum population firing rate,
  is the mean firing threshold, and
  is related to the standard deviation of firing thresholds in the populations.
takes into account the properties of type I-neurons, is the maximum population firing rate, is the mean firing threshold, and is related to the standard deviation of firing thresholds in the populations.Related posts:
 Introduction
Epileptogenic Networks: Applying Network Analysis Techniques to Human Seizure Activity
Computational Modeling of Neuronal Dysfunction at Molecular Level Validates the Role of Single Neurons in Circuit Functions in Cerebellum Granular Layer
Toward Networks from Spikes
DCM, Conductance Based Models and Clinical Applications
A Multiscale “Working Brain” Model
Introduction
Epileptogenic Networks: Applying Network Analysis Techniques to Human Seizure Activity
Computational Modeling of Neuronal Dysfunction at Molecular Level Validates the Role of Single Neurons in Circuit Functions in Cerebellum Granular Layer
Toward Networks from Spikes
DCM, Conductance Based Models and Clinical Applications
A Multiscale “Working Brain” Model
Stay updated, free articles. Join our Telegram channel

Full access? Get Clinical Tree


