Fig. 8.1
Probabilistic map of areas showing severe signal loss in a typical fMRI study using echoplanar imaging. The study was done at 3 T using TE = 25 ms and voxel size = 2.5-mm isotropic. Signal-to-fluctuation noise ratio (SFNR) maps were calculated for each of 34 healthy control subjects and thresholded to identify voxels with SFNR values below 20. The overlap of these low SFNR regions across subjects after normalization to stereotaxic space is shown. Green indicates overlap in at least 25 % of the sample, red overlap in at least 50 %, and yellow overlap in at least 75 %
Imaging parameters can be adjusted to reduce the severity of signal dropout (Merboldt, Finterbusch, et al., 2000; Morawetz, Holz, et al., 2008). The shorter the TE, the less time is available for spins to become out of phase within a voxel, thus the smaller is the effect of an intra-voxel gradient. Unfortunately, shortening the TE will also reduce the size of the BOLD effect, for the same reason. Use of smaller voxels can be helpful, since differences in field strength across a gradient spanning the voxel will be smaller, producing less dephasing. Decreasing the voxel size also improves spatial resolution, but this strategy is limited by the fact that smaller voxels contain fewer protons, thus signal levels will be smaller in regions not affected by macroscopic gradients. Reducing the voxel size also means that more voxels are needed to cover the entire brain, which requires more time (i.e., a longer TR), resulting in lower temporal resolution. Fortunately, these limitations are becoming less important with the advent of parallel imaging and continued improvements in gradient speed.
Geometric Distortion and Motion Artifacts
EPI images typically show varying degrees of geometric distortion or “warping” of the image due to underlying field inhomogeneity and other factors, and these effects tend to increase with field strength and matrix size. The result of this warping is a spatial mismatch between some regions of the EPI image and the high-resolution structural images that are usually obtained as an anatomical reference. A common method for reducing geometric distortion is to acquire special images during the scan that are used later to construct maps of the underlying magnetic field (Jezzard & Balaban, 1995). The phase information in these maps can then be used to “unwarp” the EPI data off-line, using, for example, the FUGUE program available in FSL (www.fmrib.ox.ac.uk/fsl/fugue/).
Artifacts due to head motion should be reduced as much as possible during image acquisition using three techniques. First, the patient should be made as comfortable as possible with cushions for support and blankets if needed for warmth. Second, freedom of head movement with the head array coil should be reduced with comfortable pads at the temples and perhaps tape across the forehead. In our experience, highly restrictive devices such as bite bars and rigid molded head pillows can induce anxiety and discomfort and are usually counterproductive, though some centers use these routinely. Finally, the patient should be encouraged before each scan to relax the body, especially the shoulders and neck, and should receive verbal feedback on the degree of movement that occurred in the previous scan, if this information is available from an online analysis tool.
Noise due to head motion can be reduced during post-processing using 3-dimensional image registration. A variety of tools are available for this purpose, such as the “3dvolreg” (rigid-body alignment) or “3dAllineate” (nonlinear warping) routines in AFNI (www.afni.nimh.nih.gov/pub/dist/doc/program_help/3dvolreg.html). In addition to registering the successive images in an fMRI time series to each other, these programs produce a text file containing the estimated movement that occurred at each time point, relative to the base image, in terms of three translation and three rotation parameters. These movement vectors can be used later as noise covariates when modeling the observed time series, an approach that in our experience improves the sensitivity and specificity of the activation maps (Johnstone, Ores Walsh, et al., 2006; Morgan, Dawant, et al., 2007).
Stimulus and Task Apparatus
A variety of MRI-compatible stimulus presentation and response recording devices are available for fMRI. Visual stimuli are typically presented with a video projector and a screen placed at the foot of the patient or via goggles containing miniature LCD displays. A variety of headphones are available for audio. The least expensive of these operate by air conduction of sound through a length of plastic tubing, which is inserted into the subject’s ear canal at one end and attached at the other end to a small speaker at some distance from the magnet. These devices generally include either an ear plug or an external muff for passive attenuation of the scanner noise. The main limitation of this approach is the severe loss of high-frequency sounds during air conduction through the tube, which can only be partly corrected by boosting these frequencies at the source and which results in a somewhat muffled sound with speech stimuli. Much higher-quality audio is available using MRI-compatible electrostatic speakers, which are available in a small in-ear format (http://www.stax.co.jp/index-E.html). These devices do not yet provide any passive attenuation and so must be used with an over-the-ear muff.
Manual responses can be recorded with button or key-press boxes, joysticks, and other devices. Several technologies are available for operation within a strong magnetic field, and all work well. Vocal responses can also be recorded during scanning. The best device for this purpose is an adaptive noise-canceling microphone designed specifically for MRI use (http://www.optoacoustics.com/medical/fomri-iii). In our experience this device is easy to use and provides good quality recordings even during continuous EPI image acquisition.
A number of software products are available for controlling stimulus presentation and logging input from response devices (Table 8.1). These vary in cost, ease of use, reliability, capabilities, and availability of technical support, and all have relative strengths and drawbacks.
Table 8.1
Software for fMRI stimulus presentation and response timing
Name and vendor/source | Free | OS | Ease | Satisfaction |
|---|---|---|---|---|
E-Prime (Psychology Software Tools) | No | Win | Good | High |
Yes | Win | Fair | High | |
Presentation (http://www.neuro-bs.com) | No | Win | Low | Fair |
Psyscope X (http://psy.ck.sissa.it) | Yes | Mac | Good | High |
Psyscope Classic (http://psyscope.psy.cmu.edu) | Yes | Mac Classic | Good | Low |
ERTS (www.erts.edu) | No | MS-DOS | Good | Low |
SuperLab (www.superlab.com) | No | Mac, Win | Good | Low |
Matlab (www.mathworks.com) | No | All | Low | Fair |
General Principles of Task Design and Timing
A great variety of tasks and timing schemes have been used successfully in fMRI studies. Some aspects of task selection for language and verbal memory paradigms are discussed in a later section. In designing paradigms for functional mapping in individuals, it is critical to bear in mind that fMRI measurements contain significant amounts of “noise” and that signal averaging is necessary to produce stable maps (Desmond & Glover, 2002; Huettel & McCarthy, 2001). Many clinicians overemphasize the need to keep scanning sessions short because of concerns over patient fatigue or (more likely) scanning costs. Radiology practitioners are often accustomed to running structural MRI protocols that last no more 30 min, whereas a high-quality fMRI study generally requires much more time, particularly if several activation protocols are attempted in the same session. In our experience, almost all adolescent and adult neurology patients easily tolerate an hour in the scanner, and most have no problem with a 90-min session. As a general rule of thumb, we advise a minimum of 5 min of total scanning (summed across blocks or trial events) for each condition of an fMRI contrast. For a simple design contrasting two conditions, this means a minimum of 10 min of scanning, whereas a complex, factorial, or parametric design might require much more. We emphasize this aspect of protocol design because it is undeniable that increasing the sample size (i.e., number of data points) significantly improves power, sensitivity, and reliability in fMRI studies, and underpowered results are a waste of effort and resources that can only lead to substandard clinical care.
The term “block design” refers to the grouping of trials in a particular condition into blocks. The blocks can all be of equal length or vary randomly in length. In general, blocks should not be longer than about 30 s, as the noise in fMRI is dominated by low frequencies, which can reduce SNR if the frequency of the block alternation becomes too low (Aguirre & D’Esposito, 1999). The main use of block designs is for contrasts between “task sets,” for example, a semantic decision task and a phonological decision task. In such cases, the stimuli used in the contrasting conditions are often matched on a number of variables, and the focus is on the top-down effects of altering attention to different aspects of the stimuli or retrieving different kinds of information associated with the stimuli. In such experiments the stimuli are blocked to reduce the amount of task switching needed and to allow the subject to settle fully into each task state.
“Event related” or “single trial” refers to a design in which trials are not blocked by condition. This approach is more appropriate when a single task set is maintained throughout a scan, and the focus is on bottom-up effects of particular stimulus characteristics. Some well-known examples include passive listening to speech vs. reversed speech, naming animal vs. tool object pictures, lexical decision on words vs. pseudowords, recognition testing on novel vs. previously encoded words, grammaticality judgments on active vs. passive sentences, etc. Event-related designs minimize top-down attention, arousal, and “cognitive strategy” differences between conditions because the random intermixing of stimuli from different conditions makes it impossible for the subject to anticipate the type of stimulus coming next. Differences in attention and arousal can be important confounds in block design studies and also lead to differences between conditions in the degree of “mind wandering” that occurs. It is frequently said that event-related designs are less sensitive than block designs because blocking elicits a larger change in the BOLD signal. One should keep in mind, however, that some of this larger change in BOLD signal could be due to nonspecific attention and arousal differences associated with blocking rather than to the effects of interest.
Event-related designs also allow trials to be sorted or modeled according to performance measures such as accuracy or reaction time. These parameters can be entered into the analysis model to identify the neural correlates of, for example, a correct vs. incorrect response, a remembered vs. forgotten word, or a long vs. short RT. A final advantage of event-related designs is in experiments that use an overt vocal response, such as naming or reading tasks. Vocal responses produce significant movement artifact in the BOLD signal time course. However, because the hemodynamic response to a single trial occurs later than the artifact from a spoken response, the trial-by-trial modeling of the hemodynamic response in event-related designs can distinguish these two sources of signal change.
The analysis of event-related fMRI data assumes a linear summation of hemodynamic responses from adjacent trials. This assumption appears to be reasonable as long as trials are not too closely spaced (Buckner & Braver, 1999). The spacing of trials depends to some degree on the hypothesized timing of neural events. For a low-level perceptual stimulus such as a flash of light or brief tone, the neural events of interest might be over within a few hundred ms, and trials can be separated by as little as 1 s or so. With more complex stimuli and tasks, such as naming a picture, the neural events might last well over 1 s, and trials should be separated by a longer interval. As a general rule of thumb, space the trials by at least twice the average RT on the task. Varying or “jittering” the interstimulus interval on a pseudorandom schedule is also helpful for statistical separation of adjacent hemodynamic responses during the analysis. Several freely available tools exist for designing statistically optimal stimulus and ISI sequences for event-related fMRI, such as Optseq (http://surfer.nmr.mgh.harvard.edu/optseq/) and the RSFgen tool in AFNI.
A final type of design involves “sparse” or “clustered” acquisition of images (Hall, Haggard, et al., 1999). Image volumes in fMRI are collected initially as a sequence of adjacent 2-dimensional slices, which are later combined to construct image volumes for each TR. By default, most fMRI sequences distribute the collection of the 2-D slices evenly throughout each TR. The rapid gradient switching necessary for spatial encoding in fMRI creates a loud acoustic noise burst during each 2-D acquisition. In some settings it is desirable to create periods of silence during scanning, such as in difficult auditory perceptual tasks or when high-quality vocal recordings are needed. Clustered acquisition refers to grouping the acquisition of the 2-D slices comprising each volume as closely in time as possible (typically 2 s or less) and separating these volume acquisitions by a silent period. The silent period can be relatively brief, though the 4–5-s delay to the peak of the hemodynamic response should be kept in mind to optimize image acquisition at the peak of the response rather than the trough. A longer silent period can be used to minimize contamination of the fMRI data by neural responses to the scanner noise, which is especially useful for mapping early auditory cortex (Humphries, Liebenthal, et al., 2010).
Some Principles of Data Analysis
The general approach to analysis of fMRI data is to model the effects, over time, of one or more experimental variables (or conditions) on each voxel’s BOLD signal, typically with a multivariable general linear regression model. A beta coefficient and statistical parameter are returned for each variable in the model at each voxel location, resulting in a 3-D array of values known as a statistical parametric map. The beta coefficient is a response amplitude index that reflects the amount of change in the BOLD signal, relative to baseline, that can be attributed to the corresponding experimental condition. Planned contrasts can be conducted comparing the size of the response between conditions. A uniform threshold is typically applied across all voxels to depict the areas of “significant” activation.
Thresholding of activation maps is a complex and contentious issue, particularly for clinical applications. The purpose of thresholding is to highlight regions of strong or reliable activation. A traditional alpha threshold of p < 0.05 is often adopted, though because statistical tests are typically performed on thousands of voxels, a correction for multiple comparisons is necessary to avoid an unacceptable level of false-positive results. Bonferroni correction and similar methods are overly conservative, and a standard Bonferroni correction for, say, 10,000 voxels (a typical number for the whole brain) would require a p threshold of 0.000005. A common alternative method is to combine a more lenient voxel p threshold, say p < 0.001, with a cluster size threshold (Forman, Cohen, et al., 1995). That is, after thresholding at p < 0.001, clusters of surviving voxels are eliminated if they do not exceed a minimum size. The rationale for this approach is that false-positive voxels are unlikely by chance to form large contiguous clusters. Methods are available in most software packages for determining the probability of a cluster surviving any given combination of voxel-wise p threshold and cluster size threshold, using either random field theory (e.g., SPM) or randomization testing (AFNI).
There are potential problems with standard thresholding approaches in clinical contexts. Thresholds are inevitably arbitrary, and it is not at all clear what threshold is optimal for valid separation of “clinically meaningful” from “clinically unimportant” activation. For presurgical mapping, we advocate use of relatively lenient thresholds to avoid false-negative results, with clear color coding of the values to indicate relative levels of significance. Another problem arises from the nature of statistical measurements. Standard statistical values such as z or t scores depend both on the amplitude of a signal and on measurement noise. Measurement noise arises from many sources, including head movement, respiratory and cardiac aliasing, and hardware fluctuations, and the level of noise can vary considerably between subjects and even across scans in the same subject. This variation results in large variations in the overall distribution of observed statistical values and thus the proportion of voxels that survive thresholding. In our experience, it is not uncommon to see over a tenfold difference between subjects in the number of voxels that survive standard thresholding. As discussed above, measurement noise is suppressed by repeated averaging, but there are practical limits to this. For presurgical mapping, it may be that the amplitude of the response (e.g., beta coefficient or percent signal change) is more relevant than its statistical significance. Response amplitude also appears to be less variable from session to session than significance values and is far less dependent on sample size (Voyvodic, 2006). At the moment, much more research is needed to define optimal methods for thresholding in presurgical mapping applications.
For most clinical applications, the focus is on activations in individual subjects. It is common in research studies, however, to construct “average” group maps by combining beta coefficients (or other similar measures of response amplitude) across subjects after spatial normalization. Spatial normalization refers to fitting each subject’s image data to a common spatial template, which can be done using several methods. The simplest approach is a multiparameter linear fitting of the volume to a template brain. Other volumetric methods use nonlinear deformation algorithms, which can dramatically improve the precision of matching to a template (Klein, Andersson, et al., 2009). Other approaches project the volumetric data onto a 2-dimensional surface model of the subject’s cortex and use nonlinear warping methods to align the subject’s surface to a template surface (Fischl, Sereno, et al., 1999). None of these methods can perfectly align brain structures from different subjects, however, nor are the relative locations of functional areas expected to be exactly the same across subjects. Therefore it is necessary in the creation of group maps to spatially smooth individual activation maps to maximize the spatial summation of activation. Smoothing is typically performed using a 3-D Gaussian kernel. The degree of smoothing is typically in the range of 3–8 mm full width at half maximum, with smaller values appropriate when higher spatial resolution is desired.
Several free, well-supported software packages are available for fMRI data analysis. SPM (http://www.fil.ion.ucl.ac.uk/spm/) is the most widely used and is popular because of its ease of use and broad range of capabilities, including a full range of preprocessing and statistical tools, several methods for volumetric spatial normalization, advanced connectivity modeling tools, and extensions for EEG and MEG data. SPM requires MATLAB software to be installed for full functionality (http://www.mathworks.com/products/matlab/index.html). AFNI (http://afni.nimh.nih.gov/afni) is also widely used and powerful, with a full range of preprocessing, parametric and nonparametric statistical tools, and a range of normalization options. AFNI emphasizes flexibility with its open architecture, multiple line-command subprograms, and support for plug-ins. AFNI also provides support for surface-based analysis through its SUMA module. AFNI requires no additional software. FSL (http://www.fmrib.ox.ac.uk/fsl/) is a suite of modules that cover a range of standard fMRI analysis steps and also includes advanced tools for segmentation of structural MRI volumes, image unwarping and normalization, and analysis of diffusion tensor imaging data. SPM, AFNI, and FSL all run on multiple operating system platforms, and all use the common NIFTI image format, allowing flexible combinations of modules and subprograms from different packages to be used on the same data.
Patient Selection
The first step in conducting clinical functional neuroimaging is determining who should have fMRI and Wada or more than one mapping method prior to surgery. Figure 8.2 provides an algorithm for making this decision. This algorithm is based on the empirical data supporting three contentions: (1) fMRI is suitable for mapping language (Binder, 2011), (2) fMRI predicts both language and memory outcome after ATL more accurately than Wada (Binder, Sabsevitz, et al., 2008; Sabsevitz et al., 2003), and (3) there is no empirical data showing that fMRI can predict or prevent amnesia. In situations where there is a risk for developing an amnestic syndrome (e.g., evidence of temporal lobe pathology contralateral to the side of seizure focus), a Wada alone or in addition to an fMRI is recommended.
Fig. 8.2
Algorithm for determining when to conduct fMRI or Wada testing
Using this algorithm, if a patient has an implanted metal device or cognitive dysfunction that precludes fMRI task compliance, the patient should be referred for Wada testing. If the patient has evidence of pathology contralateral to a left-sided seizure focus such as hippocampal sclerosis, contralateral epileptiform activity, temporal lesion, or atrophy (thereby increasing risk for amnesia after left ATL), a Wada should be conducted. If there is evidence of pathology contralateral to a right-sided seizure focus, an fMRI can be conducted. However, if the fMRI shows right language dominance in a patient with a right seizure focus and contralateral (left) pathology, a Wada should be conducted as well.
Participation in cognitive fMRI studies typically requires a higher level of cognitive functioning and sustained attention than does participation in Wada testing. Individuals with intellectual functioning below full-scale IQ of 70, slow processing speed, or severe inattention likely will have difficulty performing most tasks developed for fMRI. Task instructions can be modified, and rate of administration of stimuli can be slowed to be suitable for children down to the age of 10 and adults with cognitive impairment. For example, with a semantic decision task, patients are asked to press a button for animal names that are both found in the United States and used by humans (Binder, Swanson, et al., 1996). The semantic decision task instructions can be simplified to just one decision, “animals that are used by humans.” For children the instructions may be modified to “animals that have four legs” or “animals with fur.” Individuals with verbal intellectual abilities below full-scale IQ of 70 typically will not have the semantic knowledge or attentional capacity to perform above chance on semantic decision tasks. Those with severely impaired processing speed or working memory cannot keep pace with the rate of presentation of stimuli or lose track of the number of targets presented. When performance falls below chance, the validity of the activation patterns should be questioned. In such instances, these patients may be better served by Wada testing if a suitable task is not available. Testing the patient on the task outside of the scanner prior to scheduling an fMRI will allow the examiner to avoid the expense of wasted scanner time.
Subject factors other than level of cognitive functioning that affect the quality of the imaging data include head motion, age, body habitus (morbid obesity, head size, cranial vault abnormalities, neck length), motivational state, adoption of idiosyncratic task strategies, and task performance (Hammeke, Bellgowan, et al., 2000; Weber, Wellmer, et al., 2006). For patients with implanted metal devices, it is necessary to have the vendor and part/serial number of the medical device from the physician. Information on device safety for 1.5- and 3-T scanners can be obtained from www.MRIsafety.com or from the local MRI safety committee. Patients with vagal nerve stimulators can undergo anatomical imaging if the device is turned off, but VNS has not been approved for fMRI pulse sequences at either 1.5 or 3 T.
Clinical Use of fMRI by Neuropsychologists: CPT Codes
The fundamental difference between functional and anatomical imaging is the application of cognitive tasks during the imaging procedure. The proper execution of fMRI requires a multidisciplinary team including those knowledgeable in neuropsychology, radiology, biophysics, statistics, and neuroanatomy. The cognitive tasks conducted during fMRI require expertise in the development of psychological tests by behavioral neurologists or neuropsychologists to optimally probe cognitive systems of interest, and for the development of control or contrast tasks that eliminate unwanted or nonessential activation. Neuropsychologists with training in functional neuroanatomy and psychometric principles are ideally suited for developing tasks and conducting fMRI since the ability to produce valid maps of higher cognitive functions requires an understanding of the function of interest as well as the nonessential cognitive processing subcomponents that may be activated by the task. Neuropsychologists conducting fMRI bill medical insurance (since in the case of epilepsy surgery candidates the diagnosis of epilepsy is medical) using CPT code 96020. This code covers testing of language, memory, cognition, motor skills, and other neurological functions in association with fMRI. The code descriptor from CPT 2009 for 96020 specifies “neurofunctional testing selection and administration during noninvasive imaging functional brain mapping, with test administered entirely by a physician or psychologist, with review of test results and report.”
An official position statement was published by the Division of Clinical Neuropsychology (Division 40 of the American Psychological Association) on the role of neuropsychologists in the clinical use of fMRI (2004). In addition, the recommended training for neuropsychologists engaged in functional neuroimaging has been described (Bobholz, Rao, et al., 2007). A physician, often a radiologist or behavioral neurologist, bills 70555, and the neuropsychologist bills 96020 for (1) administering tests of higher cognitive functioning such as memory, attention, language, and executive functioning, (2) instructing and practicing with the patient prior to the scanning, (3) adapting the tests as necessary based on the patient’s behavioral performance, (4) monitoring behavioral response performance during the scanning, (5) collaborating with physicians on test findings, and (6) generating a clinical report.
fMRI Tasks
The validity of fMRI maps critically depends on the activation protocol since poorly designed probe or contrast tasks can lead to both false-positive and false-negative mapping errors. A variety of stimuli have been used to induce language processing. These include auditory nonspeech (e.g., pure tones), auditory phonemes (speech sounds, pseudowords), visual nonletter (false font), visual nonpronounceable letter strings (FKJVB), visual pseudowords with orthographic and phonological features of real words (e.g., SNADE), visual and auditory words and sentences, and visual objects. Tasks may require phonetic decision (detecting rhymes or syllables), orthographic decision (letter identification, case matching), and semantic decision (requiring decisions based on stimulus meaning). Sentence reading and story listening may require no decision but automatically elicit complex semantic processing. The various language tasks place different demands with respect to semantic search and lexical retrieval (e.g., naming, word generation). Different combinations of task contrasts will result in different patterns of activation based on the subtraction analysis. See Binder (2009) for a complete review of the regions in which robust activations are typically observed in association with various task contrasts for language mapping (Binder, 2009).
Tasks used during fMRI can be classified as passive or active, overt or covert (Binder, Swanson, et al., 2008). The ideal task is active and overt (allowing behavioral monitoring so that performance variables can be examined) and has a perceptual control or contrast task that is matched for difficulty and performance accuracy, thereby eliminating all sensory and other processes unrelated to the cognitive function of interest. Word generation tasks (e.g., generating a verb or series of verbs in response to a noun or generating words in response to phonemic or categorical semantic cues) are commonly used for language mapping. While word generation is considered an active task, it is typically conducted covertly leading to uncertainty about task compliance and often is contrasted with rest. Another drawback of silent word generation tasks is that activation has been observed predominantly in frontal areas (Benson, FitzGerald, et al., 1999), and concordance between fMRI and Wada has been found in frontal but not temporal regions of interest (Lehericy, Cohen, et al., 2000), making it unlikely that this data could ever be used for tailoring temporal resections.
While there are no universally agreed upon tasks for language and memory mapping, some common methodological pitfalls can be avoided. These pitfalls are (1) using rest, visual fixation, or a non-perceptually matched contrast task during language and memory activation paradigms, (2) failing to incorporate behavior monitoring, and (3) attempting to image memory without considering that episodic memory encoding occurs continuously.
When attempting to image higher cognitive functions such as language and memory, it is not possible to find a task that activates the function of interest and no extraneous or more elementary functions in the process. The contrast between the component functions subsumed by the tasks should be theoretically selected to isolate the cognitive function of interest. For the purpose of concisely describing “how to” conduct fMRI in epilepsy surgery patients, the present chapter will focus on a well-documented semantic decision task that has been shown to be reliable (Binder, Hammeke, et al., 2001), concordant with the Wada test (Binder, Swanson, et al., 1996), accurate in representing language lateralization across a continuum from left to right dominance (Springer, Binder, et al., 1999), and predictive of language (Sabsevitz, et al., 2003) and verbal memory outcome after left ATL resection (Binder, Sabsevitz, et al., 2008).
Table 8.2 shows the theoretical underpinning for the probe and contrast conditions used in the semantic decision task (Binder, Frost, et al., 1997; Démonet, Chollet, et al., 1992). In this paradigm, the probe task involves pressing a button in response to animal names that are both “found in the United States” and “used by humans.” This is contrasted in a block design with a tone decision task. Subjects hear a brief series of tones of varying pitch and are instructed to press a button in response to tone trains containing two high tones. The semantic and tone decision tasks were matched for stimulus intensity and duration, trial duration, and frequency of targets. The contrast task is nonlinguistic and controls for auditory, motor, executive, and working memory functions that are not specific to language. E-Prime scripts (Psychology Software Tools, www.pstnet.com) for teaching and running the tasks in the scanner are available from the authors on request.
Table 8.2
Functional components of two language activation tasks
Semantic monitoring task | ||
|---|---|---|
Functional components | Tone discrimination | Semantic decision |
Semantic processing | + | |
Phonetic processing | + | |
Attention, working memory | + | + |
Auditory processing | + | + |
Motor response | + | + |
Rest or visual fixation does not provide an optimal baseline condition for language or memory studies (Stark & Squire, 2001) and is known to be an active state characterized by unconstrained conceptual processing or spontaneous neural activity during which self-initiated linguistic and semantic processes occur (Binder, Frost, et al., 1999; McKiernan, D’Angelo, et al., 2006; McKiernan, Kaufman, et al., 2003). In fact, recent studies capitalize on resting state coherence, the activation and connectivity between neurons that occur at rest as a measure of the default mode network with both fMRI and MEG (de Pasquale, Della Penna, et al., 2010; Fox & Raichle, 2007; Liu, Fukunaga, et al., 2010; Smith, Fox, et al., 2009). These widely distributed resting state networks closely resemble those evoked by cognitive tasks. To further emphasize this point, a recent study compared maps obtained using the semantic decision-tone decision (perceptual control) task contrast to activation maps obtained with a semantic decision/rest contrast (Binder, Swanson, et al., 2008). Figure 8.3 shows that there were fewer areas of activation seen when language is contrasted with rest than when language is contrasted with a perceptual control task, presumably because language that occurs automatically during rest has been subtracted out. This reduces the sensitivity of the language protocol such that critical language areas can be missed.
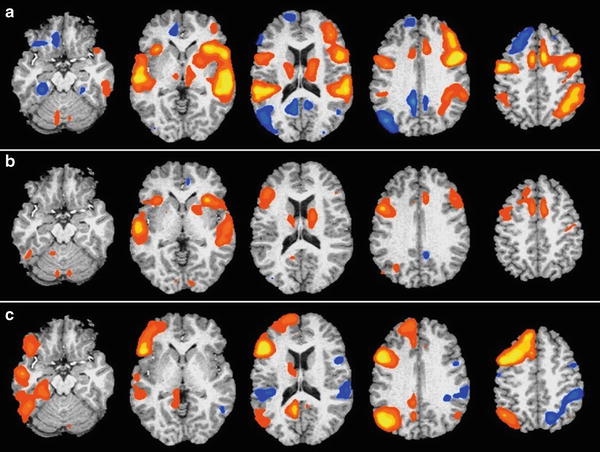
Fig. 8.3
Activation patterns from 30 health participants obtained for contrasts between (a) tone decision versus rest, (b) semantic decision versus rest, and (c) semantic decision versus tone decision. The maps show group activations thresholded at whole-brain corrected p < 0.05. The left side of the brain is on the reader’s left. In (a) tone monitoring was contrasted with “rest” and shows regions in blue that are more active during the resting state (“default network”) than during this nonlinguistic task. These include angular gyrus, posterior cingulate gyrus, medial and ventral frontal lobe, and ventral temporal lobe. In (b) semantic decision is contrasted with “rest.” Note that the default network regions in (a) show relatively little activation, indicating equivalent BOLD signals during the semantic decision task and the resting state. In (c) semantic decision is contrasted with tone monitoring. Strong left-lateralized activation is observed throughout the default network, inferior frontal lobe, and temporal lobe
Figure 8.4 shows the overlap (in green) of areas activated in the language/perceptual control and language/rest contrasts and the areas removed in a typical ATL resection for epilepsy (red). There is very little language activation within the typical resection volume when rest is used as a contrast task. Activation observed in the left angular gyrus, posterior cingulate gyrus, left medial frontal lobe, and left medial temporal lobe during semantic decision contrasted with tone decision disappeared when semantic decision was contrasted with rest. If maps derived using rest as a control task are used for surgical planning, a poor cognitive outcome could result.
Fig. 8.4
Amount of activation within (green) and outside (blue) the typical resection volume (red) when semantic decision is contrasted with rest (top panel) and a perceptual control task (bottom panel)
An alternative language task is an auditory responsive naming task that requires a spoken response. Clustered acquisition techniques (scanning immediately after each spoken response) can be used to allow patients to speak in the scanner so that imaging of language production systems can be conducted. Such tasks should be contrasted with a control task that also includes an oral motor response if the aim is to image expressive language rather than the oral motor apparatus. Normative data has been published for this auditory responsive naming or definition naming task (Hammeke, Kortenkamp, et al., 2005). In this task, subjects are provided with an auditory cue such as “jewelry for the finger” or “first president of the United States” which elicits a verbal response of a common or proper, living, or nonliving noun. The contrast task involves the presentation of brief sequences of noise filtered for high band frequencies matching the same spectrum of human speech. A rising pitch was added to some stimuli (the targets). Patients are asked to say aloud the number of target stimuli. While this task requires a spoken response, the definition naming task activates cerebral regions associated with both language production and “receptive” language semantic system because it requires comprehension of the semantic cue.
The LI from the definition naming task significantly correlates with the Wada language score and the LI from semantic decision (Larson, Hammeke, et al., 2004). One advantage of the definition naming task is that it produces greater activation of the anterior temporal lobes, proportionally greater on the left side. The finding of greater anterior temporal activation associated with naming to an auditory cue is consistent with previous extra-operative grid mapping studies showing a greater number of anterior temporal “hits” with auditory compared to visual naming stimuli (Hamberger, McClelland, et al., 2007).
Finally, some investigators have advocated use of multiple language tasks or a task panel to improve concordance with the Wada (Gaillard, Balsamo, et al., 2004). When using a combination of language tasks, one can examine areas of activation overlap across tasks which reduces the likelihood of false-positive activated voxels.
Related posts:
 Evaluation and Management of Psychogenic Nonepileptic Attacks
Neuropsychological Evaluation of the Epilepsy Surgical Candidate
The Wada Test: Current Perspectives and Applications
Psychotherapeutic and Cognitive Remediation Approaches
Developmentally Delayed Children and Adults
Neuropsychological Assessment of Patients with Epilepsy
Evaluation and Management of Psychogenic Nonepileptic Attacks
Neuropsychological Evaluation of the Epilepsy Surgical Candidate
The Wada Test: Current Perspectives and Applications
Psychotherapeutic and Cognitive Remediation Approaches
Developmentally Delayed Children and Adults
Neuropsychological Assessment of Patients with Epilepsy
Stay updated, free articles. Join our Telegram channel

Full access? Get Clinical Tree


