Images
Description
Advantages
T1-weighted images
CSF is black
Gray matter is dark
White matter is bright
Good visualization of brain morphology
Used to initially define brain anatomy
T2-weighted images
CSF is white
Gray matter is bright
White matter is dark
Pathological areas stand out as brighter (increased signal)
Fluid-attenuated inversion recovery images (FLAIR)
CSF is black
Gray matter is bright
White matter is dark
Pathological areas stand out as brighter (increased signal)
Focal cortical lesions are easier to identify; however, there is increased artifactual signal in mesial temporal regions
The most important factor in optimizing an MRI protocol for epilepsy is clear visualization of mesial temporal structures. This requires thinner slices, with voxel volumes of 1 mm4 being the current norm at 3T, which improves spatial resolution but also increases scan time and noise. Images must be obtained with appropriate alignment around the “hippocampal axis” rather than the “machine axis” so that the whole of the hippocampus can be visualized in a single slice with minimal partial volume effects. Coronal images should transect the hippocampus at right angles, and axial images should follow the long axis of the hippocampus. Good spatial resolution and signal-to-noise ratio are essential components of a dedicated epilepsy MRI protocol. The most commonly used sequence is magnetization-prepared 180° radio-frequency pulses and rapid gradient echo (MPRAGE). One-to-two mm coronal MPRAGE slices (which provide T1 contrast) are typically used to evaluate the temporal lobe, whereas axial slices are obtained if extratemporal epilepsy is suspected. When focal cortical dysplasias are suspected, a T1-weighted sequence optimized for gray-white matter contrast is important, as abnormal imaging features include increased cortical thickness and blurring of the gray-white matter boundary. For a detailed list of recommended high-contrast T1 sequences for various scanner types, see http://www.loni.ucla.edu/ADNI/Research/Cores/.
What Can Be Identified on MRI with the Visual Eye in Epilepsy?
Detection of hippocampal sclerosis (HS) is an important goal of a basic MRI screening study, as this pathology is the most prevalent of the focal abnormalities in partial epilepsy. Features of HS include altered signal in the hippocampus, hippocampal asymmetries, and loss of internal hippocampal architecture (Jackson & Kuzniecky, 2008). Using T2 optimized sequences, high-intensity signal associated with sclerosis can be detected in the hippocampal gray matter. Abnormal signal can best be seen on FLAIR images; however, artifactual errors are common in the mesial temporal regions. Therefore, expert interpretation and confirmation with T2 sequences are recommended. Hippocampal atrophy is often subtle and only visually apparent with well-aligned images free of partial volume effects. Furthermore, unilateral atrophy must be differentiated from normal variations in right and left hippocampal asymmetries (Mingrino et al., n.d.; Walhovd et al., 2009). Finally, morphometric variations in internal hippocampal architecture can be best seen on heavily T1-weighted sequences, such as an inversion recovery sequence. Although experts who are trained in mesial temporal anatomy can make such differentiations, quantitative methods are becoming more influential in detecting hippocampal shape abnormalities and atrophy.
Malformations of cortical development (MCDs), particularly focal cortical dysplasia (FCD), are increasingly recognized as the most common etiology in pediatric epilepsy and the second most common etiology in adults with medically intractable seizures (Lerner et al., 2009). Advances in MR imaging have allowed for improved visual detection and diagnosis of FCD and other cortical malformations in patients with epilepsy (Barkovich, Kuzniecky, & Dobyns, 2001). Common features of FCD include abnormal gyral and sulcal pattern, thickening of the cortical gray matter, blurring of the gray-white matter junction, abnormal neural and glia-derived cell types, and high signal on T2 or FLAIR sequences (Barkovich et al., 2001; Palmini et al., 2004; Widdess-Walsh, Diehl, & Najm, 2006). In a sample of 102 individuals with MCDs (84 % of whom had epilepsy), abnormally small hippocampi were found in 30 %, along with abnormal hippocampal rotation and shape and abnormally large hippocampi in individuals with lissencephaly and subcortical laminar heterotopia (Montenegro et al., 2006).
Initial MRI screening is also important in the detection of tumors, vascular abnormalities, and traumatic and developmental lesions that are apparent to the visual eye. In the case of more subtle lesions such as small areas of sclerotic tissue or cortical dysplasia, more intensive MRI studies should be considered, such as 3D volumetric acquisition sequences, T2 relaxometry, magnetic resonance spectroscopy, and quantitative methods.
Quantitative MRI
Advantages over Visual Analysis
Automated MRI brain image analysis techniques, such as voxel-based morphometry (VBM) (Ashburner & Friston, 2000), offer advantages over subjective techniques (e.g., visual inspection) and have been employed to detect subtle anatomical anomalies in individual neurological patients compared to healthy controls (Bernasconi et al., 2004; Mehta, Grabowski, Trivedi, & Damasio, 2003; Wilke, Kassubek, Ziyeh, Schulze-Bonhage, & Huppertz, 2003). Morphometric analysis of structural MRI has become a widely used and established approach to study normal brain development and neurological diseases. T1-weighted images are primarily used to study gray matter properties, whereas diffusion tensor imaging (DTI) is employed in the investigation of white matter features.
Whereas most conventional clinical MRI review is performed by visual inspection of images slice by slice, quantitative MRI involves 3D image acquisition and systematic quantification of brain morphology, typically across the entire brain. Brain structures may be traced manually for volumetric estimation; however, as this is very labor-intensive, it is not feasible in a clinical setting and therefore largely constrained to research studies. The availability of increased computing power and advancements in signal processing in medical imaging has enabled automatic quantification of brain structures with minimal user intervention and, crucially, within reasonable time frames. Importantly, quantitative MRI has the potential to detect subtle abnormalities in an individual patient by comparing metrics derived from a single scan to large normal control data sets.
Different Methodologies and Software for Quantitative MRI Analyses
Voxel-Based Morphometry
Voxel-based morphometry is the most widely used method for automatic quantification of brain structure and whole-brain structure-symptom analyses (Wright et al., 1995). A detailed review of VBM methods is provided by Ashburner and Friston (Ashburner & Friston, 2000). VBM first aligns brains into a common stereotactic space by morphing each individual brain to a standard template. The most often used template is an average of 152 brains provided by the Montreal Neurological Institute (i.e., MNI152). Averaging brains to a standard template allows matching of anatomical structures across individuals and comparisons of findings, for example, from reported x–y–z coordinates of areas of significant differences found in other studies (Ashburner & Friston, 1999). The next step segments tissue into white and gray matter based on image intensities from T1-weighted images. This requires an MRI image with high gray-white matter contrast. The gray matter partitions obtained from the segmentation are compared statistically on a voxel-by-voxel basis. The result is a statistical parametric map across the whole brain that identifies and localizes areas of significant differences in gray matter concentration/density between groups or between a group and a single patient.
The main advantage of VBM is that it represents a comprehensive assessment of anatomical differences throughout the brain and therefore does not require any a priori clinically defined anatomical region nor is it biased to any well-defined structures. Some VBM tools, such as SPM, have a very useful batch scripting tool that, once set up by an expert, allows quick and easy analysis and visualization of VBM results by nonexperts. The main disadvantage of VBM is that there is potential for misalignment of cortical structures during registration procedures. Cortical variability in folding patterns complicates registration from native space to standard space, increasing the probability of misclassifying gray and white matter tissue, even after nonlinear warping procedures have been applied. This may reduce the sensitivity to detect group differences in cortical regions (Ashburner & Friston, 1999). Likewise, VBM’s smoothing step neglects the increased variability in anatomical relationships across a folded surface (Singh et al., 2006).
Applications of VBM in Epilepsy
VBM investigations have identified widespread cortical and subcortical abnormalities associated with temporal lobe epilepsy that are not apparent upon visual inspection. In addition to hippocampal atrophy (Bernasconi et al., 2003; Salmenperä, Kälviäinen, Partanen, & Pitkänen, 2001), structural abnormalities are found in the entorhinal cortex (Bonilha et al., 2007), fornix (Kuzniecky et al., 1999), parahippocampal gyrus (Bernasconi et al., 2003), amygdala (Bernasconi et al., 2003; Salmenperä et al., 2001), basal ganglia (Dreifuss et al., 2001), thalamus (DeCarli et al., 1998), lateral temporal lobe (Jutila et al., 2001; J. W. Lee et al., 1998; Moran, Lemieux, Kitchen, Fish, & Shorvon, 2001), and cerebellum (Sandok, O’Brien, Jack, & So, 2000). As summarized in a comprehensive review of VBM group studies comparing patients with TLE to healthy controls (Keller & Roberts, 2008), hippocampal atrophy ipsilateral to the seizure focus and bilateral thalamic atrophy are common findings; however, several neocortical abnormalities can also be observed. Such findings are consistent with the diverse cognitive deficits demonstrated in TLE outside of memory impairment (Hermann, Lin, Jones, & Seidenberg, 2009). However, widespread neocortical atrophy associated with seizure burden must be differentiated from the presence of dual pathology, as the presence of extratemporal structural abnormalities is associated with a reduction in the likelihood of seizure freedom following a mesial temporal resection (Sisodiya et al., 1997).
VBM methods have also been applied to the characterization of focal cortical abnormalities in individuals with visually apparent malformations of cortical development. In one study, VBM identified gray matter abnormalities in 79 % of visually identified FCDs, as well as abnormalities extending beyond the known lesion (Colliot et al., 2006). In another investigation, 9 out of 11 patients showed significant gray matter concentration excess that was correspondent to the visually detected FCD (Leonardo Bonilha et al., 2006). VBM methods have also reliably identified regions of increased T2 signal that correspond to visually identified MCDs in 18 out of 20 patients (Rugg-Gunn, Boulby, Symms, Barker, & Duncan, 2005). Importantly, all of these studies identified additional gray matter abnormalities that were not apparent to the visual eye. However, the epileptogenic potential of such putatively occult lesions was not demonstrated, and the detection of so-called “MRI-negative” lesions remains an active area of research.
Surface-Based Morphometry
More recent developments in brain morphometry include surface-based methods for registration and group comparison of cortical structures. The fundamental difference from volume-based approaches, such as VBM, is that computations are not performed on voxels within a 3D volume but involve the more elaborate geometric construction of inner and outer cortical boundaries or surfaces (Fischl & Dale, 2000; Miller, Massie, Ratnanather, Botteron, & Csernansky, 2000). The point of measurement in volume-based approaches is the voxel; when dealing with surfaces, it is the vertex. This allows for more precise matching of cortical structures to a standard spherical template by directly aligning corresponding sulcal and gyral patterns (Fischl, Sereno, & Dale, 1999). Surfaces also offer advantages in visualization as they can be inflated to show abnormalities hidden in sulci. A common measure obtained from surface-based methods is cortical thickness, derived from measuring the distance between corresponding points on the white and pial surfaces across the whole brain (see Fig. 7.1). For example, FreeSurfer (http://surfer.nmr.mgh.harvard.edu) is a popular comprehensive toolbox that performs automatic subcortical segmentation and surface reconstruction, as well as measures several volume and surface-based morphological MRI features.
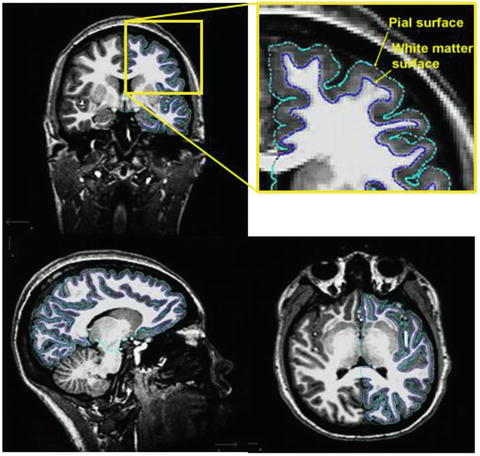
Fig. 7.1
T1-weighted 3D anatomical MRI scan with imaging sequence optimized for gray-white matter contrast. Automated tracing of white matter (green) and pial (blue) surfaces
Applications of Surface-Based Methods in Epilepsy
Consistent with VBM studies, surface-based methods have identified widespread neocortical abnormalities associated with mesial temporal lobe epilepsy (MTLE), particularly cortical thinning of the frontal and lateral temporal regions (Lin et al., 2007; McDonald et al., 2008b). Greater asymmetries in cortical thickness have been observed in the medial temporal cortex of MTLE patients relative to controls, with more abnormalities in the regions ipsilateral to the seizure focus (Bernhardt et al., 2008; Lin et al., 2007; McDonald et al., 2008b). Ipsilateral abnormalities are also apparent in frontal regions (Bernhardt et al., 2008). However, both cortical thinning and reduction in cortical complexity are found in bilateral extratemporal regions, even in the case of unilateral seizure foci (Lin et al., 2007). Interestingly, differential patterns of neocortical thinning are observed in TLE with MTS (TLE-MTS) and TLE without MTS (TLE-no), with more thinning in the inferior medial and posterior temporal regions in TLE-MTS and more thinning in lateral temporal and opercular regions in TLE-no (Mueller et al., 2009). This suggests that surface features can help to distinguish whether differential epileptogenic networks might be involved in TLE with and without MTS. An exciting area for further research would be to determine whether there is a relationship between these differential patterns of cortical thinning and different patterns of performance on neuropsychological tests (e.g., greater memory deficits associated with MTS and greater word-finding difficulties associated with MTS-no).
Studies on the relationship between surface-based measures of neocortical abnormalities and cognitive dysfunction in TLE are only beginning to emerge. A relationship between cortical thinning and general cognitive phenotypical patterns has been recently demonstrated. Increasing abnormalities in temporal and extratemporal cortical thickness were found to distinguish between different cognitive phenotypes (minimally impaired; memory impaired; memory, executive function, and speed impaired) in a stepwise fashion, with the most cognitively impaired group demonstrating the most significant cortical thinning (Dabbs, Jones, Seidenberg, & Hermann, 2009).
Also consistent with VBM studies, surface-based methods can be used to detect cortical abnormalities associated with MCDs. Surface-based methods have identified that areas of focal cortical dysplasia can be preferentially located at the bottom of abnormally deep sulci (Besson, Andermann, Dubeau, & Bernasconi, 2008), a finding which may be used to direct the search for developmental abnormalities, particularly when MRI features are only mildly abnormal or absent. Uniquely, surface-based methods can characterize subtle surface features, such as cortical thickening, blurred gray-white matter boundary, and hyperintense T1 signal (Besson, Bernasconi, Colliot, Evans, & Bernasconi, 2008). These characteristic features, particularly in combination, can be used to detect subtle abnormalities that escape visual detection. Figure 7.2 shows an example of a 38-year-old female patient who had suffered from epilepsy all her life. Several past MRIs showed no sign of a focal lesion until she was referred to our epilepsy center, and a small T2-FLAIR abnormality was discovered in her right mesial frontal lobe. Quantitative comparison revealed significant thickening and blurring in the same region, imaging features consistent with focal cortical dysplasia. The epileptogenic character of the region was subsequently confirmed by intracranial electrophysiology, as well as pathology and outcome after resection.
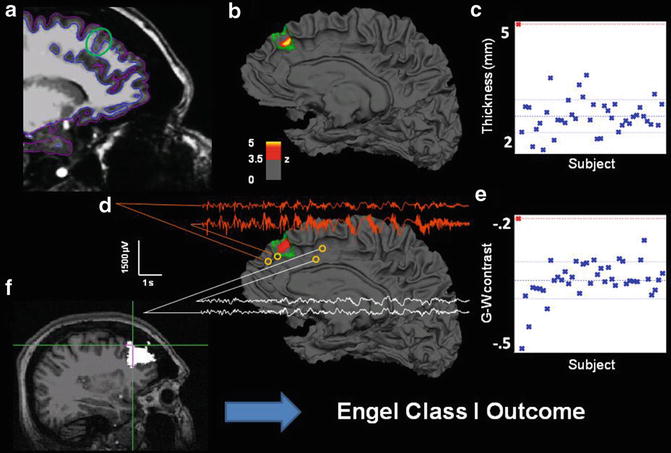
Fig. 7.2
Multimodal results for Patient 4. (a) Sagittal T1 with pial and white matter surface tracings used for calculating cortical thickness and G-W contrast. Green circle marks area of visually identified focal cortical dysplasia. (b) Patient’s reconstructed white matter surface with area of significant cortical thickening marked in red/yellow (z > 3.5, cluster corrected) within the expert-delineated lesion margin (green tracing). (c) Mean cortical thickness of the true positive cluster for patient (red cross, top left) and all normal control subjects in blue. (d) Same as b, but for gray-white matter contrast. The significant cluster shows an area of significant blurring of the gray-white matter junction. EEG traces from intracranial electrodes near the dysplastic area showing focal interictal and ictal discharges (orange), compared to slightly more distant electrode locations (white), showing a co-localization of detected lesion and pathological electrophysiology. (e) Mean gray-white matter contrast for the single patient and all control subjects. More positive values denote increased gray-white boundary blurring. (f) Resected area after surgery (in white). Cross hair marks area of maximum thickness increase within the detected lesion. This patient is seizure-free 1 year after surgery
Subcortical Segmentation
Surface-based coordinate systems are appropriate for registration of cortical structures; however, different methods are necessary for alignment and intersubject averaging of white matter and subcortical gray matter structures. Automated segmentation tools for obtaining subcortical volumetric information involve shape and image intensity characteristics. Widely used software packages that perform automatic segmentation and volume calculations for various subcortical structures (such as hippocampus, amygdala, thalamus, caudate, etc.) include Harvard’s FreeSurfer and Oxford’s FIRST. Both programs require a good-quality, high-resolution T1-weigthed MPRAGE scan as input and function with only minimal manual intervention.
Applications of Automatic Segmentation in Epilepsy
Automatic subcortical segmentation methods have had as high as a 74 % accuracy rate in the lateralization of epilepsy through hippocampal volumetric comparisons, compared to 78 % with manual segmentation methods (Akhondi-Asl, Jafari-Khouzani, Elisevich, & Soltanian-Zadeh, 2010). Reductions in hippocampal volumes ipsilateral to seizure focus in MTLE have been identified, along with bilateral reductions in thalamic and cerebellar gray matter volumes (McDonald et al., 2008a). Some companies, like San Diego-based CorTechs, Inc., offer FDA-approved user-friendly processing and visualization of quantitative MRI morphometry with automatic report generation, which are reimbursable by insurance companies. An example where quantitative analysis offered increased accuracy compared to visual inspection alone is shown by a patient evaluated at our center for presurgical evaluation and who had undergone a full epilepsy MRI protocol. The clinical MRI report indicated right hippocampal atrophy. However, when a subcortical segmentation was performed and the patient’s hippocampal volumes were compared to 40 normal controls, it was evident that both hippocampi were severely atrophied, with more atrophy seen in the right hemisphere (Fig. 7.3).
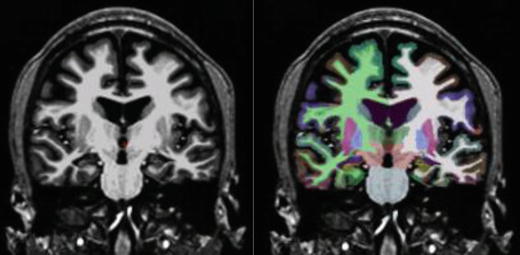
Fig. 7.3
Subcortical segmentation of a patient with bilateral HC atrophy. MRI volumetry revealed: left HC volume = 1,731 mm3, right HC = 1,790 mm3, left HC volume = −5.61, and right HC volume = −7.74. SDs below age-matched control volumes
Diffusion Tensor Imaging
DTI allows the measurement of fiber tracts in the brain by calculating water diffusion. Water molecules diffuse more easily along structures and thus showing larger anisotropy on diffusion scans where white matter tracts are present. The most widely used index in DTI, fractional anisotropy (FA), is expressed in values between 0 and 1, with higher anisotropy occurring in white matter and the corpus callosum and lower values in cerebrospinal fluid and gray matter. FA is often used in studies as a measure of white matter integrity. Tractography is more limited in the vicinity of mesiotemporal and neocortical regions, where fibers are of smaller diameter, have more branching, and are more likely to cross, increasing the difficulty of determining directionality. Methods are being developed to correct for this by improved partial volume corrections and calculation of secondary fiber directions.
Applications of DTI in Epilepsy
A general decrease in white matter volume in chronic TLE has been well documented; however, DTI allows for the investigation of specific fiber tract integrity. Bilateral symmetrical reduction in fractional anisotropy (FA) is observed in the fornix and cingulum of patients with TLE (Concha, Beaulieu, & Gross, 2005), as well as frontotemporal white matter tracts (arcuate fasciculus and uncinate fasciculus) (Lin, Riley, Juranek, & Cramer, 2008; Matsumoto et al., 2008; Rodrigo et al., 2007), temporal-occipital connections (inferior longitudinal fasciculus), frontal-occipital connections (inferior frontal-occipital fasciculus) (Ahmadi et al., 2009), and the corpus callosum (Arfanakis et al., 2002; Concha, Beaulieu, Collins, & Gross, 2009). Patients with left TLE have greater, more diffuse changes in FA values across multiple fiber tracts, whereas patients with right TLE showed changes that are primarily ipsilateral to the side of seizure onset (Ahmadi et al., 2009).
Consistent with cortical abnormalities found in TLE, whole-brain voxelwise analysis of DTI data has revealed extensive bilateral white matter diffusion abnormalities in the frontal and temporal lobes, with more involvement in the hemisphere ipsilateral to seizure onset (Shon et al., 2010; Thivard et al., 2005). In TLE patients with left- and right-sided resective surgery, widespread tract degradation was observed in the uncinate fasciculus, the fronto-occipital fasciculus, the superior longitudinal fasciculus, the corpus callosum, and the corticospinal tract (Schoene-Bake et al., 2009). Furthermore, tract degradation has been shown to be associated with memory and language impairments in TLE patients (McDonald et al., 2008), suggesting that DTI can provide important information for predicting cognitive status in individuals with epilepsy (Table 7.2).
Table 7.2
Software packages for structural MRI analysis
Method | Software package | Web site | |
|---|---|---|---|
VBM | |||
SPM | Free | ||
FSLVBM | Free | ||
Jena VBM | Related posts: Evaluation and Management of Psychogenic Nonepileptic Attacks
Neuropsychological Evaluation of the Epilepsy Surgical Candidate
The Wada Test: Current Perspectives and Applications
Psychotherapeutic and Cognitive Remediation Approaches
Developmentally Delayed Children and Adults
Neuropsychological Assessment of Patients with Epilepsy Evaluation and Management of Psychogenic Nonepileptic Attacks
Neuropsychological Evaluation of the Epilepsy Surgical Candidate
The Wada Test: Current Perspectives and Applications
Psychotherapeutic and Cognitive Remediation Approaches
Developmentally Delayed Children and Adults
Neuropsychological Assessment of Patients with Epilepsy
Stay updated, free articles. Join our Telegram channel
Full access? Get Clinical Tree
 Get Clinical Tree app for offline access

| ||