Hearing
To hear is to feel the touch of vibration in the air, so that its transduction mechanisms are not so very different from those of the somatosensory system. But to obtain and analyse information about stimuli as rapid as sound waves, very specialized neural mechanisms have had to evolve inside the inner ear. To appreciate them you need first to understand the sound waves themselves, a topic that regrettably often seems to get squeezed out of the school physics curriculum. 
The nature of sound
Sound is generated in a medium such as air whenever there is a sufficiently rapid movement of part of its boundary – perhaps a moving loudspeaker cone, or the collapsing skin of a pricked balloon. What happens is that the air next to the moving boundary is rapidly compressed or rarefied, resulting in a local movement of molecules that tends to make the pressure differences propagate away from the original site of disturbance, at a rate that depends on the density and elastic properties of the medium. This velocity v is around 340 m/s in air, and about four times as great in water. If the original sound source is undergoing regular oscillation at a frequency f – like the prongs of a tuning fork – the sound is propagated in the form of regular waves of pressure. Their wavelength, λ – the distance from one point of maximum compression to the next – is given by their velocity divided by their frequency, or v/f. Pitch is the sensory perception that corresponds with frequency, just as colour corresponds with the wavelength of a light, but there is not always an absolutely direct relationship between the two.
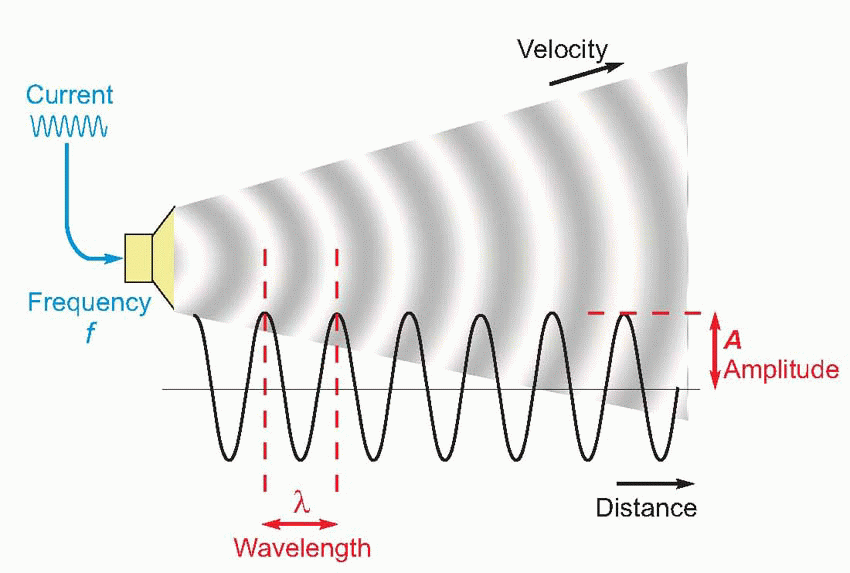 |
Strictly speaking, not all vibrations of this kind are sound; to be audible, the frequency must lie somewhere between about 20 and 20 000 Hz. The simplest of all vibrations are those in which the variations of pressure along the wave are sinusoidal as a function of time, in other words proportional to sin(2Πft), where t is the lapsed time. In such a case we may describe the wave completely by means of its frequency and its amplitude, A, the value of the additional pressure at the peak of compression. We can also talk about the period of the wave, the time taken for one whole cycle (= 1/f).
The intensity of sounds
Sound waves also carry energy: the rate at which energy is delivered per unit area, the intensity of the sound, is proportional to the square of its amplitude, and also to the density of the medium. In addition it increases with the square of the frequency: it obviously takes more energy to move something backwards and forwards very fast than if it is done more slowly. Because the range of intensities to which the ear can respond without damage is a very large one indeed – a factor of some 1014 – it is convenient to use a logarithmic scale to describe sound intensities. For this purpose, a standard reference level is used (its value being near the threshold of hearing under ideal conditions, 10-12 Wm-2), and the log of the ratio of the actual intensity to this standard gives the intensity of the sound in Bels (named after Alexander Graham Bell, an inventor of the telephone). In practice, the unfortunate custom has grown up of dealing in tenths of a Bel, or decibels (dB), so that the formula becomes:

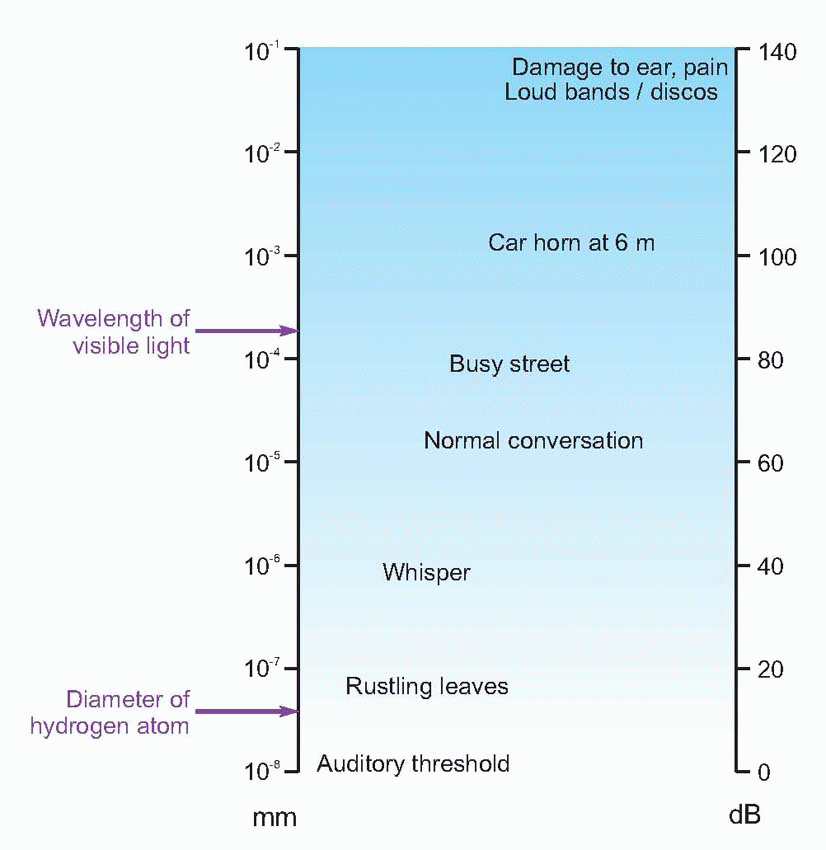 |
The chart above shows the intensity of some common kinds of sound, expressed in decibels and also in terms of the approximate distance moved by the air molecules. The standard threshold of 10-12 Wm-2 corresponds to a movement of the air molecules of some 10-11 m – considerably less than the diameter of a hydrogen atom.  A tricky point is that because intensity is proportional to the square of the amplitude, multiplying the latter by a factor of 10 results in a 20 dB increase in intensity.
A tricky point is that because intensity is proportional to the square of the amplitude, multiplying the latter by a factor of 10 results in a 20 dB increase in intensity.Finally, although the measure defined above is an absolute scale of intensity, decibels can also be used to compare two intensities: thus if one sound has one-tenth the intensity of another, it can be described as having a relative intensity of -10 dB, or as being attenuated by 10 dB.
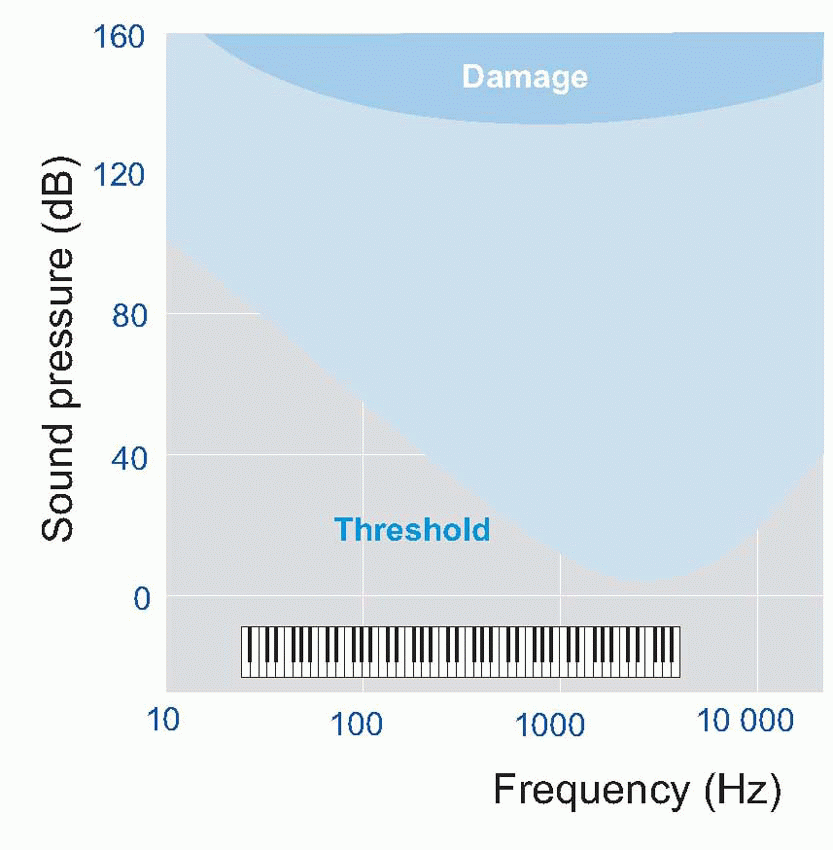
The auditory threshold depends very markedly on frequency; a graph of measurements of threshold for a sine wave as a function of frequency is called an audiometric curve, and often has clinical diagnostic value: the shaded area in the idealized curve above represents an average over many subjects – the piano keyboard may help relate the frequency scale to ordinary musical pitch.
 |
Phase
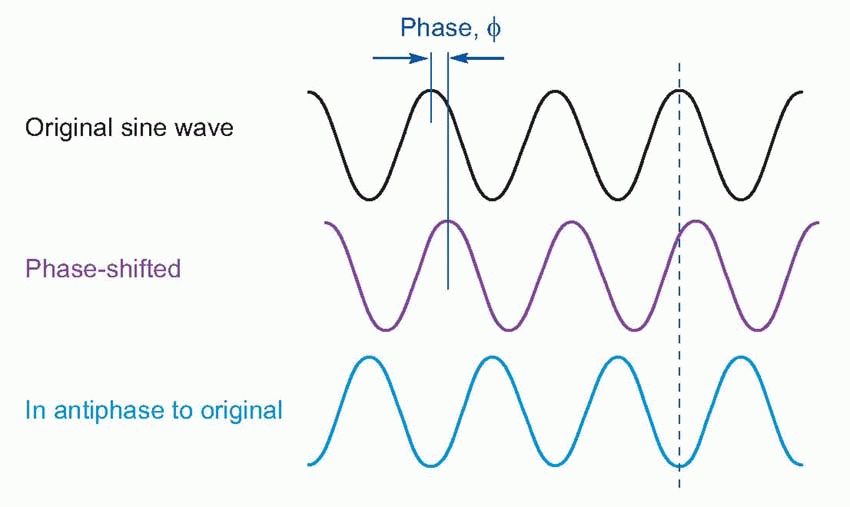
One other parameter that is necessary to describe a sinusoidal vibration in certain circumstances is its phase. A sinusoidal wave of constant amplitude and frequency that is sampled simultaneously at two fixed points in space – as for example by the two ears – will by definition have the same amplitude and frequency at each point, but the peak pressure at one point will not occur at the same moment as at another point because of the time delay. In general, one wave will appear to be displaced in time with respect to the other, and the phase difference between the two is a measure of the fraction of a whole cycle by which it appears to be shifted. It is conveniently expressed as an angle, so that a phase shift of 180° brings the waves into antiphase, the peaks of one then corresponding to the troughs of the other, and a further 180° shift, making 360° (or 0°) in all, brings them back into coincidence.
 |
Sound spectra
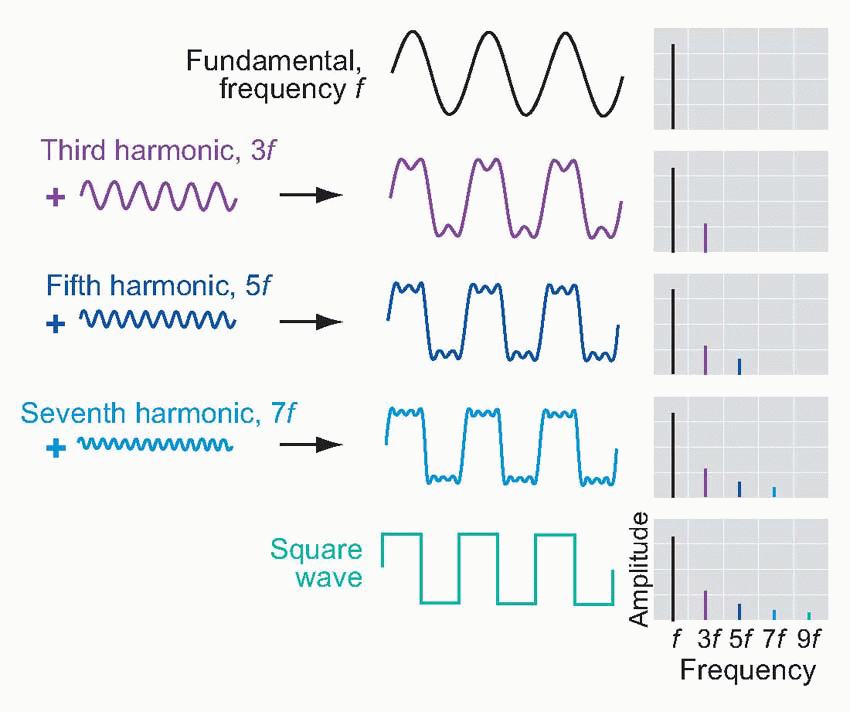
Pure sinusoidal waves are actually rather uncommon in real life: musical instruments, for example, produce waves whose profile, though repetitive, is not sinusoidal. However, over 200 years ago the French mathematician Fourier proved that every repetitive waveform can be decomposed into a set of simple sinusoidal components, whose frequencies are integral multiples of the frequency (fundamental frequency) of the original wave, that will recreate the original waveform if added together. For instance a square wave of frequency f can be synthesized by adding together sine waves of frequency f, 3f, 5f, 7f and so on, with amplitudes in proportion to 1, 1/3, 1/5, 1/7, etc. A recipe of this kind can be represented graphically
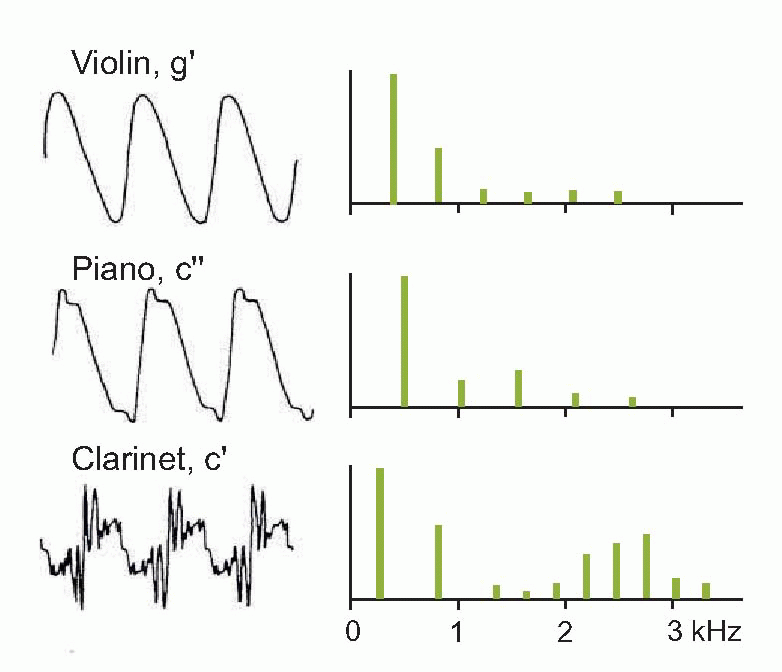
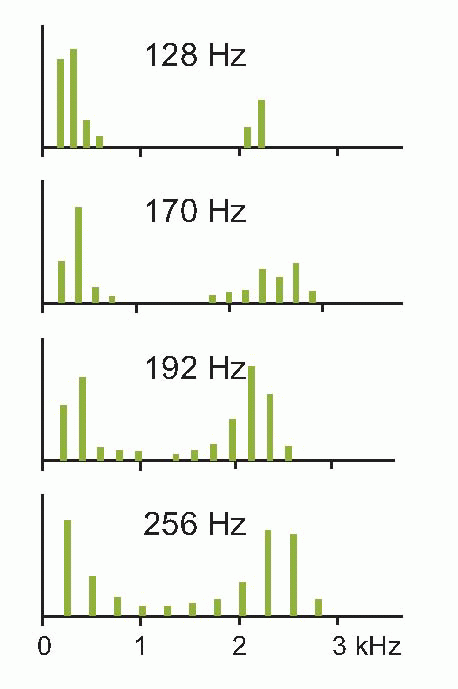
in the form of a Fourier spectrum (as on the right) that shows, as a function of frequency, the amplitude of each of the components (harmonics) that make it up (a complete spectrum would show the phase of each harmonic as well, but in practice the phase information is often omitted, for reasons that will become apparent later). The figure below shows the sound spectra of different kinds of musical instrument: in each case, the spectral line of lowest frequency shows the amplitude of the fundamental, and those of higher frequency show the amplitudes of the harmonics. The Fourier spectrum and the shape of the waveform itself are thus in a sense interchangeable: each contains the same information as the other. If we know the spectrum, we can add all the components together and recreate the original waveform, and conversely it is possible by a process of Fourier analysis to translate any given waveform into its equivalent spectrum.


in the form of a Fourier spectrum (as on the right) that shows, as a function of frequency, the amplitude of each of the components (harmonics) that make it up (a complete spectrum would show the phase of each harmonic as well, but in practice the phase information is often omitted, for reasons that will become apparent later). The figure below shows the sound spectra of different kinds of musical instrument: in each case, the spectral line of lowest frequency shows the amplitude of the fundamental, and those of higher frequency show the amplitudes of the harmonics. The Fourier spectrum and the shape of the waveform itself are thus in a sense interchangeable: each contains the same information as the other. If we know the spectrum, we can add all the components together and recreate the original waveform, and conversely it is possible by a process of Fourier analysis to translate any given waveform into its equivalent spectrum.
 |
 |
Furthermore, it turns out that Fourier analysis can even be applied to waveforms that are not repetitive: unpitched continuous sounds like that of a boiling kettle, or transients of the kind produced by dropping a teapot. To see why this is so, consider what happens if you continuously lower the frequency of a repetitive waveform of given shape. Since the individual components of the spectrum are spaced out on the frequency axis by f, the fundamental frequency, as you lower the frequency, f gets smaller, and the lines of the spectrum get closer and closer. In the limit, when the frequency of the wave becomes zero – in other words when its wavelength is infinite, and it never repeats itself at all – the spectral components are infinitely close together: so the spectrum, instead of being a sequence of discontinuous spikes, is now a smooth curve. Thus repetitive waveforms give rise to spectra with discrete harmonics, whereas unrepetitive waveforms produce continuous spectra. In either case, it turns out that the quality of a sound – for example the timbre of a musical instrument – is much more closely related to the overall shape of its spectrum than to the shape of its waveform. Musical instruments with lots of high harmonics sound bright and strident (trumpets, clarinets);  those with most of their energy in the fundamental sound smoother and more rounded. Sharp sounds, hisses, clicks, all have continuous spectra with prominent high frequencies (the only difference between a hiss and a click is in fact in the phase relationships of its components), whereas thumps, roars and rumbles have their energy concentrated at the low-frequency end.
those with most of their energy in the fundamental sound smoother and more rounded. Sharp sounds, hisses, clicks, all have continuous spectra with prominent high frequencies (the only difference between a hiss and a click is in fact in the phase relationships of its components), whereas thumps, roars and rumbles have their energy concentrated at the low-frequency end. To summarize, we have two different and largely independent psychological sensations that arise from a sound, that are closely related to two different aspects of the sound’s spectrum. On the one hand, pitch depends on the fundamental frequency: two instruments may have spectra of entirely different shapes but will be recognized as playing the same note if their fundamental frequencies are identical (and sounds like bangs and hisses with continuous spectra have no pitch at all). Timbre on the other hand is governed entirely by the overall shape of the spectrum, regardless of the fundamental frequency; an oboe playing a succession of different notes is still recognizably the same instrument, because the general shape of its spectrum remains essentially unchanged. Together, these two characteristics provide important information about the object that gave rise to the sound in the first place. The fundamental frequency tells us about its size: large objects generate lower frequencies. Timbre on the other hand tells us something about its shape: smooth, round objects produce fewer harmonics, generating a smoother, rounder sound. These factors are very obvious if you compare the appearance of different musical instruments with how they sound, for example a tuba and a triangle.
The human voice
One of the most striking examples of the use of sound spectra comes from studying the human voice.  The larynx, isolated from the rest of the voice-producing apparatus of head and throat, is essentially not very different from the double reed of an instrument like the
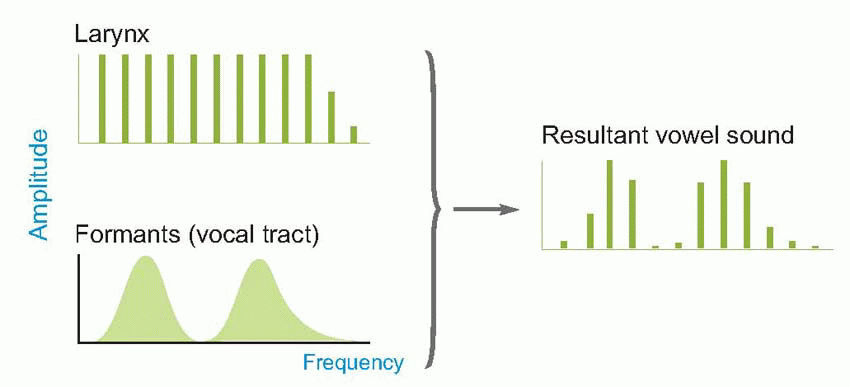
oboe. As the air passes between the vocal cords, alternately they are forced apart and spring back, producing a repetitive series of compressions and rarefactions whose frequency can be modified by altering the shape and tension of the cords themselves; the resultant spectrum is roughly of the quite flat form shown below at top left. But in real life, the sounds it produces have to pass through a number of hollow cavities – the throat, nose and mouth – before they reach the outside world. These cavities tend to resonate, absorbing certain frequencies and reinforcing others, so that the original sound spectrum becomes distorted, as can be seen on the right. The two or three main resonance peaks in this spectrum simply reflect the fact that the tongue effectively divides the mouth cavity into separate compartments, and each compartment acts as an independent resonator, at a frequency that depends mainly on the shape of the tongue and the degree of jaw opening. What is striking is that different vowel sounds are associated in a closely reproducible way with particular positions of these resonant peaks (called formants), as can be seen below. These characteristics are largely independent of the speaker, the pitch of their voice, and whether the vowel is spoken or sung: yet the waveforms produced by different speakers pronouncing the same vowel are generally very different. In other words, it seems that vowels are recognized, independently of the quality of the voice or its pitch, by the overall shape of the spectrum and not by the shape of the wave itself. It is the frequency of the fundamental that produces the sense of the pitch of the voice, and very often conveys information in its own right (as in the different emphasis in ‘I love you’ and ‘I love you’), particularly of an emotional nature. The spectra below show the vowel sound in ‘EAT’ sung at different pitches: the resonance pattern remains identical, but the spacing between the harmonics increases as the fundamental frequency rises.
The larynx, isolated from the rest of the voice-producing apparatus of head and throat, is essentially not very different from the double reed of an instrument like the oboe. As the air passes between the vocal cords, alternately they are forced apart and spring back, producing a repetitive series of compressions and rarefactions whose frequency can be modified by altering the shape and tension of the cords themselves; the resultant spectrum is roughly of the quite flat form shown below at top left. But in real life, the sounds it produces have to pass through a number of hollow cavities – the throat, nose and mouth – before they reach the outside world. These cavities tend to resonate, absorbing certain frequencies and reinforcing others, so that the original sound spectrum becomes distorted, as can be seen on the right. The two or three main resonance peaks in this spectrum simply reflect the fact that the tongue effectively divides the mouth cavity into separate compartments, and each compartment acts as an independent resonator, at a frequency that depends mainly on the shape of the tongue and the degree of jaw opening. What is striking is that different vowel sounds are associated in a closely reproducible way with particular positions of these resonant peaks (called formants), as can be seen below. These characteristics are largely independent of the speaker, the pitch of their voice, and whether the vowel is spoken or sung: yet the waveforms produced by different speakers pronouncing the same vowel are generally very different. In other words, it seems that vowels are recognized, independently of the quality of the voice or its pitch, by the overall shape of the spectrum and not by the shape of the wave itself. It is the frequency of the fundamental that produces the sense of the pitch of the voice, and very often conveys information in its own right (as in the different emphasis in ‘I love you’ and ‘I love you’), particularly of an emotional nature. The spectra below show the vowel sound in ‘EAT’ sung at different pitches: the resonance pattern remains identical, but the spacing between the harmonics increases as the fundamental frequency rises.
 |
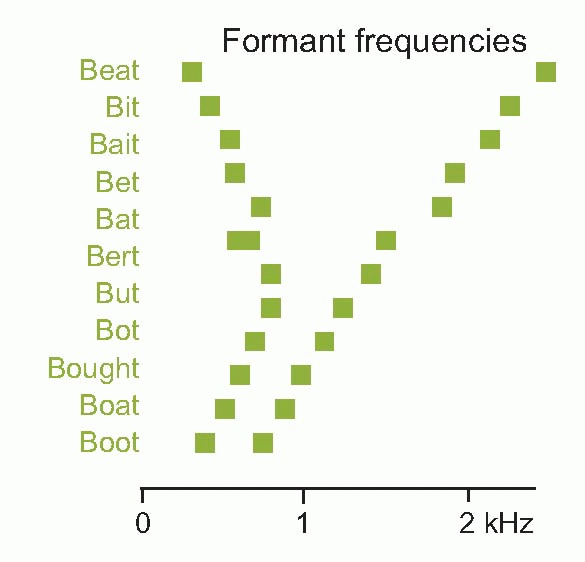 |
Table 6.1 Information carried by sound waves | |||||||||||||||
|---|---|---|---|---|---|---|---|---|---|---|---|---|---|---|---|
|
 |
Finally, it seems to be the fine structure of the spectrum, the little bumps and hollows on it that are the results of idiosyncrasies of the way our own particular mouths and throats are constructed, that enable us to differentiate one speaker from another. It turns out, as we shall see, that almost the first thing the ear does to the sound waves it receives is to Fourier-analyse them, and the pattern of activity of the fibres of the auditory nerve is – at least for medium and high frequencies – in effect a representation of the spectrum of the sound that is heard: only at low frequencies is information about the actual shape of the waveform available to the brain (Table 6.1). Uniquely
among all the senses, most of this analysis has already been done before the stimulus has reached the receptors.
among all the senses, most of this analysis has already been done before the stimulus has reached the receptors.
The structure of the ear
External and middle ear
The visible external ear, or pinna, has little effect on incoming sound except for colouring it by superimposing little idiosyncratic resonances on it in the high-frequency region that are dependent on the direction from which the sound is coming and can, as will be described later, provide quite accurate information about the position of a sound source. The auditory canal, the external meatus, similarly does little in Man except to add its own rather broad resonance peak around 3000 Hz. In other animals with less vestigial pinnae, they may have a more significant part to play in gathering sound, and if movable can provide a great deal more information about where a sound is coming from.
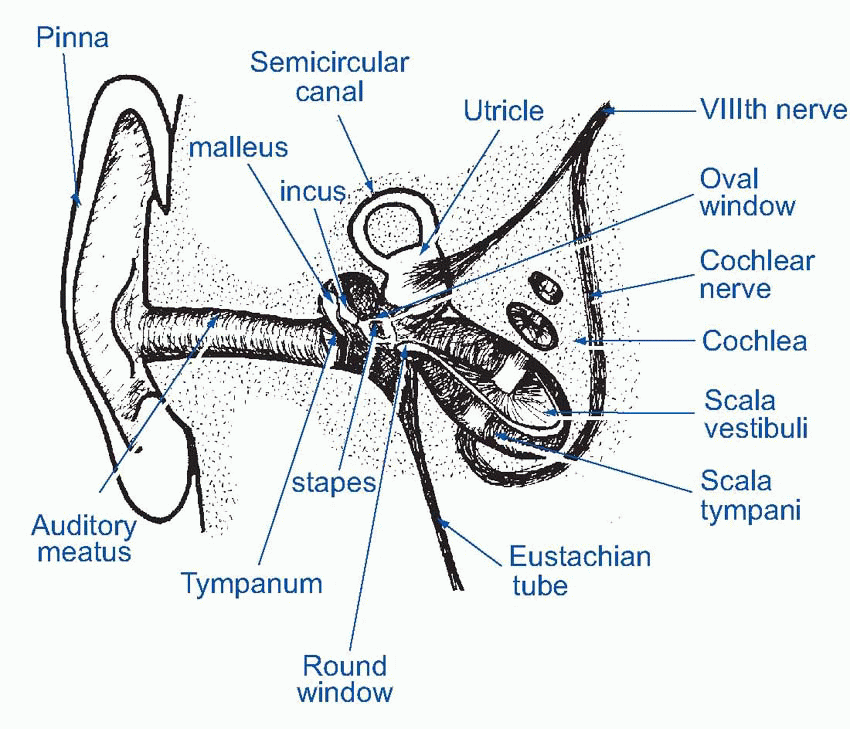
At the end of the meatus, the sound impinges on the eardrum (tympanic membrane in Medispeak) that separates the outer ear from the middle ear. On the inner side, the tympanic membrane is attached to the malleus (‘hammer’), the first of a set of three tiny bones, the ossicles, whose function is to transform vibrations of the eardrum into vibrations of the fluids that fill the inner ear. The malleus is joined to the incus (‘anvil’) which in turn bears on the stapes (‘stirrup’), whose footplate rests on the oval window, a membrane separating the middle and inner ears. This chain of ossicles acts as a kind of lever system, converting the movements of the eardrum, which are of comparatively large amplitude but small force, into the smaller but more powerful movements of the oval window; this increase in the pressure of the vibrations is further enhanced by the fact that the tympanic membrane is much larger in area than the oval window. Thus the amplitude is reduced by a factor of around 18, and force increased by the same amount.
 |
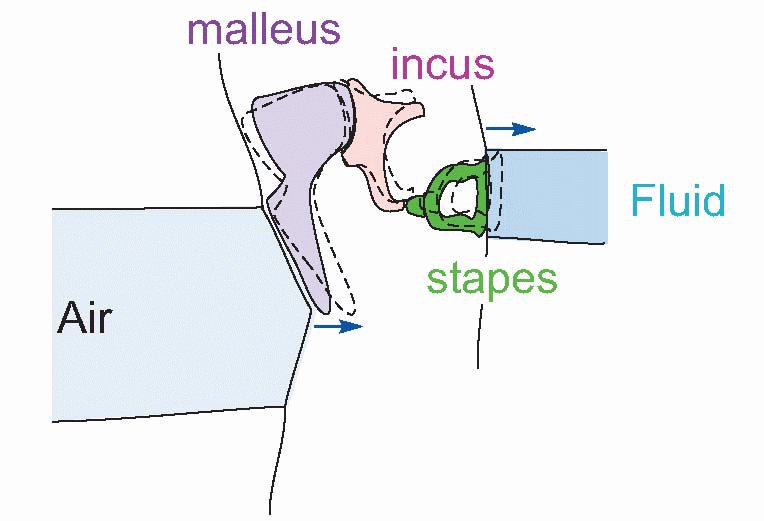 |
The reason why this transformation is necessary – it is not amplification, for like all passive systems it cannot increase the energy of the waves that are transmitted – is because the fluid of the inner ear is very much denser than air. If a sound wave in air strikes a dense medium like water, the pressure changes of the air are too small to make more than a slight impression on the fluid, and most of the sound is reflected back. To ensure the most efficient transfer of energy from air to fluid, we need some way of increasing the pressure changes in the sound wave to match the characteristics of the new medium, and this impedance matching appears to be the primary function of the middle ear; without it, only some 0.1 per cent of the sound energy reaching the eardrum would reach the inner ear.
A second function of the middle ear is that it is capable of acting as a kind of censor: it contains muscles – the tensor tympani and stapedius – that effectively disable the transmission system when they contract, protecting the inner ear from damagingly powerful sounds.  In addition to all this, the middle ear also further shapes the audiometric spectrum, mostly by reducing low-frequency sensitivity.
In addition to all this, the middle ear also further shapes the audiometric spectrum, mostly by reducing low-frequency sensitivity.Inner ear
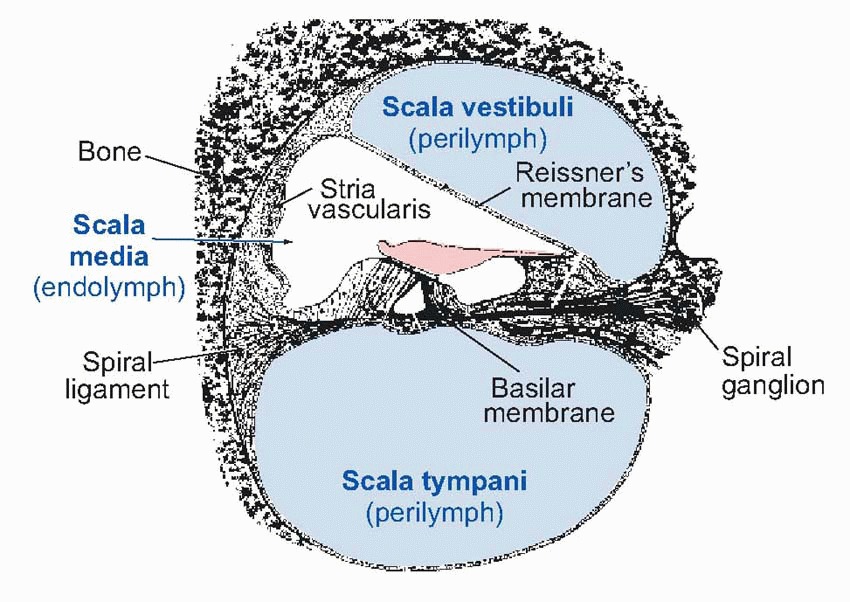
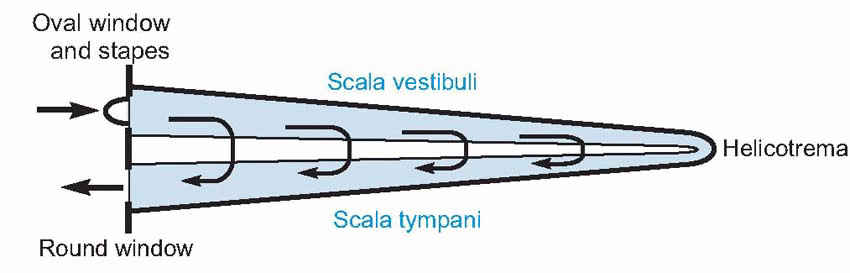
The inner ear is a component of the labyrinth, described in Chapter 5; the part of it that is concerned with sensing sounds is the cochlea, in effect an elongated sac of endolymph some 35 mm long, shaped as if it had been pushed sideways into a corresponding tube of perilymph, rather like the sausage in a hot dog. The upper half of the perilymph is called the scala vestibuli, the lower is the scala tympani, and the endolymphatic sausage is the scala media. At the far end of this structure, the two perilymphatic regions join up through an opening called the helicotrema; and finally the whole thing is rolled up into a conical spiral, giving it the shape of a snail shell. The scala vestibuli and scala media are separated by only a very thin membrane, Reissner’s membrane, while the boundary between scala media and scala tympani is much more complicated and contains several layers of cells, including the receptors themselves, resting on the basilar membrane.
 |
The oval window faces onto the scala vestibuli, while a similar structure, the round window, separates the scala tympani from the air of the middle ear. (This air, incidentally, is in communication with the outside atmosphere through the Eustachian tube which joins it to the pharynx; this tube is normally closed, but opens briefly during swallowing and yawning, causing a characteristic modification of one’s hearing: one may get relief in this way from the ear-drum pain sometimes experienced in air travel as a result of pressure differences between the atmosphere and the middle ear.)
Clinical box 6.1 Barotrauma
Changes in ambient air pressure may lead to gradients across the tympanic membrane (or very rarely the oval window), which if significant and unrelieved (e.g. if the Eustachian tube is blocked during hay-fever or a cold) can cause the membrane to rupture. Barotrauma can also result from a blow to the ear.
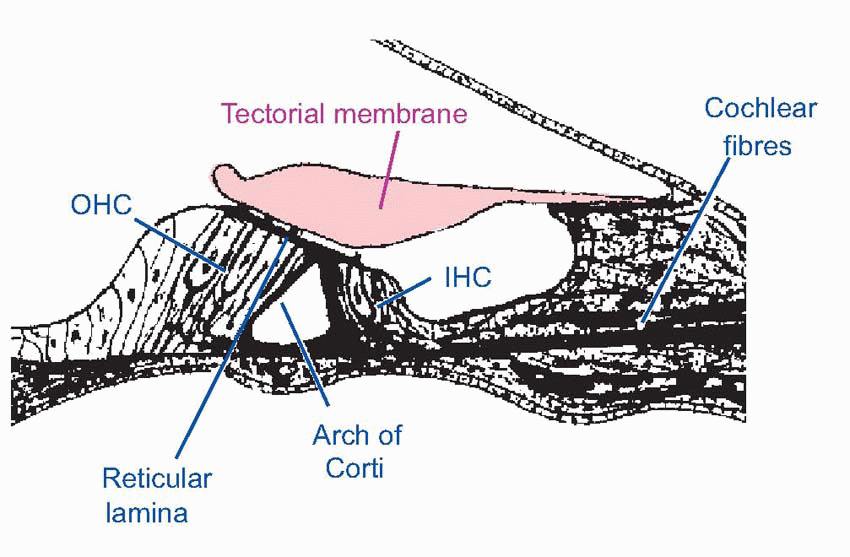
Now endolymph and perilymph are virtually incompressible fluids, so any movements of the oval window must result in corresponding movements of the round window. In other words, sound energy has no option but to pass from the scala vestibuli to the scala tympani, either by crossing through the endolymph, or by travelling right to the end of the cochlea and traversing the helicotrema. In the former case, it will cause the basilar membrane, with all its elaborate superstructure, to vibrate as well. Now the cochlear receptors – the hair cells – are peculiarly well adapted to respond to exceedingly small up-and-down movements of the basilar membrane. Their cell bodies are attached at the bottom to the membrane itself, and at the top to a rigid plate called the reticular lamina, which is in turn attached to a strong and inflexible support called the arch of Corti, that also rests on the basilar membrane. Consequently any movement of the basilar membrane results in an exactly similar displacement of the hair cells. These hair cells are very like the vestibular hair cells described in the previous chapter; they possess a number of stereocilia, arranged this time in a characteristic V- or W-formation and graded in size, but the auditory hair cells of adults do not appear to have kinocilia. The cilia project through holes in the reticular lamina, and in the case of the outer hair cells (OHCs) the tips of the cilia are lightly embedded in the lower surface of the tectorial membrane, a flap of extracellular material analogous to the cupula or otolith, that extends from the inner boundary of the scala media and lies along the top of the inner and outer hair cells. The cilia of the inner hair cells (IHCs) do not appear to make contact with the tectorial membrane, but lie just short of it.
 |
 |
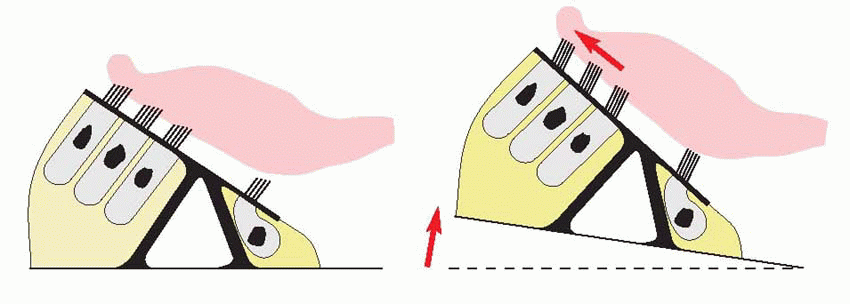
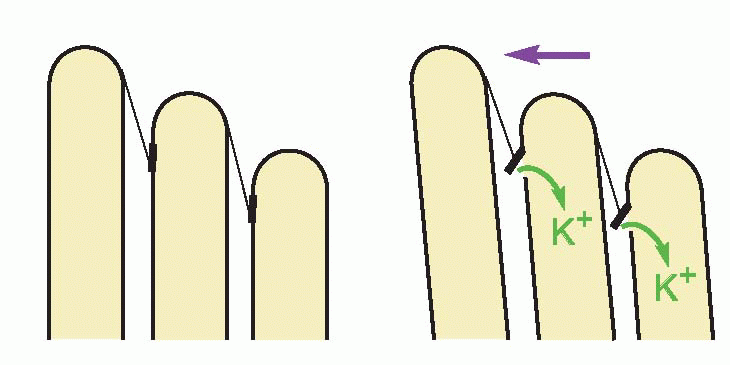
A consequence of the geometry of this arrangement is that any up-and-down movement of the basilar membrane will result in horizontal sliding, or shear, between the reticular membrane and the tectorial membrane. This in turn will bend the cilia of the hair cells through an angle which will be enormously greater than the original deflection of the basilar membrane. There is then a further stage of mechanical amplification: as the cilia bend, protein filaments running from the tip of
one cilium to the tip of its shorter neighbour appear to be directly linked to the opening of membrane channels. Once again, a small angle of ciliary bending will generate a disproportionate mechanical effect. This permeability change gives rise to generator currents that eventually lead to depolarization of the terminal, calcium entry, release of transmitter (glutamate) and stimulation of the auditory fibres.
one cilium to the tip of its shorter neighbour appear to be directly linked to the opening of membrane channels. Once again, a small angle of ciliary bending will generate a disproportionate mechanical effect. This permeability change gives rise to generator currents that eventually lead to depolarization of the terminal, calcium entry, release of transmitter (glutamate) and stimulation of the auditory fibres.
 |
 |
But although it is fairly clear how the cochlea may act as a transducer of sounds into nervous energy, nothing has yet been said about whether it also carries out any analysis of the sound at the same time, in the way that for instance the cones of the retina begin the analysis of colour by responding preferentially to light of different wavelengths. In fact it turns out that different regions along the length of the cochlea are especially responsive to different sound frequencies, providing a rough kind of Fourier analysis of the type described earlier in this chapter. Before going on to discuss the electrophysiological responses of auditory nerve fibres, it is useful first to consider the mechanical properties of the cochlea that enable it to do this.
Cochlear function
Fourier analysis by the cochlea
The physicist and physiologist Hermann von Helmholtz (1821-1894) was the first to appreciate the general way in which sound quality was related to its frequency spectrum. Observing that the basilar membrane gets wider as one approaches the helicotrema, he suggested that it might be the cochlea itself that carried out this Fourier analysis. His notion was that individual transverse fibres of the basilar membrane might act rather like the strings of a piano, tuned to different frequencies and resonating in sympathy whenever their own particular frequency was present in a sound. (If you open the lid of a piano and sing loudly into it with the sustaining pedal depressed so that the strings are undamped, you will hear it sing back to you as particular strings are set into sympathetic vibration: if there were some device that signalled which strings were vibrating and which weren’t, you would have a kind of Fourier analyser.)
Related posts:


Stay updated, free articles. Join our Telegram channel

Full access? Get Clinical Tree


