FIGURE 1.1 Ischemic heart disease (IHD) mortality rate in each decade of age plotted for the usual systolic (A) and diastolic (B) BPs at the start of that decade. Data from almost one million adults in 61 prospective studies. (Modified from Lewington S, Clarke R, Qizilbash N, et al. Age-specific relevance of usual blood pressure to vascular mortality: A meta-analysis of individual data for one million adults in 61 prospective studies. Lancet 2002;360:1903–1913.)
Fortunately, there has been a steadily improving rate of control of hypertension in the U.S. (Table 1-1). However, the rates of adequate control remain lower in both black and Mexican-American men than among non-Hispanic white males in the U.S. (Go et al., 2014). Moreover, the rate of improved control has been slower over the last decade worldwide (Mancia, 2013). And of even greater concern, even when hypertensives are treated down to an optimal level, below 120/80 mm Hg, they continue to suffer a greater risk of stroke than do normotensives with similar optimal BP levels (Asayama et al., 2009).
TABLE 1-1 Trends in Awareness, Treatment, and Control of High Blood Pressure in U.S. Adults (Over Age 20) 1976–2004
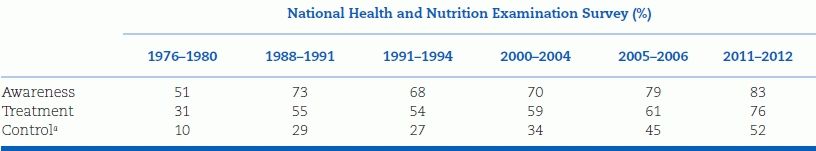
The data are for adults aged 18 and over with systolic pressure ≥140 mm Hg and/or diastolic pressure ≥90 mm Hg.
aControl is defined as a systolic pressure below 140 mm Hg and a diastolic pressure below 90 mm Hg.
Nonetheless, as shown in Figure 1-2, impressive reductions in mortality from both coronary disease and stroke have continued, even if these are largely attributable to improved management after they occur rather than decreases in their incidence (Vaartjes et al., 2013).
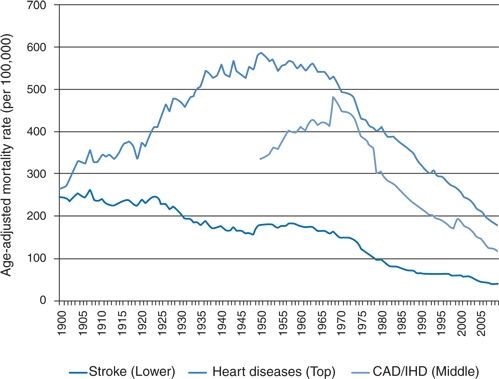
FIGURE 1-2 Stroke and heart disease mortality rates per 100,000 population for the U.S., 1900–2005, standardized to the U.S. 2000 standard population. (Reproduced from Lackland DT, Roccella EJ, Deutsch AF, et al. Factors influencing the decline in stroke mortality: A statement from the American Heart Association/American Stroke Association. Stroke 2014;45(1):315–353.)
On the other hand, the ability to provide protection against stroke and heart attack by antihypertensive therapy in those who have hypertension has been overwhelmingly documented (Blood Pressure Lowering Treatment Trialists’ Collaboration, 2008). There is no longer any argument as to the benefits of lowering BP, though there is insufficient evidence to document the benefit of treating otherwise healthy people with BP from 140/90 to 160/100 mm Hg, i.e., stage 1 hypertension (Diao et al., 2012) giving rise to papers such as “Waste and Harm in the Treatment of Mild Hypertension” (Heath, 2013). Meanwhile, the unraveling of the human genome gave rise to the hope that gene manipulation or transfer could prevent hypertension. As of now, that hope seems extremely unlikely beyond the very small number of patients with monogenetic defects that have been discovered, since at least 28 genes have been shown to contribute to BP variation (Arnett and Claas, 2012).
This book summarizes and analyses the works of thousands of clinicians and investigators worldwide who have advanced our knowledge about the mechanisms behind hypertension and who have provided increasingly effective therapies for its control. Despite their continued efforts, however, hypertension will almost certainly not ever be conquered totally, because it is one of those diseases that, in the words of a Lancet editorialist over 20 years ago (Anonymous, 1993):
…afflict us from middle age onwards [that] might simply represent “unfavorable” genes that have accumulated to express themselves in the second half of our lives. This could never be corrected by any evolutionary pressure, since such pressures act only on the first half of our lives: once we have reproduced, it does not greatly matter that we grow “sans teeth, sans eyes, sans taste, sans everything.”
Since hypertension likely cannot be prevented by genetic manipulations, the need for improvements in lifestyle that would reduce population-wide levels of BP as little as 2 mm Hg such as moderate reduction in sodium (The Executive Board of the World Hypertension League, 2014) would provide major improvements in CV health (Go et al., 2014).
In this chapter, the overall problems of hypertension for the population at large are considered. We define the disease, quantify its prevalence and consequences, classify its types, and describe the current status of detection and control. In the remainder of the book, these generalities will be amplified into practical ways to evaluate and treat hypertension in its various presentations.
CONCEPTUAL DEFINITION OF HYPERTENSION
As seen in Figure 1-1, mortality from IHD begins to rise from the lowest levels recorded in the overall population, 115/75 mm Hg, to a doubling of mortality at 140/90 mm Hg. Therefore, why is “hypertension” universally considered to begin at 140/90 mm Hg? That number apparently arose from actuarial data from the 1920s showing a doubling of mortality from CVD at that level (Society of Actuarials, 1959). The arbitrariness of that view was challenged by Sir George Pickering who decried the search for an arbitrary dividing line between normal and high BP. In 1972, he restated his argument: “There is no dividing line. The relationship between arterial pressure and mortality is quantitative; the higher the pressure, the worse the prognosis.” He viewed arterial pressure “as a quantity and the consequence numerically related to the size of that quantity” (Pickering, 1972).
However, as Pickering realized, physicians feel more secure when dealing with precise criteria, even if the criteria are basically arbitrary. To consider a BP of 138/88 mm Hg as normal and one of 140/90 mm Hg as high is obviously arbitrary, but medical practice requires that some criteria be used to determine the need for workup and therapy. The criteria should be established on some rational basis that includes the risks of disability and death associated with various levels of BP as well as the ability to reduce those risks by lowering the BP. As stated by Rose (1980): “The operational definition of hypertension is the level at which the benefits… of action exceed those of inaction.”
Even this definition should be broadened, because action (i.e., making the diagnosis of hypertension at any level of BP) involves risks and costs as well as benefits, and inaction may provide benefits. These are summarized in Table 1-2. Therefore, the conceptual definition of hypertension should be that level of BP at which the benefits (minus the risks and costs) of action exceed the risks and costs (minus the benefits) of inaction.
TABLE 1-2 Factors Involved in the Conceptual Definition of Hypertension
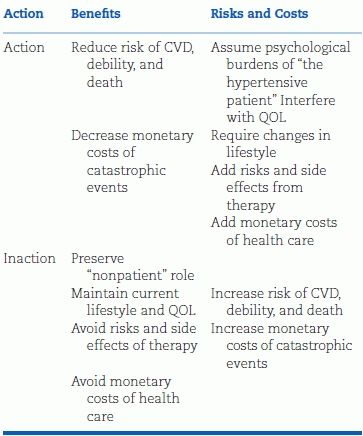
Most elements of this conceptual definition are fairly obvious, although some, such as interference with lifestyle and risks from biochemical side effects of therapy, may not be. Let us turn first to the major consequence of inaction, the increased incidence of premature CVD, because that is the prime, if not the sole, basis for determining the level of BP that is considered abnormal and is called hypertension.
Risks of Inaction: Increased Risk of CVD
The risks of elevated BP have been determined from large-scale epidemiologic surveys. As seen in Figure 1-1, the Prospective Studies Collaboration (Lewington et al., 2002) obtained data on each of 958,074 participants in 61 prospective observational studies of BP and mortality. Over a mean time of 12 years, mortality during each decade of age at death was related to the estimated usual BP at the start of that decade. The relation between usual systolic and diastolic BP and the absolute risk for IHD mortality is shown in Figure 1-1. From ages 40 to 89, each increase of 20 mm Hg systolic BP or 10 mm Hg diastolic BP is associated with a twofold increase in mortality rates from IHD and more than a twofold increase in stroke mortality. These proportional differences in vascular mortality are about half as great in the 80 to 89 decade as they are in the 40 to 49 decade, but the annual absolute increases in risk are considerably greater in the elderly. As is evident from the straight lines in Figure 1-1, there is no evidence of a threshold wherein BP is not directly related to risk down to as low as 115/75 mm Hg.
As the authors conclude: “Not only do the present analyses confirm that there is a continuous relationship with risk throughout the normal range of usual BP, but they demonstrate that within this range the usual BP is even more strongly related to vascular mortality than had previously been supposed.” They conclude that a 10 mm Hg higher than usual systolic BP or 5 mm Hg higher than usual diastolic BP would, in the long term, be associated with about a 40% higher risk of death from stroke and about a 30% higher risk of death from IHD.
These data clearly incriminate levels of BP below the level usually considered as indicative of hypertension, i.e., 140/90 mm Hg or higher. Data from the closely observed participants in the Framingham Heart Study confirm the increased risks of CVD with BP levels previously defined as normal (120 to 129/80 to 84 mm Hg) or high-normal (130 to 139/85 to 89 mm Hg) compared to those with optimal BP (<120/80 mm Hg) (Vasan et al., 2001).
A similar relation between the levels of BP and CVDs has been seen worldwide (Lim et al., 2012) with an even stronger association for stroke (Feigin et al., 2014). Some of these differences in risk and BP levels can be explained by obvious factors such as socioeconomic differences and variable access to health care (Victor et al., 2008; Wilper et al., 2008).
Beyond the essential contribution of BP per se to CV risk, a number of other associations may influence the relationship.
Gender and Risk
The Prospective Studies Collaboration found the age-specific associations of IHD mortality with BP to be slightly greater for women than for men and concluded that “for vascular mortality as a whole, sex is of little relevance” (Lewington et al., 2002). In the U.S., women over age 65 have a higher prevalence of hypertension than do men (Go et al., 2014).
Race and Risk
As shown in Figure 1-3, U.S. blacks tend to have higher rates of hypertension than do nonblacks (Go et al., 2014), and overall hypertension-related mortality rates, particularly for stroke, are higher among blacks (Lackland et al., 2014).
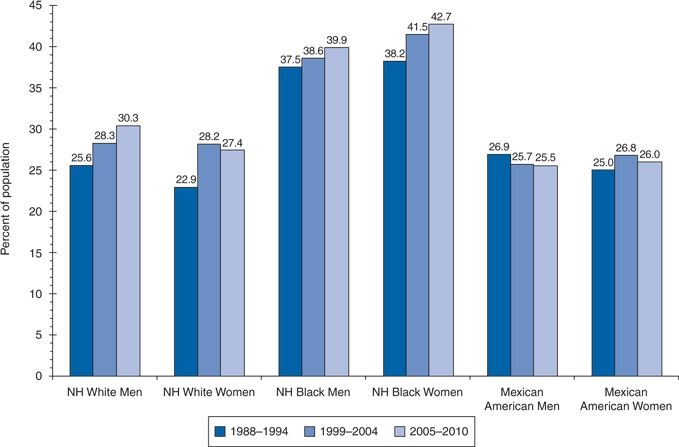
FIGURE 1-3 Age-adjusted prevalence trends for high BP in adults ≥20 years of age by race/ethnicity, sex, and survey (National Health and Nutrition Examination Survey: 1988–1994, 1999–2004, and 2005–2010). NH indicates non-Hispanic. Source: National Center for Health Statics and National Heart, Lung and Blood Institute. On behalf of the American Heart Association Statistics Committee and Stroke Statistics Subcommittee. (From Go AS, Mozaffarian D, Roger VL, et al. Heart disease and stroke statistics—2014 update: A report from the American Heart Association. Circulation 2014;129:e28–e292.)
The greater risk of hypertension among blacks suggests that more attention must be given to even lower levels of hypertension among this group, but there seems little reason to use different criteria to diagnose hypertension in blacks than in whites. The special features of hypertension in blacks are discussed in more detail in Chapter 4.
The relative risk of hypertension differs among other racial groups as well. In particular, hypertension rates in U.S. Hispanics of Mexican origin are lower than those in whites (Go et al., 2014). In keeping with their higher prevalence for obesity and diabetes, U.S. Hispanics have lower rates of control of hypertension than do whites or blacks (Go et al., 2014).
Age and Risk: The Elderly
The number of people older than 65 years is rapidly increasing and, in less than 25 years, one of every five people in the U.S. will be over age 65. Systolic BP rises progressively with age (Go et al., 2014) (Fig. 1-4), and elderly people with hypertension are at greater risk for CVD.
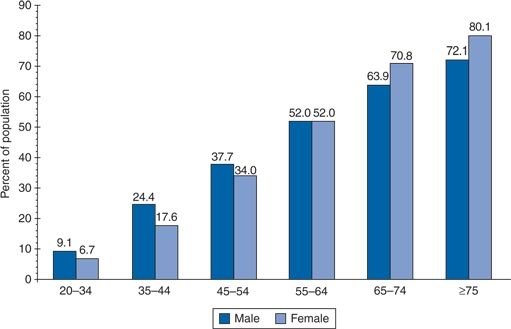
FIGURE 1-4 Prevalence of high BP in adults ≥20 years of age by age and sex (National Health and Nutrition Examination Survey: 2007–2010). Hypertension is defined as systolic BP ≥140 mm Hg or diastolic BP ≥ 90 mm Hg, if the subject said “yes” to taking antihypertensive medication, or if the subject was told on two occasions that he or she had hypertension. Source: National Center for Health Statistics and National Heart, Lung, and Blood Institute. (From Go AS, Mozaffarian D, Roger VL, et al. Heart disease and stroke statistics—2014 update: A report from the American Heart Association. Circulation 2014;129:e28–e292.)
Pulse Pressure
As seen in Figure 1-5, systolic levels rise progressively with age, whereas diastolic levels typically start to fall beyond age 50 (Burt et al., 1995). Both of these changes reflect increased aortic stiffness and pulse-wave velocity with a more rapid return of the reflected pressure waves, as is described in more detail in Chapter 3. It therefore comes as no surprise that the progressively widening of pulse pressure is a prognosticator of CV risk, as both the widening pulse pressure and most of the risk come from the same pathology—atherosclerosis and arteriosclerosis (Protogerou et al., 2013).
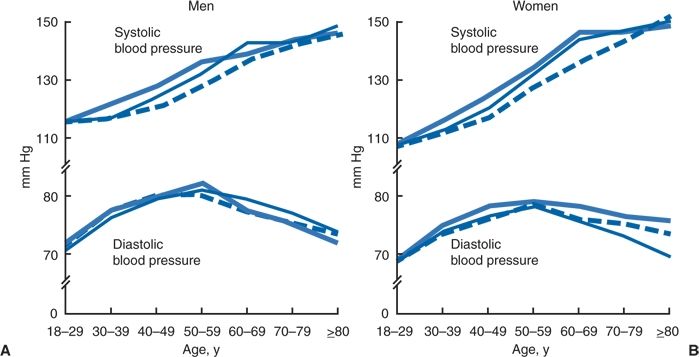
FIGURE 1-5 Mean systolic and diastolic BPs by age and race or ethnicity for men and women in the U.S. population 18 years of age or older. Thick solid line, non-Hispanic blacks; dashed line, non-Hispanic whites; thin solid line, Mexican Americans. Data from the NHANES III survey. (Modified from Burt VL, Whelton P, Roccella EJ, et al. Prevalence of hypertension in the U.S. adult population. Results from the Third National Health and Nutrition Examination Survey, 1988–1991. Hypertension 1995;25:305–313.)
Isolated Systolic Hypertension
As expected from Figure 1-5, most hypertension after age 50 is isolated systolic hypertension (ISH), with a diastolic BP of less than 90 mm Hg. In an analysis based on the NHANES III data, Franklin et al. (2001a) found that ISH was the diagnosis in 65% of all cases of uncontrolled hypertension seen in the entire population and in 80% of patients older than 50. It should be noted that, unlike some reports that define ISH as a systolic BP of 160 mm Hg or greater, Franklin et al. (2001a) appropriately used 140 mm Hg or higher.
ISH in the elderly is associated with increased morbidity and mortality from coronary disease and stroke. However, as older patients develop CVD and cardiac pump function deteriorates, systolic levels often fall and a U-shaped curve of CV mortality becomes obvious: Mortality increases both in those with systolic BP of less than 120 mm Hg and in those with systolic BP of more than 140 mm Hg. Similarly, mortality is higher in those 85 years of age or older if their systolic BP is lower than 140 mm Hg or their diastolic BP is lower than 70 mm Hg, both indicative of poor overall health (van Bemmel et al., 2006).
Isolated Diastolic Hypertension
In people under age 45, ISH is exceedingly rare, but isolated diastolic hypertension (IDH), i.e., systolic below 140 mm Hg and diastolic 90 mm Hg or higher, may be found in 20% or more (Franklin et al., 2001a). Peters et al. (2013) found a 30% increased CV mortality compared with normotensive patients among 850 subjects with even transient IDH who were followed for 29 years and Niiranen et al. (2014) observed a 1.95 relative hazard of CV events compared with normotensives among 114 subjects with IDH identified by home BP measurements over an 11.2 year follow-up. Therefore, patients with IDH should be given antihypertensive therapy to reduce their CV risks.
Relative Versus Absolute Risk
The risks of elevated BP are often presented as relative to risks found with lower levels of BP. This way of looking at risk tends to exaggerate its degree as seen in Figure 1-6. When the associations among various levels of BP to the risk of having a stroke were examined in a total of 450,000 patients followed up for 5 to 30 years, there was a clear increase in stroke risk with increasing levels of diastolic BP (Prospective Studies Collaboration, 1995). In relative terms, the increase in risk was much greater in the younger group (<45 years), going from 0.2 to 1.9, which is almost a 10-fold increase in relative risk compared to the less than twofold increase in the older group (10.0 to 18.4). But, it is obvious that the absolute risk is much greater in the elderly, with 8.4% (18.4 to 10.0) more having a stroke with the higher diastolic BP while only 1.7% (1.9 to 0.2) more of the younger were afflicted. The importance of this increased risk in the young with higher BP should not be ignored, but the use of the smaller change in absolute risk rather than the larger change in relative risk seems more appropriate when applying epidemiologic statistics to individual patients.
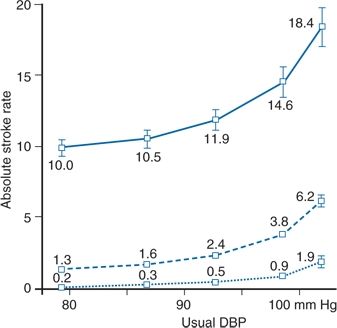
FIGURE 1-6 The absolute risks for stroke by age and usual diastolic BP in 45 prospective observational studies involving 450,000 individuals with 5 to 30 years of follow-up during which 13,397 participants had a stroke. Dotted line, less than 45 years old; dashed line, 45 to 65 years old; solid line, ≥65 years old. (Modified from Prospective Studies Collaboration. Cholesterol, diastolic blood pressure, and stroke: 13,000 strokes in 450,000 people in 45 prospective cohorts. Lancet 1995;346:1647–1653.)
The distinction between the risks for the population and for the individual is important. For the population at large, risk clearly increases with every increment in BP, and levels of BP that are accompanied by significantly increased risks should be called high. As Stamler et al. (1993) note: “Among persons aged 35 years or more, most have BP above optimal (<120/<80 mm Hg); hence, they are at increased CVD risk, i.e., the BP problem involves most of the population, not only the substantial minority with clinical hypertension.” However, for individual patients, the absolute risk from slightly elevated BP may be quite small. Therefore, more than just the level of BP should be used to determine risk. Sussman et al. (2013) provide statistical evidence that “benefit-based tailored treatment” that uses estimated CVD event reduction by other risk factors as well provides better protection against CVD and more quality-adjusted life-years than does the currently used “treatment to target” approach.
Benefits of Action: Decreased Risk of CVD
The major benefit listed in Table 1-2 that is involved in a conceptual definition of hypertension is the level at which it is possible to show the benefit of reducing CVD by lowering the BP. Inclusion of this factor is predicated on the assumption that it is of no benefit—and, as we shall see, is potentially harmful—to label a person hypertensive if nothing will be done to lower the BP.
Natural Versus Treatment-Induced BP
Before proceeding, one caveat is in order. As noted earlier, less CVD is seen in people with low BP, who are not receiving antihypertensive therapy. However, that fact cannot be used as evidence to support the benefits of therapy, because naturally low BP offers a degree of protection not provided by a similarly low BP resulting from antihypertensive therapy.
The available evidence supports that view: Morbidity and mortality rates, particularly those of coronary disease, continue to be higher in patients who are undergoing antihypertensive drug treatment than in untreated people with similar levels of BP. This has been shown for coronary disease in follow-up studies of multiple populations (Andersson et al., 1998; Clausen & Jensen, 1992; Okin et al., 2012; Thürmer et al., 1994) and in Japanese for strokes (Asayama et al., 2009). This issue is covered in more detail in Chapter 5.
In contrast to these data, considerable experimental, epidemiologic, and clinical evidences indicate that reducing elevated BP is beneficial, particularly in high-risk patients (Bakris et al., 2014; Blood Pressure Lowering Treatment Trialists’ Collaboration, 2008; Lackland et al., 2014).
Rationale for Reducing Elevated BP
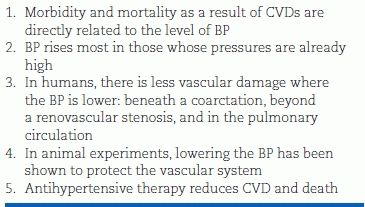
Table 1-3 presents the rationale for lowering elevated BP. The reduction in CVD and death (listed last in the table) has been measured to determine the BP level at which a benefit is derived from antihypertensive therapy as covered in Chapter 5.
TABLE 1-3 Rationale for the Reduction of Elevated BP
During the past 40 years, controlled therapeutic trials have included patients with diastolic BP levels as low as 90 mm Hg. Detailed analyses of these trials are presented in Chapter 5. For now, it is enough to say that there is no question that protection against CVD has been documented for reduction of diastolic BP levels that start at or above 95 mm Hg, but there is continued disagreement about whether protection has been shown for those whose diastolic BP starts at or above 90 mm Hg who are otherwise at low risk. Similarly, protection for the elderly with ISH has been documented with a systolic BP ≥ 160 mm Hg or higher, but there are no data for the large elderly population between 140 and 160 mm Hg. Therefore, expert committees have disagreed about the minimum level of BP at which drug treatment should begin.
In particular, as seen in Table 1-4, the British guidelines (National Institute for Health and Clinical Excellence (UK) (NICE), 2011) are more conservative than are those from the U.S., which recommend 140/90 mm Hg (Go et al., 2013; Weber et al., 2014). However, the report written by the majority of members of the JNC-8 committee recommends a level of 150 mm Hg for all over age 60 (James et al., 2014). A four-person minority of the JNC-8 committee strongly support maintenance of the current 140–mm Hg level for all below age 80 (Wright et al., 2014).
TABLE 1-4 Features of Recent Guidelines
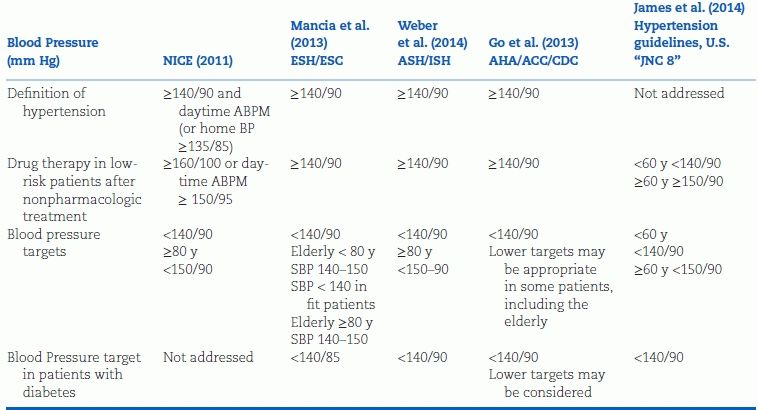
These disagreements have highlighted the need to consider more than the level of BP in making that decision. As is noted in Chapter 5, the consideration of other risk factors, target organ damage, and symptomatic CVD allows a more rational decision to be made about whom to treat.
Prevention of Progression of Hypertension
Another benefit of action is the prevention of progression of hypertension, which should be looked on as a surrogate for reducing the risk of CVD. Evidence of that benefit is strong, based on data from multiple, randomized, placebo-controlled clinical trials as shown in Chapter 4, Table 4-2. In such trials, the number of patients whose hypertension progressed from their initially less severe degree to more severe hypertension, defined as BP greater than 200/110 mm Hg, increased from only 95 of 13,389 patients on active treatment to 1,493 of 13,342 patients on placebo (Moser & Hebert, 1996).
As seen in Figure 1-7, the progressively lower frequency distribution of systolic BP in the U.S. population from 1959 to 2010 is shown by Lackland et al. (2014) to be largely a consequence of improved treatment of hypertension. The mean systolic BP has fallen from 131 mm Hg in 1960 to 122 mm Hg in 2008 (Lackland et al., 2014).
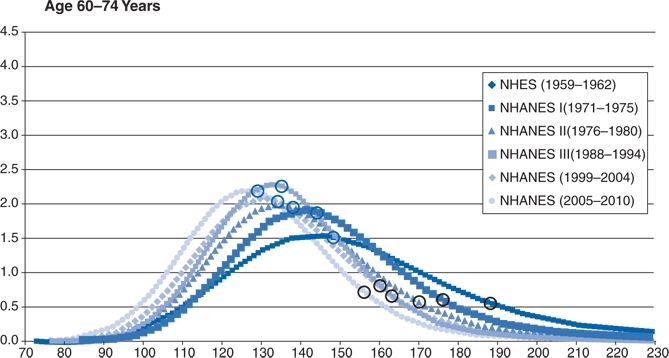
FIGURE 1-7 Smoothed weighted frequency distribution, median, and 90th percentile of systolic BP: U.S., 1959 to 2010. Age 60 to 74 years. NHANES indicates National Health and Nutrition Examination Survey; and NHES, National Health Examination Surveys. (Lackland DT, Roccella EJ., Deutsch AF
Related posts:

Stay updated, free articles. Join our Telegram channel

Full access? Get Clinical Tree


