FIGURE 2-1 Different types of BPV and the complex network of their possible determinants (arrow width reflects the likely strength of relationship based on available evidence). AHT, antihypertensive treatment; BPV, blood pressure variability. (Adapted from Parati G, Bilo G. Calcium antagonist added to angiotensin receptor blocker: A recipe for reducing blood pressure variability?: Evidence from day-by-day home blood pressure monitoring. Hypertension 2012;59:1091–1093.)
The typical short-term variability of the BP through the 24-hour day is easily recognized by ABPM (Fig. 2-2). This printout of readings taken in a single patient every 15 minutes during the day and every 30 minutes at night displays the large fluctuations in daytime readings, the typical dipping during sleep, and the abrupt increase on arising.
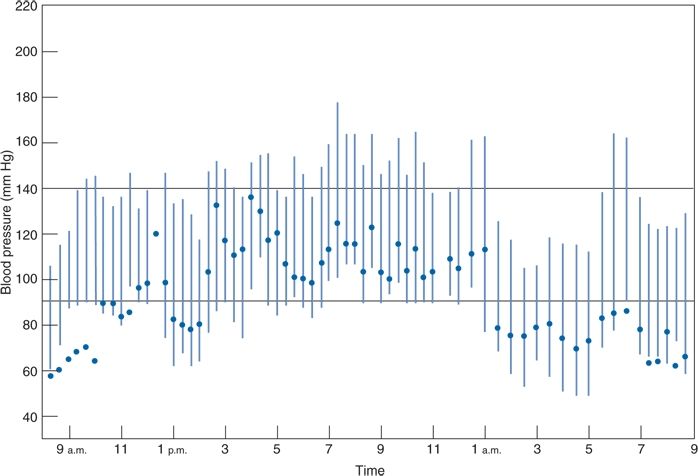
FIGURE 2-2 Computer printout of BPs obtained by ABPM over 24 hours, beginning at 9 a.m., in a 50-year-old man with hypertension receiving no therapy. The patient slept from midnight until 6 a.m. Solid circles, heart rate in beats per minute. (From Zachariah PK, Sheps SG, Smith RL. Defining the roles of home and ambulatory monitoring. Diagnosis 1988;10:39–50, with permission.)
The adverse consequences of not recognizing and dealing with this variability are obvious: Individual patients may be falsely labeled as hypertensive or normotensive. If falsely labeled as normotensive, needed therapy may be denied. If falsely labeled as hypertensive, the label itself may provoke ill effects (Hamer et al., 2010) and unnecessary therapy will likely be given.
Sources of Variation in Office Readings
Variability in office BP readings may arise from problems involving the observer (measurement variation) or factors working within the patient (biologic variation).
Measurement Variations
An impressively long list of factors that can affect the immediate accuracy of office measurements has been compiled by Reeves (1995) (Table 2-1). These errors are more common than most practitioners realize (Keenan et al., 2009), and regular, frequent retraining of personnel is needed to prevent them.
TABLE 2-1 Factors Affecting the Immediate Accuracy of Office BP Measurements
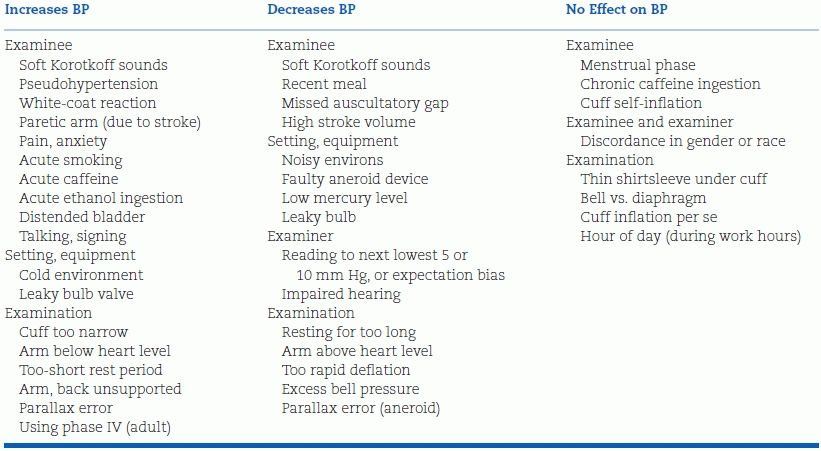
Modified from Reeves RA. Does this patient have hypertension? JAMA 1995;273:1211–1218.
Biologic Variations
Biologic variations in BP may be either random or systematic. Random variations are uncontrollable but can be reduced simply by repeating the measurement as many times as needed. Systematic variations are introduced by something affecting the patient and, if recognized, are controllable; however, if not recognized, they cannot be reduced by multiple readings. For example, Modesti et al. (2013), using ABPM in 1,897 subjects, found the daytime systolic BP was negatively related to the subjects’ environmental temperature, nighttime BP was positively related to daylight hours, and the morning surge was negatively related to daylight hours.
As seen in Figure 2-2, considerable differences in readings can be seen at different times of the day, whether or not the subject is active. Beyond these, between-visit variations in BP can be substantial. Even after three office visits, the standard deviation of the difference in BP from one visit to another in 32 subjects was 10.4 mm Hg for systolic BP and 7.0 mm Hg for diastolic BP (Watson et al., 1987).
Types of Variation
As seen in Figure 2-1, variability in BP arises from different sources: Short term, daytime, diurnal, and seasonal. The overriding influence of activity on daytime and diurnal variations was well demonstrated in a study of 461 untreated hypertensive patients whose BP was recorded with an ambulatory monitor every 15 minutes during the day and every 30 minutes at night over 24 hours (Clark et al., 1987). In addition, five readings were taken in the clinic before and another five after the 24-hour recording. When the mean diastolic BP readings for each hour were plotted against each patient’s mean clinic diastolic BP, considerable variations were noted, with the lowest BPs occurring during the night and the highest near midday (Fig. 2-3A). The patients recorded in a diary the location at which their BP was taken (e.g., at home, work, or other location) and what they were doing at the time, selecting from 15 choices of activity. When the effects of the various combinations of location and activity on the BP were analyzed, variable effects relative to the BP recorded while relaxing were seen (Table 2-2). When the estimated effects of the various combinations of location and activity were subtracted from the individual readings obtained throughout the 24-hour period, little residual effect related to the time of day was found (Fig. 2-3B). To be sure, BP usually falls during sleep, and a morning surge is typical, but beyond these, there is no circadian rhythm of BP (Peixoto & White, 2007).
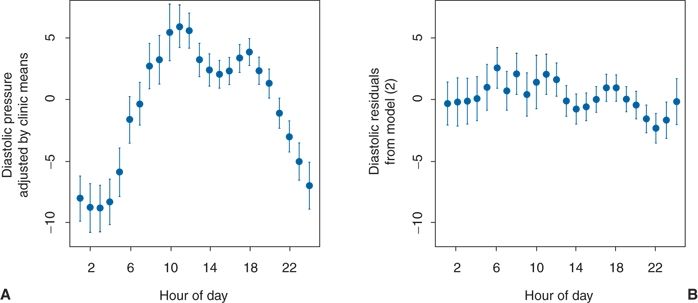
FIGURE 2.3 A: Plot of diastolic BP readings adjusted by individual clinic means. B: Plot of the diastolic BP hourly mean residuals after adjustments for various activities by a time-of-day model. The hourly means (solid circles) ± 2 standard errors of the mean (vertical lines) are plotted versus the corresponding time of day. (Modified from Clark LA, Denby L, Pregibon D, et al. A quantitative analysis of the effects of activity and time of day on the diurnal variations of blood pressure. J Chronic Dis 1987;40:671–679.)
TABLE 2-2 Average Changes in BP Associated with Commonly Occurring Activities, Relative to BP while Relaxing
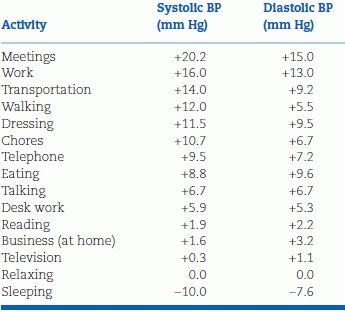
Data adapted from Clark LA, Denby L, Pregibon D, et al. A quantitative analysis of the effects of activity and time of day on the diurnal variations of blood pressure. J Chronic Dis 1987;40:671–679.
Additional Sources of Variation
It is important to minimize the changes in BP that arise because of variations within the patient. Even little things can have an impact: Both systolic BP and diastolic BP may rise 10 mm Hg or more with a distended urinary bladder (Faguis & Karhuvaara, 1989) or during ordinary conversation (Le Pailleur et al., 1998). Just the presence of a medical student in the room was found to increase the BP by an average of 6.4/2.4 mm Hg (Matthys et al., 2004). Those who are more anxious or elated tend to have higher levels (Ogedegbe et al., 2008). Particularly in the elderly, eating may lower the BP (Smith et al., 2003). Two common practices may exert significant pressor effects: Smoking (Groppelli et al., 1992) or drinking caffeinated beverages (Hartley et al., 2004).
The BP may vary between the two arms, and it should preferably be taken simultaneously in both arms on initial exam, with the higher arm used in subsequent measurements. In the few patients with subclavian artery stenoses causing a steal phenomenon, even higher differences are found.
Prognostic Implications of Variability
Additional insights into the mechanisms and consequences of both short-term and long-term BPV have been provided by another leader of the Milan group, Giuseppe Mancia (2012). In examining short-term BPV, i.e., over 24 hours, Mancia (2012) notes that the main reason for the reduction in variability with antihypertensive therapy is the reduction of the BP. More importantly, BPV within 24 hours has been found to be an independent predictor of the incidence of cardiovascular events (Kikuya et al., 2008; Parati et al., 1987). However, Mancia (2012) notes a number of limitations of the measurement of short-term BPV that will require measurement of beat-to-beat ambulatory BP noninvasively, a requirement that may be difficult to fulfill.
As to long-term variability, Mancia (2012) observes that “little is known about the factors responsible for the BP differences that have been observed between visits spaced by months or years in observational and antihypertensive drug trials” but notes that “these differences have been shown to have a prognostic value as in the Anglo-Scandinavian Cardiac Outcomes Trial (ASCOT) reported by Rothwell et al. (2010a,b): the lower within-individual visit-to-visit variability seen in the amlodipine-treated group compared to that seen in the atenolol-treated group “account for the disparity in observed effects on risk of stroke” (Rothwell et al., 2010a). They conclude that “visit-to-visit variability in systolic BP and maximum SBP are strong predictors of stroke, independent of mean SBP” (Rothwell et al., 2010b). When individual variation in SBP was analyzed from data in 389 trials, these authors found a pattern of variation with various antihypertensive drug classes that was associated with the risk of stroke independently of effects on mean SBP (Fig. 2-4) (Webb et al., 2010).
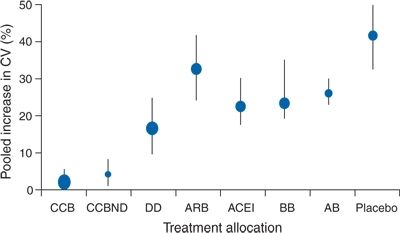
FIGURE 2-4 Changes in group variation in systolic BP at follow-up compared with baseline and percentage increase in coefficient of variation. Error bars represent the 95%. CCB, calcium channel blocker; CCBND, nondihydropyridine calcium channel blocker; DD, nonloop diuretic drug; ARB, angiotensin-2-receptor blocker; ACEI, angiotensin-converting enzyme inhibitor; BB, β blocker; AB, α-1 blocker.(Adapted from Webb AJ, Fischer U, Mehta Z, Rothwell PM. Effects of antihypertensive-drug class on interindividual variation in blood pressure and risk of stroke: A systematic review and meta-analysis. Lancet 2010;375:906–915.)
Support for this effect of BPV was forthcoming both for the risk of stroke (Shimbo et al., 2012; Zhang et al., 2011) and decline in cognitive function in older subjects (Sabayan et al., 2013). However, in keeping with Mancia’s (2012) view of multiple limitations on the validity of BPV for risk assessment, the results of two studies have shown that mean systolic BP and not variability predict outcomes: Schutte et al. (2012) in a prospective study of 2,944 patients given antihypertensive therapy for 12 years, Asayama et al. (2013) in 2,421 patients treated for 12 years.
Additional evidence of the impact of long-term blood pressure variability (BPV) has been provided by Hastie et al. (2013) who examined the levels of office BPV in 14,522 subjects during the 1st year of treatment, during years 1 to 5, during years 5 to 10, and after 10 years. Higher long-term and ultra-long-term BPV were associated with increased cardiovascular mortality, including patients with mean systolic BP less than 140 mm Hg in all time frames. Surprisingly, they found no association with stroke mortality.
These data confirm the need to maintain as little BPV as possible in the long-term treatment of hypertension. As seen in Figure 2-4, diuretics and calcium channel blockers provide the least degree of variability, likely part of the reason they are more effective in protection against stroke.
Blood Pressure During Sleep and on Awakening
Normal Pattern
The usual fall in BP at night is largely the result of sleep and inactivity rather than the time of day (Sayk et al., 2007). The usual falls in BP and heart rate that occur with sleep reflect a decrease in sympathetic nervous tone. In healthy young men, plasma catecholamine levels fell during rapid-eye-movement sleep, whereas awakening immediately increased epinephrine, and subsequent standing induced a marked increase in norepinephrine (Dodt et al., 1997).
Two features of the pattern of BP portrayed in 24-hour ABPM—the degree of fall in the BP during sleep, i.e., “dipping,” and the degree of rise of BP upon awakening and rising, i.e., the “morning surge”—have been extensively examined for their relation to hypertensive organ damage and cardiovascular morbidity and mortality. Fortunately, the pattern of nocturnal dipping may be recognized by home monitoring devices that are more accessible and less expensive than 24-hour ABPM devices. Two devices have been used to obtain three measurements of sleep-time BP: the Omron HEM-5001 (Ishikawa et al., 2012) and the MicrolifeWatchBNP (Stergiou et al., 2012c).
The Degree of Dipping
The nocturnal dip in pressure is normally distributed with no evidence of bimodality in both normotensive and hypertensive people (Staessen et al., 1997). The separation between “dippers” and “nondippers” is, in a sense, artifactual. However, most investigators such as Ivanovic et al. (2013) have used these criteria in comparison to the average daytime level:
- Normal = average decrease of BP greater than 10% and less than 20%
- extreme dippers = greater than 20% fall
- nondippers = less than 10% fall
- reverse dippers = higher than daytime average (Ivanovic et al., 2013)
What appears to be nondipping may be simply a consequence of getting up to urinate (Perk et al., 2001) or a reflection of obstructive sleep apnea (Pelttari et al., 1998), or simply poor sleep quality (Sherwood et al., 2011). Moreover, the degree of dipping during sleep can be affected by the amount of dietary sodium in those who are salt sensitive: Sodium loading attenuates these individuals’ dipping, whereas sodium reduction restores their dipping status (Uzu et al., 1999). Among 325 African French, those who excreted a large portion of urinary sodium during the day had more dipping at night (Bankir et al., 2008). Furthermore, dipping is more common among people who are more physically active during the day (Cavelaars et al., 2004).
Associations with Nondipping
A number of associations have been noted with nondipping. These include
- Older age (Staessen et al., 1997)
- Cognitive dysfunction (Van Boxtel et al., 1998) and psychological stress (Clays et al., 2012)
- Diabetes (Björklund et al., 2002)
- Obesity (Kotsis et al., 2005)
- African Americans (Sherwood et al., 2011) and Hispanics (Rodriguez et al., 2013)
- Impaired endothelium-dependent vasodilation (Higashi et al., 2002)
- Diastolic dysfunction (Ivanovic et al., 2013)
- Left ventricular hypertrophy (Cuspidi et al., 2004)
- Early atherosclerosis (Vasunta et al., 2012) and coronary artery calcification (Coleman et al., 2011)
- Intracranial hemorrhage (Tsivgoulis et al., 2005)
- Loss of renal function (Kanno et al., 2013) and albuminuria (Syrseloudis et al., 2011)
- Mortality from cardiovascular disease (Redon & Lurbe, 2008)
Associations with Excessive Dipping
Just as a failure of the BP to fall during sleep may reflect or contribute to cardiovascular damage, there may also be danger from too great a fall in nocturnal BP. Floras (1988) suggested that nocturnal falls in BP could induce myocardial ischemia in hypertensives with left ventricular hypertrophy and impaired coronary vasodilator reserve, contributing to the J-curve of increased coronary events when diastolic BP is lowered below 65 mm Hg (see Chapter 5).
The first objective evidence for this threat from too much dipping was the finding by Kario et al. (1996) that more silent cerebrovascular disease (identified by brain magnetic resonance imaging) was found among extreme dippers who had a greater than 20% fall in nocturnal systolic BP. Subsequently, Kario et al. (2001), in a 41-month follow-up of 575 elderly hypertensives, found the lowest stroke risk to be at a sleep diastolic BP of 75 mm Hg, with an increased risk below 75 mm Hg that was associated with their intake of antihypertensive drugs. Too great a fall in nocturnal pressure may also increase the risk of anterior ischemic optic neuropathy and glaucoma (Pickering et al., 2008). These findings serve as a warning against late evening or bedtime dosing of drugs that have a substantial antihypertensive effect in the first few hours after intake.
It should be noted that, regardless of the pattern of dipping, the presence of nocturnal hypertension, defined as a BP greater than 120/70 mm Hg, is associated with an increased incidence of cardiovascular events even among patients who have normotensive daytime BP levels (Li & Wang, 2013) or normal nocturnal dipping (Cuspidi et al., 2012).
A typical relation between various dipping patterns and cardiovascular events is shown in Figure 2-5, the data obtained from a cohort of 3,012 initially untreated hypertensive patients followed for a mean of 8.4 years (Verdecchia et al., 2012).
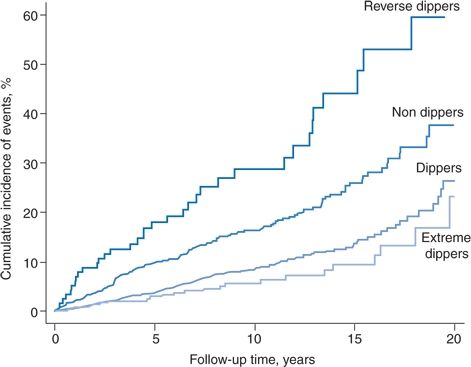
FIGURE 2-5 Kaplan-Meier curves reporting the cumulative incidence of cardiovascular disease in the four categories of dipping pattern. (Adapted from Verdecchia P, Angeli F, Mazzotta G, et al. Day-night dip and early-morning surge in blood pressure in hypertension: Prognostic implications. Hypertension 2012;60:34–42.)
Early Morning Surge
The BP abruptly rises, i.e., surges, upon arising from sleep, whether it be in the early morning (Gosse et al., 2004) or after a midafternoon siesta (Bursztyn et al., 1999), and the degree of surge may vary on repeated measurements (Wizner et al., 2008). As amply described, the early morning hours after 6 a.m. are accompanied by an increased prevalence of all cardiovascular catastrophes as compared to the remainder of the 24-hour period (Muller, 1999). Early morning increases have been noted for stroke (Foerch et al., 2008), cardiac arrest (Soo et al., 2000), rupture of the abdominal aorta (Manfredini et al., 1999), and epistaxis (Manfredini et al., 2000), possibly by destabilizing atherosclerotic plaques (Marfella et al., 2007) within the thickened resistance arteries (Rizzoni et al., 2007).
The belief that these early morning events are directly related to the early morning rise in BP has been repeatedly emphasized by Kario (2010). As the threshold for “pathologic” morning surge, Kario and coinvestigators found increased risk only in subjects in the upper 10th percentile of systolic BP, a rise of 55 mm Hg or more (Kario, 2010). In an analysis of data from 5,695 subjects followed for a median of 11.4 years, Li et al. (2010) also observed an increase in events only among the subjects in the upper 10th percentile of SBP, a level of 37 mm Hg or more. Thus, a “pathologic” morning surge appears to be a very high level of increased SBP.
Conversely, data from two more recent studies do not confirm a relation between any level of morning surge and either cardiovascular events (Verdecchia et al., 2012) or all-cause mortality (Israel et al., 2011). Israel et al. (2011) found a greater morning surge in nondipping subjects to be associated with decreased all-cause mortality, concluding that “an increase in morning BP over nocturnal level probably represents a healthier form of circadian variation.” Verdecchia et al. (2012), in their study of 3,012 initially untreated hypertensives followed for a mean of 8.4 years, found that “a blunted morning BP surge was an independent predictor of cardiovascular events whereas an excessive BP surge did not portend an increased risk of events.” Both authors emphasize that their findings likely relate to the degree of nocturnal dipping: The greater the day–night dip, the greater the morning BP surge. Therefore, as noted before, the degree of BP dipping seems to be the best prognostic indicator.
White-Coat Effect
Measurement of the BP may invoke an alerting reaction, a reaction that is only transient in most patients but persistent in some. It usually is seen more often in people who have a greater rise in BP under psychological stress (Palatini et al., 2003), but the majority of people have higher office BP than out-of-office BP (O’Brien et al., 2003).
Environment
There is a hierarchy of alerting: Least at home, more in the clinic or office, and most in the hospital. Measurements by the same physician were higher in the hospital than in a health center (Enström et al., 2000). To reduce the alerting reaction, patients should relax in a quiet room and have multiple readings taken with an automatic device (Myers, 2012a).
Measurer
Figure 2-6 demonstrates that the presence of a physician usually causes a rise in BP that is sometimes very impressive (Mancia et al., 1987). The data in Figure 2-6 were obtained from patients who had an intra-arterial recording. When the intra-arterial readings were stable, the BP was measured in the noncatheterized arm by both a male physician and a female nurse, half of the time by the physician first and the other half by the nurse first. The patients had not met the personnel but had been told that they would be coming. When the physician took the first readings, the BPs rose an average of 22/14 mm Hg and as much as 74 mm Hg systolic. The readings were approximately half that much above baseline at 5 and 10 minutes. Similar rises were seen during three subsequent visits. When the nurse took the first set of readings, the rises were only half as great as those noted by the physician, and the BP usually returned to near-baseline when measured again after 5 and 10 minutes. The rises were not related to patient age, gender, overall BP variability, or BP levels. These marked differences are not limited to handsome Italian doctors or their excitable patients. Similar nurse–physician differences have been repeatedly noted elsewhere (Little et al., 2002).
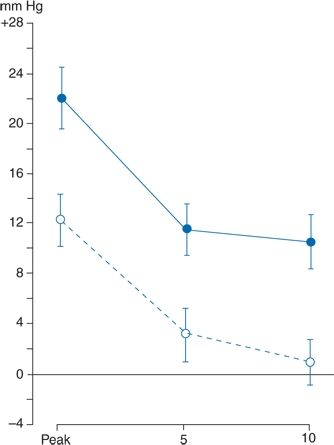
FIGURE 2-6 Comparison of maximum (or peak) rises in systolic BP in 30 subjects during visits with a physician (solid line) and a nurse (dashed line). The rises occurring at 5 and 10 minutes into the visits are shown. Data are expressed as mean (±standard error of the mean) changes from a control value taken 4 minutes before each visit. (Modified from Mancia G, Paroti G, Pomidossi G, et al. Alerting reaction and rise in blood pressure during measurement by physician and nurse. Hypertension 1987;9:209–215.)
A large amount of data indicate a marked tendency in most patients for BP to fall after repeated measurements, regardless of the time interval between readings (Verberk et al., 2006). These findings, then, strongly suggest that nurses and not physicians should measure the BP and that at least three sets of readings should be taken before the patient is labeled hypertensive and the need for treatment is determined (Graves & Sheps, 2004).
White-Coat Hypertension
As will be noted, white-coat hypertension (WCH) has been variably defined. The most commonly accepted definition is an average of multiple daytime out-of-office BPs of less than 135/85 mm Hg in the presence of usual office readings above 140/90 mm Hg (O’Brien et al., 2003; Verdecchia et al., 2003).
Most patients have higher BP levels when taken in the office than when taken out of the office, as shown in a comparison between the systolic BPs obtained by a physician versus the average daytime systolic BPs obtained by ambulatory monitors (Pickering, 1996) (Fig. 2-7). In the figure, all the points above the diagonal line represent higher office readings than out-of-office readings, indicating that a majority of patients demonstrate the white-coat effect.
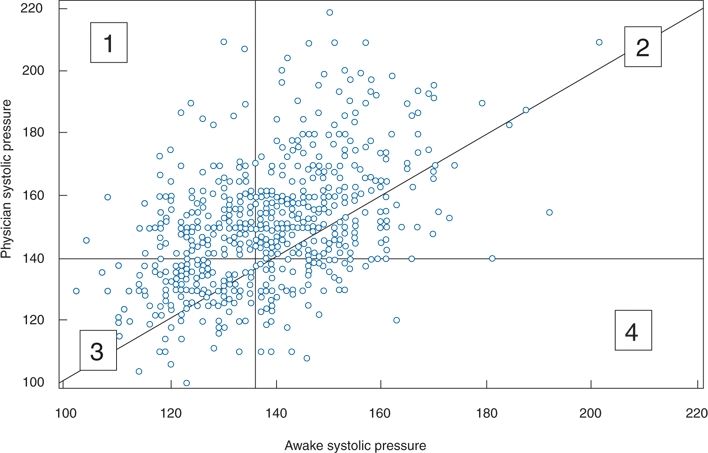
FIGURE 2-7 Plot of clinic systolic and daytime ambulatory BP readings in 573 patients. 1, Patients with WCH; 2, patients with sustained hypertension; 3, patients with normal BP; 4, patients whose clinic BP underestimates ambulatory BP. The majority of sustained hypertensives and normotensives had higher clinic pressures than awake ambulatory pressures. (Adapted from Pickering TG. Ambulatory monitoring and the definition of hypertension. J Hypertens 1992;10:401–409.)
Whereas most patients exhibiting a white-coat effect also had elevated out-of-office readings, so that they are hypertensive in all settings (Fig. 2-7, group 2), a smaller but significant number of patients had normal readings outside the office—i.e., WCH (Fig. 2-7, group 1)—whereas another group had normal office readings but elevated outside readings (Fig. 2-7, group 4). As will be described, such masked hypertension has received increasing attention. Pickering et al. (1988) had previously found that among 292 untreated patients with persistently elevated office readings over an average of 6 years, the out-of-office readings recorded by a 24-hour ambulatory monitor were normal in 21%. Since that observation, the prevalence of WCH has been found to be approximately 15% in multiple groups of patients with office hypertension (Dolan et al., 2004). To ensure the diagnosis, more than one ABPM should be obtained (Cuspidi et al., 2007).
It is important to avoid confusion between the white-coat effect and white-coat hypertension. As Pickering (1996) emphasized, “White coat hypertension is a measure of BP level, whereas the white coat effect is a measure of change. A large white coat effect is by no means confined to patients with white coat hypertension and indeed is often more pronounced in patients with severe hypertension.”
As interest in WCH has grown, a number of its features have become apparent, including the following:
- The prevalence depends largely on the level of the office readings: The less the elevation, the lower the prevalence of WCH since there is less spread between the lower limit of office hypertension (>140/90 mm Hg) and the upper limit of WCH (<135/85 mm Hg).
- The prevalence of WCH may be reduced if the office readings are based on at least five separate visits or by the process of ambulatory BP measurement described by Myers (2012a) (refer section, Automated Office BP Measurement, page 14).
- Only daytime ambulatory readings have been used to define WCH, but O’Brien et al. (2013) state that “because of the contribution of asleep BP as a predictor of outcome, it seems illogical to exclude this period from consideration….an alternative definition of WCH might encompass patients with office readings at least 140/90 mm Hg and a mean 24-hour BP less than 130/80 mm Hg.”
- Multiple self-obtained home readings are as good as ambulatory readings to document WCH (Den Hond et al., 2003). However, neither necessarily reflect the extent of the pressor effect of the doctor’s visit (Saladini et al., 2012).
- The prevalence rises with the age of the patient (Mansoor et al., 1996) and is particularly high in elderly patients with isolated systolic hypertension ( Jumabay et al., 2005).
- Women are more likely to have WCH (Dolan et al., 2004).
- Some patients considered to have resistant or uncontrolled hypertension on the basis of office readings instead have WCH and, therefore, in the absence of target organ damage, may not need more intensive therapy (Redon et al., 1998). However, most treated hypertensives with persistently high office readings also have high out-of-office readings, so their inadequate control cannot be attributed to the white-coat effect (Mancia et al., 1997). Moreover, Franklin et al. (2012a) found patients with isolated systolic hypertension who when treated continue to display the white-coat effect remained at a twofold greater risk for cardiovascular events than seen in untreated normotensives. Franklin et al. (2012a) refer to these patients as having “treated normalized hypertension” whereas Myers (2012b) prefers the term “pseudoresistant treated hypertension.”
Beyond these features, two more important and interrelated issues remain: What is the natural history of WCH and what is its prognosis?
Natural History
Too few patients have been followed long enough to be sure of the natural history of WCH. Pickering et al. (1999) found that only 10% to 30% become hypertensive over 3 to 5 years. Mancia et al. (2009) found that 43% of patients with WCH developed sustained hypertension after 10 years. As noted, the magnitude of the white-coat effect varies considerably, so multiple ABPMs are needed to ensure the diagnosis (Muxfeldt et al., 2012).
Prognosis
Less uncertainty remains about the risks of WCH as more patients are followed for longer times. In an analysis of data from four prospective cohort studies from the United States (U.S.), Italy, and Japan, which used comparable methodology for 24-hour ABPM in 1,549 normotensives and 4,406 essential hypertensive patients, the prevalence of WCH was 9% (Verdecchia et al., 2005). Over the first 6 years of follow-up, the risk of stroke in a multivariate analysis was a statistically insignificant 1.15 in the WCH group versus 2.01 in the ambulatory hypertensive group compared to the normotensive group. However, the incidence of stroke began to increase after the 6th year in the WCH group and, by the 9th year, crossed the hazard curve of the ambulatory hypertensive group.
Pierdomenico et al. (2008) followed 305 people with normal BP, 399 with WCH, and 1,333 with sustained hypertension for 14 years. Event-free survival rates were the same in the normotensives and WCHs until the 10th year when it fell among the WCHs but still remained much higher than seen in the sustained hypertensives. Similar data were reported by Ben-Dov et al. (2008) in an even larger group of treated WCHs compared to those with sustained hypertension. On the other hand, Franklin et al. (2012a) found that over a mean follow-up of 10.6 years, the 334 subjects with isolated systolic hypertension and the white-coat effect who remained untreated had the same cardiovascular risk as seen among the 5,271 untreated normotensives.
Before clinical events are seen, WCHs have been found to have increased arterial stiffness (Sung et al., 2013) and thickness (Puato et al., 2008). Obviously, close follow-up of patients diagnosed with WCH is mandatory (Muxfeldt et al., 2012). At the least, they should be encouraged to modify their lifestyle in an appropriate manner and continue to monitor their BP status.
Masked Hypertension
As seen in the lower right portion of Figure 2-7, labeled as no. 4, some patients have normal office BP (<140/90) but elevated ambulatory readings (>135/85). These “masked” hypertensives may comprise a significant portion, 10% or more, of the general population (O’Brien et al., 2013). Higher daytime ambulatory BPs than office readings were found in 41% of 1,814 subjects aged 75 years or older with a normal office BP (Cacciolati et al., 2011). Such patients have increased rates of cardiovascular morbidity, almost as high as seen in those with both clinic and ambulatory hypertension (Ben-Dov et al., 2008; Bobrie et al., 2008; Pierdomenico & Cuccurullo, 2011).
Since by definition these patients have normal office BP readings, the only way to exclude masked hypertension is to obtain out-of-office readings on every patient. Though only a few home readings are usually needed (Mallion et al., 2004), most patients cannot get them. Therefore, the search should be narrowed to those more likely to be higher out of the office. These include patients with diabetes (Franklin et al., 2013), unexplained tachycardia (Grassi et al., 2007), left ventricular hypertrophy (Hanninen et al., 2013), or obstructive sleep apnea (Baguet et al., 2008).
Patients on antihypertensive therapy usually have a lesser fall, averaging 30% less, in ambulatory BPs than in office measurements (Mancia & Parati, 2004), often showing a pattern of masked hypertension. However, they should not be called “masked” because they were hypertensive before therapy. O’Brien et al. (2013) prefer the term “masked uncontrolled hypertension.” Diabetic patients display this mimicry more often than do nondiabetics (Franklin et al., 2013).
OFFICE MEASUREMENT OF BLOOD PRESSURE
Despite the presence of inadequacies that are inherent in the current performance of office readings, they will continue to be widely used so they will be fully described. As will be noted, a possible way to rescue their use has been described (Myers, 2012a). Moreover, fewer than half of U.S. hypertensives have home monitors (Ostchega et al., 2013) and in many places even rudimentary offices remain the only site available for BP measurement.
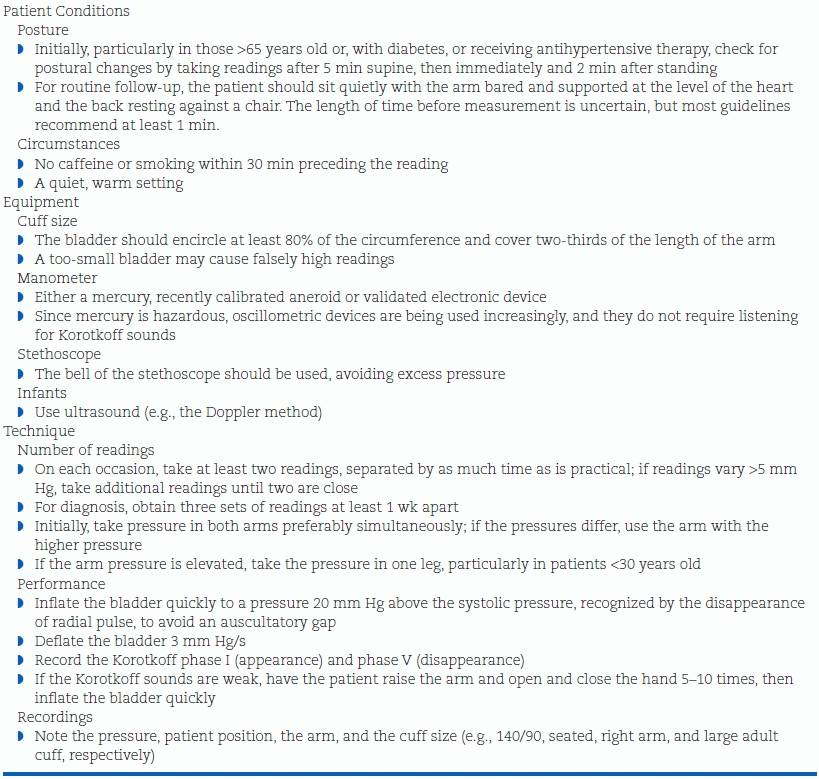
Under the best of circumstances, all of the previously described causes of variability are difficult to control. Even under carefully controlled conditions, all indirect measures are different from those obtained intra-arterially, averaging about 5 mm Hg lower for systolic and 10 mm Hg higher for diastolic (Smulyan & Safar, 2011). Use of the guidelines shown in Table 2-3 will prevent most preventable measurement errors. More details are provided in a report by experts (Stergiou et al., 2012a).
TABLE 2-3 Guidelines for Measurement of BP in the Office
Patient and Arm Position
The patient should be seated comfortably with the arm supported and positioned at the level of the heart (Fig. 2-8). Measurements taken with the arm hanging at the patient’s side averaged 10 mm Hg higher than those taken with the arm supported in a horizontal position at heart level (Netea et al., 2003). When sitting upright on a table without support, readings may be as much as 10 mm Hg higher because of the isometric exertion needed to support the body and arm. Systolic readings are approximately 8 mm Hg higher in the supine than in the seated position even when the arm is at the level of the right atrium (Netea et al., 2003).
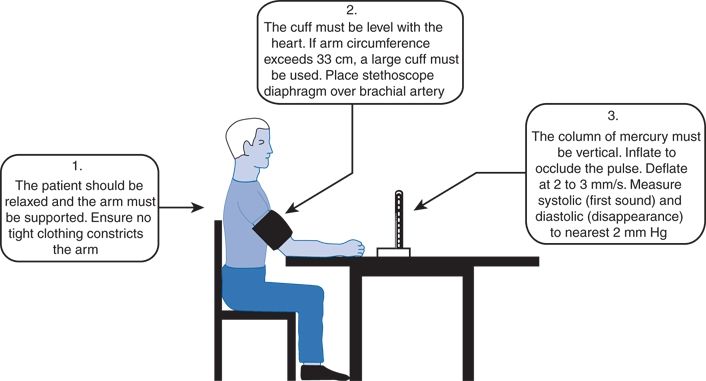
FIGURE 2-8 Technique of BP measurement recommended by the British Hypertension Society. (From British Hypertension Society. Standardization of blood pressure measurement. J Hypertens 1985;3:29–31. Reproduced with permission)
Differences Between Arms
As noted earlier in this chapter, initially the BP should preferably be measured in both arms simultaneously to ascertain the differences between them; if the reading is higher in one arm, that arm should be used for future measurements. In two meta-analyses of BP measurement data, some including patients referred because of suspicion of peripheral vascular disease (PVD), a difference of 10 mm Hg or more was found in 15% to 20% of patients and was associated with an increased prevalence of PVD and mortality (Clark et al., 2012; Verberk et al., 2011). Much lower BP in the left arm is seen in patients with subclavian steal caused by reversal of flow down a vertebral artery distal to an obstructed subclavian artery, as noted in 9% of 500 patients with asymptomatic neck bruits (Bornstein & Norris, 1986). The BP may be either higher or lower in the paretic arm of a stroke patient (Dewar et al., 1992).
Standing Pressure
Readings should be taken immediately on standing and after standing at least 2 minutes to check for spontaneous or drug-induced postural changes, particularly in the elderly and in diabetics. If no fall in BP is seen in patients with suggestive symptoms, the time of quiet standing should be prolonged to at least 5 minutes. In most people, systolic BP falls and diastolic BP rises by a few millimeters of mercury on changing from the supine to the standing position. In the elderly, significant postural falls of 20 mm Hg or more in systolic BP are more common, occurring in approximately 10% of ambulatory people older than 65 years and in more than half of frail nursing-home residents, particularly in those with elevated supine systolic BP (Gupta & Lipsitz, 2007).
Leg Pressure
If the arm reading is elevated, particularly in a patient younger than 30, the BP should be taken in one leg to rule out coarctation of the aorta.
Sphygmomanometer
Independent evaluations of BP device accuracy and performance are available at www.dableducational.org, but there are no obligatory standards which must be met. Significant errors of both mercury and aneroid manometers were found in more than 5% of readings in physicians’ offices (Niyonsenga et al., 2008).
As mercury manometers are being phased out because of the toxic potential of mercury spills and with the inaccuracies of aneroid manometers, automated oscillometric devices are increasingly being used, which should improve the accuracy of readings.
Bladder Size
The width of the bladder should be equal to approximately two-thirds the distance from the axilla to the antecubital space; a 16-cm-wide bladder is adequate for most adults. The bladder should be long enough to encircle at least 80% of the arm. Erroneously high readings may occur with the use of a bladder that is too short (Aylett et al., 2001) and erroneously low readings with a bladder that is too wide (Bakx et al., 1997).
Most sphygmomanometers sold in the U.S. have a cuff with a bladder that is 12 cm wide and 22 cm long, which is too short for patients with an arm circumference greater than 26 cm, whether fat or muscular (Aylett et al., 2001). The British Hypertension Society (BHS) recommends longer cuff size (12 × 40 cm) for obese arms (O’Brien et al., 2003). The American Heart Association recommends progressively larger cuffs with larger arm circumference:
- Arm circumference 22 to 26 cm, 12 × 22 cm cuff (small adult)
- Arm circumference 27 to 34 cm, 16 × 30 cm cuff (adult)
- Arm circumference 35 to 44 cm, 16 × 36 cm cuff (large adult)
- Arm circumference 45 to 52 cm, 16 × 42 cm cuff (adult thigh)
Children require smaller cuffs depending on their size.
Cuff Position
With mercury manometers, if the bladder within the cuff does not completely encircle the arm, particular care should be taken to ensure that the bladder is placed over the brachial artery. The lower edge of the cuff should be approximately 2.5 cm above the antecubital space. In extremely obese people, a thigh cuff may be used with the wide bladder folded on itself if necessary, or the bladder may be placed on the forearm and the sounds heard over the radial artery.
Manometer
Oscillometric devices are rapidly taking over the home market and are becoming standard in offices and hospitals. Fortunately, their accuracy and reliability are improving, and more have passed the protocols of the U.S. Association for the Advancement of Medical Instrumentation (AAMI) and the BHS. Web sites (www.dableducational.com and bhsec.org/blood_pressure.list.stm) have been established to provide all of the available information needed about the devices being marketed.
The oscillometric devices detect initial (systolic) and maximal (mean arterial pressure) oscillations in the brachial artery and calculates the diastolic BP based on proprietary algorithms. In general, the readings obtained by auscultatory and oscillometric devices are closely correlated. In a large population wherein both oscillometric devices (Omron HEM-907XL) and mercury manometers were compared, the mean differences were less than 2 mm Hg except in obese subjects requiring the extra-large cuff where the systolic difference averaged 3.1 mm Hg (Ostchega et al., 2012).
The oscillometric devices are easier and faster to use, and they minimize the common terminal digit preference wherein the last number is rounded off to 0 or 5. Some of the electronic devices inflate automatically, which is especially useful for patients with arthritis. Others have a printer attached, and some can have the data downloaded after storing a number of readings. Devices are available for automatic transmission of data to a central location (Møller et al., 2003). An adequate device can be purchased for less than $40. To ensure its proper use and accuracy, the electronic device should be checked by having the patient use it on one arm while the pressure is simultaneously taken in the office with a sphygmomanometer on the other arm.
If at least three measurements are taken, oscillometric devises provide accurate readings in patients with atrial fibrillation (Pagonas et al., 2013).
Automated Office BP Measurement
Martin Myers (2012a) has proposed a way to improve the accuracy of office readings by “an automated office blood pressure (AOBP)” procedure, which requires five readings, taken at 1-minute intervals, with a fully automatic oscillometric device while the patient sits alone, undisturbed. Myers et al. (2010) provide evidence that the average of these five readings closely approximates those obtained both during the awake portion of 24-hour ambulatory monitoring and multiple self-recorded home readings. This procedure virtually eliminates the white-coat effect and reduces the prevalence of masked hypertension as well (Myers et al., 2012).
As attractive as this procedure is, it does require a dedicated space in the office and an automated device that may cost $600.
Meanwhile, a low-cost solar-powered device (Omron HEM-SOLAR) has been developed, which should be useful for low-resource settings (Parati et al., 2010a).
Another Technology
A new manometric device has been developed by Fujikawa et al. (2013), which uses a triple cuff and measures changes in pulse arrival time rather than oscillations in the cuff as it deflates. This technique may be a more accurate way to measure BP.
Wrist and Finger Devices
Wrist oscillometric devices are particularly useful for obese people whose upper arm is too large for accurate readings. They must be kept at the level of the heart. At least three of them have been shown to be accurate (dableducational.com).
Finger devices measure the pressure in the finger by volume-clamp plethysmography. The Finapres finger cuff may be used for continuous BP monitoring under carefully controlled conditions (Silke & McAuley, 1998), but it is not suitable for intermittent readings. Home finger units are not recommended for self-monitoring (Pickering et al., 2008).
Automated Devices in the Community
The automated oscillometric devices increasingly found in pharmacies usually provide accurate readings but may be inaccurate in people who are either obese or very thin (Van Durme et al., 2000). For those who cannot use more accurate (and more easily validated) home devices, readings obtained by such an automated machine are better than nothing, but patients should not be managed solely on the basis of these readings.
Technique for Measuring Blood Pressure
As noted in Table 2-3, the pressure in the bladder should be raised at least 20 mm Hg above the systolic level, as indicated by the disappearance of the radial pulse, because there may be an auscultatory gap (a temporary disappearance of the sound after it first appears), which is related to increased arterial stiffness.
Related posts:

Stay updated, free articles. Join our Telegram channel

Full access? Get Clinical Tree


