Fig. 2.1
Surface based morphometry (SBM) and voxel based morphometry (VBM) comparing cohorts of healthy controls and ALS patients. The analyses highlight motor cortex atrophy and additional grey matter changes in frontal and temporal brain regions of ALS patients compared to healthy controls
2.3 Voxel-Based Morphometry
VBM is one the most widely used grey matter techniques which enables the statistical comparison of study groups, correlations with clinical parameters and retrieval of information from the individual patient data. The standard VBM pipeline begins with the tissue-type segmentation of three dimensional structural data into grey matter, white matter and CSF components. The resulting grey matter data is then registered to a standard anatomical reference system, such as the “MNI space”, typically using non-linear registration. In order to equally represent the anatomical features of the various study groups a study-specific symmetrical grey matter template is created to which all native grey matter data is subsequently registered, modulated to correct for local expansion or contraction and finally smoothed. Statistical analyses are carried out following these preprocessing steps, applying general linear models and using permutation-based non-parametric testing.
2.4 Surface-Based Morphometry
The pre-processing steps of cortical thickness measurements include motion corrections, averaging of the structural T1-weighted data, removal of non-brain tissues, segmentation of the subcortical white matter and deep grey matter volumetric structures, intensity normalization, tessellation of the grey matter-white matter boundary, and automated topology corrections. Surface inflation and registration to a spherical atlas utilizes individual cortical folding patterns to match cortical geometry across subjects. Regions of significant cortical thickness differences are explored following these pre-processing steps separately in left and right hemispheres typically using False Discovery Rate (FDR) corrections to correct for multiple comparisons.
2.5 Quantitative Neuroimaging: Diffusion Tensor Imaging (DTI)
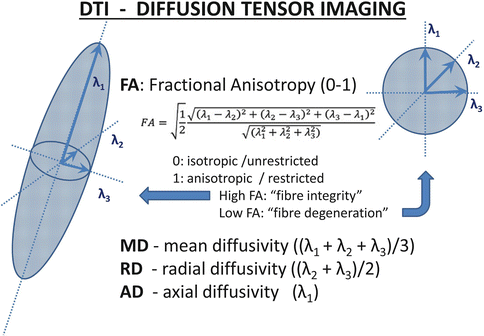
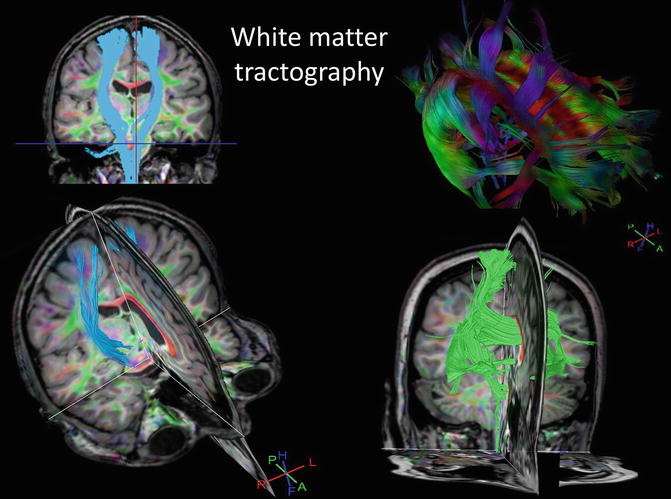
DTI is based on the principle that water molecules move freely and randomly in any direction in an unrestricted medium, their movement is “isotropic”. In a biologic environment however, such movement is restricted by various membranes, fibers and macromolecules. Thus, at a tissue level the direction of movement of water molecules would be restricted in certain directions and less restricted in others. Relatively restricted movement, “anisotropy” suggests cellular integrity in the CNS, e.g., water movement is restricted perpendicular to the main axis of axon whereas water molecules move relatively freely along the main axis of the axon. A large number of DTI derived metrics is utilized to characterize white matter integrity at a voxel level, such as fractional Anisotropy (FA), mean diffusivity (MD), radial diffusivity (RD), or axial diffusivity (AD). Other indices include relative anisotropy, linear component, planar component, spherical component. The most frequently reported diffusivity parameter is fractional anisotropy (FA), where a high value close to 1 indicates fiber integrity (anisotropy) and a relatively lower value indicates pathological change. Axial diffusivity (AD) is generally regarded as a marker of axonal integrity and radial diffusivity (RD) is considered a marker of myelination Fig. 2.2. Based on these measures, a number of statistical methods have been devised to measure white matter alterations in specific white matter tracts, crossing-fibers, or to measure structural connectivity between brain regions. Tractography, high-angular-resolution diffusion imaging, Q-ball vector analysis and tract-based spatial statistics are just some of the many DTI-based imaging techniques Fig. 2.3.


Fig. 2.2
Principles of diffusion tensor imaging and the most frequently utilized diffusivity measures

Fig. 2.3
Example of diffusivity based white matter tractography highlighting the corticospinal tracts and the commissural fibers of the corpus callosum
2.6 MR Spectroscopy
Spectroscopy provides metabolic information on selected brain regions. MRS is most frequently based on proton, sodium, or phosphorous nuclei. Proton spectroscopy provides good signal to noise ratio enabling the reliable measurement of brain metabolites. MRS data may be collected from selected regions-of-interest (ROI), but more recently whole-brain MRS sequences have also been developed. Single Voxel Spectroscopy (SVS) is used where the study hypothesis is linked to a well-defined ROI. Multi-voxel techniques, such as Chemical Shift Imaging (CSI) is used when metabolic changes are mapped over larger brain regions. MRS data acquisition typically includes shimming of the magnetic field to correct for field inhomogeneity and the suppression of water signal in order to accurately detect metabolite peaks in the spectra. The most commonly measured metabolites include N-acetyl Aspartate (NAA), Choline (Cho), Creatine (Cr), Lactate, Myo-inositol, GABA, Glutamate (Glx). Choline is regarded as a marked of cell membrane turnover marker, and is associated with cell division and membrane breakdown such as demyelination. Creatinine is linked to metabolic activity and decreased creatine levels may be indicative of tissue necrosis secondary to hypoxia or neurodegenerative process. N-acetyl Aspartate (NAA) is generally regarded as a marker of neuronal integrity, and decreased NAA in comparative analyses is typically interpreted as a proxy for degenerative change. Lactate is a marker of anaerobic metabolism indicative of hypoxia, ischemia or mitochondrial pathology. Myo-inositol is generally regarded as a glial cell marker and increased levels have been associated with Alzheimer type and HIV-associated dementias. Increased Glutamate and Glutamine have been associated with hepatic encephalopathy.
2.7 Positron Emission Tomography (PET)
PET is one of the most versatile functional imaging techniques, which uses radioactive isotopes to assess metabolic changes in various brain regions. The most commonly used isotopes include 18-Fluorodeoxy-Glucose (FDG), 18F-6-flourodopa a dopamine precursor, C-PK11195 indicates neuroinflammation by binding to translocator proteins, 11C-Flumazenil which binds to GABA-A receptors, 11C-PMP measures acetylcholinesterase activity, WAY-100,635 binds to 5 –HT1a receptors, and C-L-Deprenyl which binds to MAO-B. Novel PET ligands contribute increasingly to our understanding of neurodegenerative changes by mapping selectively distinct physiological networks. In spite of its cost implications, requirement for a near-site cyclotron to produce short half-life isotopes and its limited availability, PET offers unrivalled sensitivity to highlight disease-specific pathology. Combined PET/MRI scanners are increasingly used in research institutions to capitalize on the high spatial resolution of MRI and the receptor-specificity of PET.
2.8 Functional MRI (fMRI)
FMRI is a non-invasive functional imaging technique which evolved from being a tool of experimental physiology and psychology into an instrument routinely used in epilepsy surgery planning and research studies of neurodegeneration. fMRI measures the blood oxygen dependent (BOLD) signal in the brain tissue to assess areas of metabolic activity either at rest or during specific tasks. Areas with higher metabolic activity utilize more oxygen leading to regional increase in BOLD signal, which is referred to as the hemodynamic response (HDR). FMRI is therefore an indirect indicator of neural activity and has inferior temporal resolution and superior spatial resolution compared to EEG. Accordingly, FRMI studies are often combined with simultaneous EEG recording. The most commonly used study design is the “block design” or “subtraction paradigm” where two conditions are alternated in blocks while a certain number of fMRI scans are acquired. Resting state fMRI is a more novel application which allows the detection of relatively independent brain networks and the assessment of circuit integrity. The most frequently assessed circuits include the default mode network, sensory-motor, visual and auditory networks.
2.9 Multi-center Imaging Studies
Standardisation and optimisation of magnetic resonance protocols across multiple sites and MRI platforms is challenging. However, multicentre neuroimaging is routinely used in clinical trials of multiple sclerosis drugs with established cross-platform harmonisation and calibration protocols. Validation of multicentre imaging data normally involves the scanning of the same MR phantoms or controls at all of the participating scanners. Multicentre MR studies have been successfully conducted in Alzheimer’s disease, Huntington disease, FTD and ALS. International data repositories have been established by various disease-specific consortia, such as the Alzheimer’s disease neuroimaging initiative (ADNI), TRACK-HD or the Neuroimaging society in ALS (NISALS). The cross platform calibration of ADNI utilising travelling MRI phantoms has been comprehensively described and published. The obvious advantage of such collaborations is generating large patient numbers of relatively rare disease phenotypes. The challenges of such initiatives on the other hand include the difficulties around cross-platform harmonisation across different scanner field-strengths and manufacturers, funding and authorship issues, time contribution of participating individuals, data management, storage and protection, ethics approvals etc.
2.10 Neuroimaging Features of Amyotrophic Lateral Sclerosis
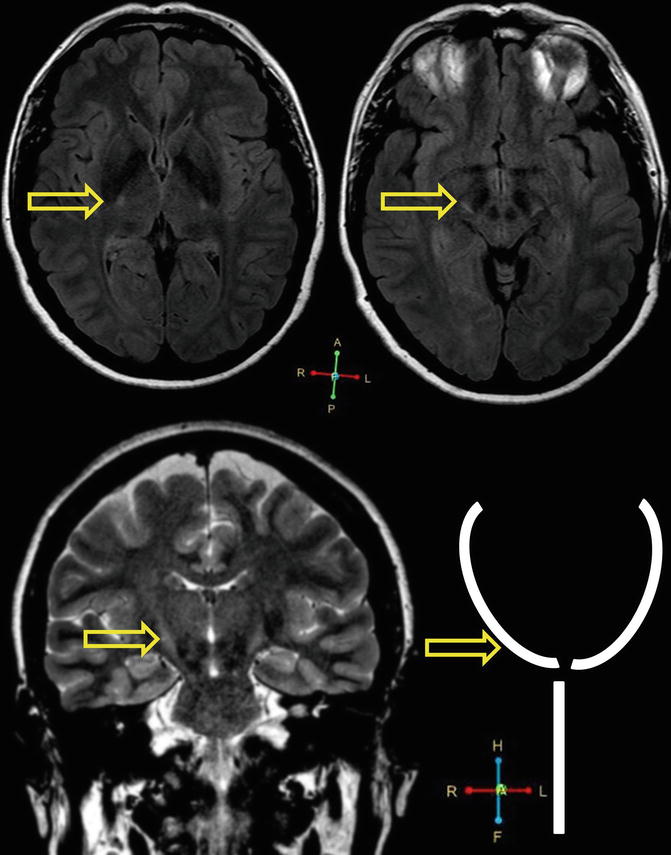
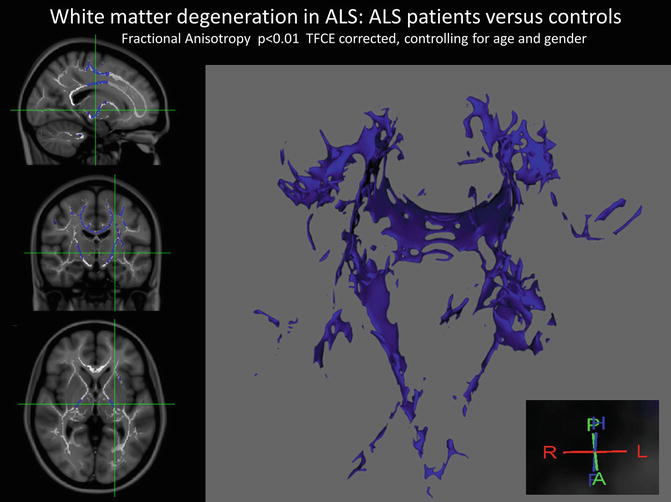
Amyotrophic Lateral Sclerosis (ALS) is a relentlessly progressive neurodegenerative disorder. The diagnostic, genetic and clinical aspects of ALS are discussed in detail in Chap. 8. Until relatively recently, ALS has been regarded as pure motor system disorder, however there is now compelling clinical, post mortem and imaging evidence that the disease spreads well beyond the motor cortex affecting frontotemporal, basal ganglia, and cerebellar regions. Standard clinical imaging with T1 and T2-wieghted and Flair imaging is usually performed in the diagnostic phase of the disease to rule out alternative diagnoses. Hyperintensities along the corticospinal tracts are frequently observed on FLAIR and T2-weighted MRI, but these imaging cues are poorly specific to ALS. Hyperintensities along the pyramidal tracts on coronal imaging is sometimes referred to as the “wine glass sign” Fig. 2.4. Motor disability, the degree of cognitive impairment, and the rate of disease progression vary significantly among ALS patients leading the significant clinical heterogeneity which makes the identification of core ALS-specific imaging signatures challenging. Nonetheless, neuroimaging in ALS has contributed significantly to the characterization of ALS-related pathology in vivo, highlighting disease-specific features such as corpus callosum degeneration, corticospinal tract degeneration and motor cortex atrophy Fig. 2.5. Furthermore, multiparametric imaging methods have been successfully utilized to describe the distinctive imaging signatures of key ALS phenotypes, such as patients with bulbar or spinal onset disease. Quantitative MRI techniques and PET has also been extensively utilized in ALS to characterize the distinct pathological patterns associated with the C9orf72 or SOD1 genotype (Bede et al. 2013).


Fig. 2.4
Corticospinal tract hyperintensity in a 57 year old, left handed female patient with ALS, ALSFRS-r: 37, disease duration from symptom onset to scan: 10 months. Axial MRI imaging (top) and coronal imaging (bottom) is presented. Coronal imaging in ALS occasionally reveals high signal along the bilateral corticospinal tracts, which is sometimes referred to as the “Wine glass sign” or “Wine glass appearance”. Arrows indicate hyperintensities along the corticospinal tracts

Fig. 2.5
White matter degeneration in ALS demonstrated by diffusion tensor imaging and tract-based spatial statistics based on fractional anisotropy (FA) measurements. The identified white matter regions include the body of the corpus callosum, the descending pyramidal tracts and white matter regions subjacent to the primary motor cortices
VBM and SBM studies of ALS consistently highlight grey matter atrophy in precentral gyrus, pre-motor regions, frontal and superior temporal regions Fig. 2.1. VBM studies confirmed that patterns of grey matter atrophy within the motor cortex define the clinical phenotype. Patients with bulbar onset disease have focal atrophy in the bulbar segment of the motor homunculus compared to spinal onset patients and vice versa. Furthermore, the degree of focal cortical pathology measured by VBM or SBM correlates with clinical disability. VBM and SBM studies of ALS also confirmed extra-motor cortical involvement affecting frontal and temporal brain regions especially in patient cohorts carrying the c9orf72 hexanucleotide repeats. More recently, high resolution structural MRI data has been utilized to assess basal ganglia involvement in ALS confirming significant subcortical grey matter involvement, particularly in the thalamus, accumbens nuclei, caudate nuclei and hippocampi. These findings are consistent with the clinical observations of frontostriatal and corticobasal dysfunction and support the notion that motor disability is complicated by extrapyramidal deficits in ALS. Finally, grey matter studies of ALS confirmed significant cerebellar involvement. White matter studies of ALS invariably highlight corticospinal, corticobulbar and corpus callosum degeneration Fig. 2.4. Similarly to grey matter studies, DTI has also confirmed frontotemporal white matter pathology supporting clinical observations of cognitive and behavioral deficits. The posterior limb of the internal capsule and mid-body of corpus callosum are key sites of white matter degeneration in ALS which can be easily detected by DTI studies. Early magnetic resonance spectroscopy studies of ALS reported NAA:Cr ratio reductions in the motor cortex and later studies conformed extra-motor metabolic abnormalities in the frontal cortex and thalamus. Similarly to VBM studies, metabolic changes have been correlated to motor disability and to certain ALS genotypes. Longitudinal MRS studies have shown progressive NAA reductions, and MRS studies have identified metabolic changes in the cervical spinal cord asymptomatic SOD1 mutation carriers. MRS studies of ALS have shown reductions in cortical levels of GABA suggesting GABA mediated inhibitory dysfunction. Finally MRS was used to demonstrate Riluzole effect in treated patient populations.
FDG PET studies in ALS have shown hypometabolism in the motor cortex, motor association areas and parietal lobes. Patients with predominantly upper motor neuron signs exhibited reduced cortical glucose metabolism compared to lower motor neuron predominant patients. PET studies have identified sensitive correlations between metabolic changes and functional disability measured by rating scales (ALSFRS-r). ALS patients with cognitive impairment have shown additional metabolic changes in the dorsolateral prefrontal cortex, anterior insula, and anterior thalamic nuclei. Finally, FDG PET has been utilized to characterize ALS patients with the C9orf72 mutation, confirming focal hypometabolism in the cingulate gyrus, insula, caudate, thalamus, superior temporal cortex, globus pallidus and midbrain complementing the structural MRI findings of this patient population. Unsurprisingly, connectivity studies of ALS demonstrated decreased motor network connectivity. However, beyond the motor network, an increased overall functional connectivity has been identified in ALS which is likely to be secondary to inhibitory dysfunction and GABAergic changes. The neuroimaging features of ALS are summarized in Table 2.1.
Table 2.1
Neuroimaging features of ALS
Imaging modality | Main findings |
|---|---|
Standard clinical imaging
Stay updated, free articles. Join our Telegram channel
Full access? Get Clinical Tree
 Get Clinical Tree app for offline access

|


