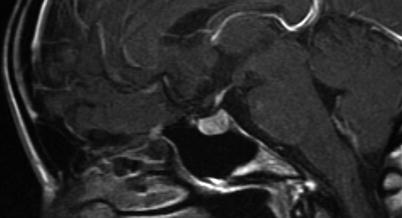
Fig. 2.1
CT image in sagittal-plane reformation shows the shape and size of the sella, with the pituitary gland and stalk clearly visualized
In evaluating sellar lesions, CT has an advantage over MRI because of its superior capability in visualizing bony detail and calcifications. For example, pituitary adenomas often grow slowly, allowing time for bone remodeling that is evident by demonstration of smooth cortical margins (Fig. 2.2). In contrast, an aggressive process such as a malignancy or infection can permeate or erode the bone, resulting in indistinct cortical margins. CT is also sensitive to the presence of soft-tissue calcifications that are uniquely found in a subset of sellar pathology, including vascular aneurysm, germ cell neoplasm, and craniopharyngioma. Finally, CT angiography can be helpful in confirming the presence of aneurysms that may mimic pituitary pathology and can demonstrate the spatial relationship between sellar lesions and adjacent intracranial arteries during preoperative planning.
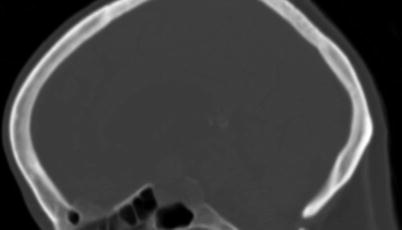

Fig. 2.2
Sagittal-plane CT image in bone window shows smooth expansion of the sella caused by a pituitary macroadenoma
2.1.1.1 Magnetic Resonance Imaging (MRI)
Because of its exquisite soft-tissue contrast and lack of ionizing radiation, MRI is the imaging modality of choice for evaluation of sellar and parasellar pathology. Because the dimensions of the sella turcica are approximately 10 × 10 × 10 mm for normal adults, an inter-slice thickness of smaller or equal to 3 mm (without gap) is needed to generate at least 3 slices through the content of the sella (Fig. 2.3). When the sella is imaged in coronal and sagittal planes at 3-mm inter-slice thickness, lesions larger than 3 mm should be detectable on both planes. The multiplanar capability of MRI not only allows initial diagnosis of sellar pathology but also facilitates preoperative planning and posttreatment surveillance for recurrence.


Fig. 2.3
Three consecutive coronal-plane T1-weighted images through the sella demonstrate a normal sized pituitary gland. The image on the left shows T1 shortening within the posterior pituitary
Although noncontrast-enhanced MRI can detect and characterize sellar pathology larger than the normal gland, small adenomas often exhibit image contrast nearly identical to the surrounding pituitary gland unless the lesions contain fluid or proteinaceous or hemorrhagic material. The standard pituitary protocol used in our institution includes sagittal and coronal T1-weighted spin-echo sequences through the sella using a small field of view (20 × 25 cm), thin slices (3 mm), and a high-resolution matrix (256 × 512), performed both before and following intravenous gadolinium administration. The protocol also includes 0.5-mm volumetric 3D T2-weighted steady-state free precession (T2 SSFP) sequence (e.g., FIESTA, CISS, etc.) in the sagittal plane through the sella, whole-brain axial fluid-attenuated inversion recovery (FLAIR), diffusion-weighted imaging (DWI), and postgadolinium volumetric 3D T1-weighted sequence (e.g., MPRAGE or SPGR). The whole-brain 3D volumetric postgadolinium sequence provides lesion coregistration to surgical guidance software and also allows confirmation of small lesions (equal to or smaller than 3 mm) occasionally observed only on one of the two 3-mm spin-echo imaging planes. In our experience, this protocol could identify a majority of sellar/parasellar pathology, greatly reducing the need to perform repeated evaluations for small adenomas using dynamic gadolinium-enhanced MRI.
For detection of small pituitary adenomas that are not apparent on delayed contrast-enhanced MRI, dynamic contrast MRI can be performed to increase lesion-to-gland contrast based on different contrast wash-in and wash-out properties between adenomas and pituitary tissues. Immediately following an intravenous bolus injection of gadolinium (0.05 mmol/kg), six sequential sets of three images are acquired every 10 s using a three-dimensional Fourier transformation gradient echo or fast turbo spin-echo sequence. For a normal pituitary gland, the stalk and posterior part of the gland enhance first because of their direct arterial supply, followed by the anterior part of the gland that receives blood from the hypophyseal-portal system. The entire gland enhances homogeneously between 30 and 60 s. The maximal difference in the degree of enhancement between the normal pituitary tissue and adenomas often occurs during 30–60 s after the contrast administration, with the majority of adenomas appearing relatively hypoenhancing relative to the avidly enhancing pituitary gland. After 60 s, the contrast medium within the pituitary gland begins to wash out, but the adenomas often continue to take up contrast; peak enhancement occurs up to 200 s [1]. As a result, the imaging contrast between the adenoma and the pituitary tissue reduces after reaching maximum enhancement and can become reversed, with adenomas appearing more hyperintense compared with the pituitary gland on delayed imaging [2]. Some adenomas may enhance very early following contrast administration, possibly secondary to direct arterial supply, and dynamic contrast MRI can identify these adenomas as hyperintense lesions during the earliest time points [3].
2.2 Normal Sellar Anatomy on Imaging
Sagittal T1-weighted imaging through the midline plane provides a good overall survey of the shape of the sella and its content as well as the surrounding structures (Fig. 2.4). On coronal planes through the sella, paired cavernous sinuses are located lateral to the sella (Fig. 2.5).
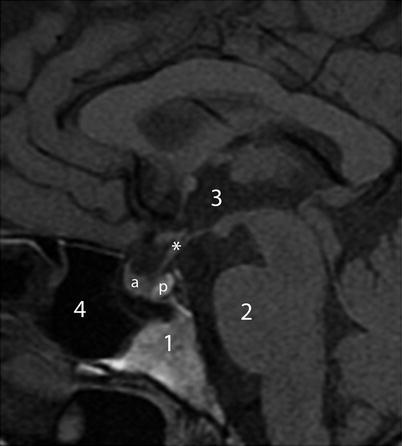
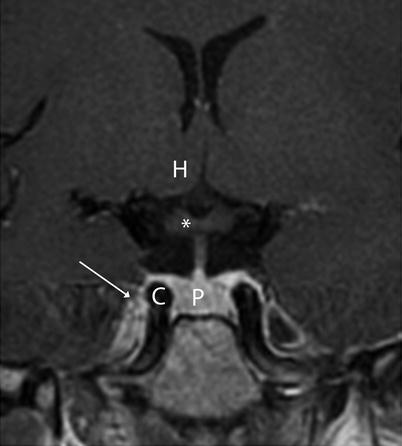

Fig. 2.4
Sagittal T1-weighted image without contrast. Asterisk indicates pituitary stalk. Key: 1 clivus, 2 Pons, 3 third ventricle, 4 sphenoid sinus, a anterior pituitary gland, b posterior pituitary gland

Fig. 2.5
Coronal T1-weighted image without contrast. Asterisk indicates optic chiasm. Key: C cavernous sinus (arrow), H hypothalamus, P pituitary gland
2.2.1 Pituitary Gland
The two anatomically and functionally distinct lobes of the pituitary gland—the anterior lobe (adenohypophysis) and the posterior lobe (neurohypophysis)—can often be distinguished on noncontrast sagittal T1-weighted images, since the posterior lobe is usually more hyperintense (posterior pituitary bright spot) than the anterior lobe (Fig. 2.6). The posterior pituitary hyperintensity is thought to result from the T1-shortening effect of the neurosecretory vesicles in the posterior pituitary lobe [4]. Absence of this T1-hyperintense spot in the posterior sella can be a sign of congenital/developmental abnormality as well as pathologic interruption of hypothalamic secretion, which often clinically accompanies diabetes insipidus. There is normal variation in the size of the pituitary bright spot, with the long axis ranging from 0.4 to 4.4 mm [5]. The size of the spot is also age-dependent, resulting in a visibility rate decline of approximately 1 % per year [6]. It is important to distinguish the posterior pituitary from bone marrow within the nearby dorsum sella that can also appear hyperintense on T1-weighted imaging.
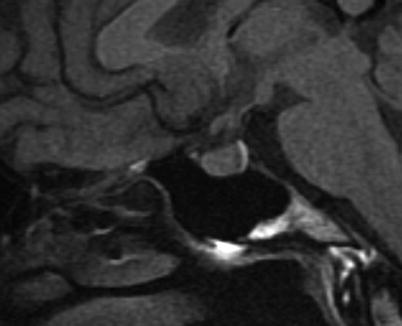

Fig. 2.6
Sagittal T1-weighted image without contrast shows posterior pituitary T1 shortening
2.2.1.1 Normal Gland Size
The size and shape of the pituitary glands are variable and can be influenced by age and sex. The height of the gland can be as much as 9 mm, and the superior margin of the gland may appear convex in normal female patients, particularly at a younger age [7]. The pituitary height in normal female subjects, on average, is greater than that in normal male subjects [8]. If stratified by age groups, the sex-related differences were significant only in the 10- to 19-, 20- to 29-, and 50- to 59-year-old age groups. The pituitary height peaked in the 20–29 age group and tended to decline with age. A practical rule of determining normal gland height can be summarized as 6 mm for children, 8 mm in men and postmenopausal women, 10 mm in women of reproductive age, and 12 mm for women in late pregnancy or postpartum women [9].
2.2.1.2 Pituitary Stalk
On midline sagittal plane, the pituitary stalk extends from the infundibular recess of the third ventricle anteriorly and inferiorly to the pituitary gland. The stalk normally enhances homogeneously immediately following contrast administration. The superior segment of the stalk can appear thicker than the caudal/anterior segment, but the transition should be smooth (Fig. 2.7). This should be differentiated from the nodular thickening of the stalk in pathologic conditions. On high-resolution MRI at 3 T, the normal pituitary stalk in adults has an anteroposterior diameter of 2.32 plus or minus 0.39 mm near the insertion and 3.35 plus or minus 0.44 mm at the level of the optic chiasm [10]. Thickening of the pituitary stalk by more than 4 mm, with or without gland involvement, can be seen in a wide variety of inflammatory and neoplastic processes. With high-resolution T2-weighted SSFP imaging, the superior portion of the stalk can appear hollow (Fig. 2.8). Deviation of the stalk from the sagittal midline plane can result from the mass effect of an underlying pituitary lesion in the opposite direction of the stalk deviation (Fig. 2.9). With suprasellar extension of an intrasellar mass, the pituitary stalk can be superiorly displaced (Fig. 2.10). Other common causes of stalk deviation include previous surgery or the presence of an arachnoid cyst. In the postoperative setting, the stalk can be markedly thinned and may not be completely visualized using standard MRI sequences. Interruption of the pituitary stalk can occur, often in the setting of congenital growth hormone insufficiency, and is usually associated with an ectopic posterior pituitary bright spot as well as a hypoplastic anterior gland [11].

