where ∇2 is the second spatial gradient operator, Φ is the scalar potential in volts, ρ is the free charge density, and ε is the permittivity of the mass of tissue. Multiple sources can be shown to combine linearly, so that a combination of sources results in the arithmetic sum of the potential distributions that each would produce individually.
The corresponding inverse problem can be stated as follows: Given a surface potential distribution and the volume conductor geometries and properties, determine the underlying charge distribution. Unfortunately, a given surface map can be produced by any of an infinite number of possible source distributions. EEG records at a distance from the sources and employs only a limited number of sensors—typically 20 to 30 in a routine scalp EEG. Therefore, this problem generally has no unique solution (33). Nevertheless, simplifying assumptions are usually made: (i) The source dipole is near the surface; (ii) the source dipole is perpendicular to the surface; (iii) the head is a uniform, homogeneous volume conductor; (iv) at least one recording electrode is essentially over the source; and (v) the reference is not contained in the active region.
On the basis of these assumptions, one generally looks for a single predominating potential maximum on the surface, with the source lying directly below it; however, a variety of nondipolar source configurations could produce the same observation. For example, a simple monopolar charge buildup, a curved dipole sheet, or a finite-thickness dipole “pancake” would all produce a single well-defined maximum. In addition, signals originating from confined but deep-seated generators will be broadly distributed when recorded from the surface (34,35), and these cannot be reliably distinguished from more superficial but widespread epileptic regions.
In addition to these “equivalent” source possibilities, others are physiologically similar but generate very different surface maps. Through variations in orientation and shape, dipole sheets can produce charge reorientation and cancellation. The resultant range of possible scalp distributions serves as a reminder that observed scalp maxima do not necessarily lie directly above maximal brain activity. Jayakar et al. (36) have pointed out the difficulties in localizing epileptic foci on the basis of simple models, owing to effects from dipolar orientation, anatomic variations, and inhomogeneities, among other factors.
Volume Conduction
In a volume conductor, the electrical field spreads instantaneously over an infinite number of pathways between the positive and negative ends of the dipole. Outside the neuron, the circuit is completed by the current flowing through the extracellular fluid in a direction opposite to the intracellular current. Through the process of volume conduction, electrical activity originates from a local field generator and spreads through a conductive medium to be picked up by a distant recording electrode. Volume conduction is passive—that is, it does not involve active regeneration of the signal by intervening neurons or synaptic relays—and occurs as easily through saline as through brain parenchyma. Potentials recorded by way of volume conduction are picked up synchronously and at the speed of light at all recording electrodes. Although attenuated with distance by the medium, volume-conducted components preserve their original polarity and morphology.
The attenuation factor is defined by the inverse square law: That is, the recorded electrical potential falls off in direct proportion to the square of the distance from the generator (37,38). For example, a 100-μV potential seen at the electrode directly overlying a cortical generator (assume a distance of 1 cm away) will be reflected as a 4-μV potential at an electrode that is 5 cm away and as only a 1-μV potential at 10 cm away. The rapidity of this falloff is a function of the depth of the generator, with more superficial generators falling off much more rapidly. Distant generators have a “flat” falloff, one of the hallmarks of a “far-field” potential (Fig. 7.1).
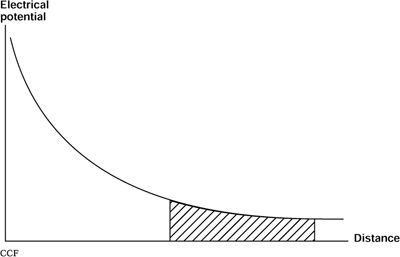
Figure 7.1. The electrical potential recorded by an electrode decreases in a parabolic fashion the farther away from the source it is. The difference recorded between two electrodes close to the source (near-field potentials) will be greater than the differential recordings from the tail of the curve. These far-field potentials (in the shaded region) are also lower in absolute amplitude.
The medium through which current travels to reach the recording electrode is not homogeneous but rather exhibits a variety of conductivities (39). As the current attempts to complete its circuit by following the path of least resistance, these differences in conductivities, especially differences among cerebrospinal fluid (CSF), skull, and scalp, and their associated boundaries, affect the electrical potential recorded on the scalp. The signal is not only altered in amplitude but is also stretched out during its passage to the surface because of the spatial summation and shunting effects of the intervening layers. In the skull, the conductivity in a tangential direction is higher than in a direction perpendicular to the surface. This produces a “smearing effect” on the surface potential distribution (40). Although the current tends to flow along the path of least resistance, there is still some flow throughout the volume conductor, thereby permitting recording of the electrical potential at all sites on the volume conductor, albeit with the amplitude inversely related to the square of the distance from the source (see Fig. 7.1).
The head also contains normal or abnormal openings that present low-resistance paths to conducted currents. The current tends to flow toward skull defects, whether physiologic (such as foramina) or acquired through trauma or surgery, and around cavities (such as the ventricles), markedly distorting the field in the region of the defect. The resistivity of scalp or brain tissue is many times smaller than that of bone (41–43). As a result, surface potentials near these openings will be unusually high, and the largest potentials can be seen at the location of the defect even when the source is several centimeters away from the defect (40,44,45).
Surface Electrical Manifestations
A variety of real-world considerations complicate the interpretation of surface recordings. Because the dipoles measured at the scalp ordinarily are oriented radially, scalp electrodes see primarily the positive or the negative pole—but usually not both. Although generators located at the apex of a gyrus lie perpendicular to the scalp (i.e., vertical dipoles), any generator within a cortical fissure will present a dipole at an angle to the scalp. Nearly 70% of the cortical surface lies within the sulcal depths (46). In addition, many brain areas—most notably the mesial frontal, parietal, occipital, and basal temporal cortex—are diversely oriented and lie at varying distances from surface electrodes. Hence, it is not sufficient to assume that the generator must be close to the point where the maximum potential is recorded (7). Finally, the choice of reference affects the form of the EEG measurements.
When a generator dipole is oblique or parallel to the scalp, the resulting surface potentials can lead to false localization of the potential maximum. The typical bell-shaped distribution of the electrical field is replaced by one shaped like a sideways “S” in this circumstance. Because both the positive and the negative ends of the dipole may be recorded at the scalp, the surface potential can exhibit two “maxima” of opposite polarity. Between the two ends will be a zero isopotential boundary where the generator will not be picked up at all (Fig. 7.2).
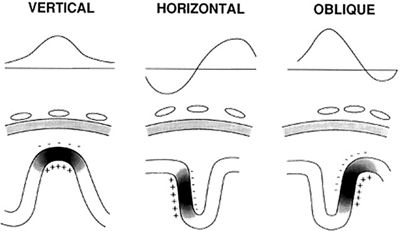
Figure 7.2. There are unusual sources wherein both the negative and the positive poles are recorded on the surface. The bottom row of figures shows a patch of cortex containing gyri and sulci. The darker areas represent the cortical mantle that is activated by an epileptic discharge, with negative and positive poles highlighted. In the middle row of illustrations, the positions of the electrodes on the scalp, relative to the discharging cortex, are shown. The top row illustrates the voltage that would be recorded on the EEG as a function of the distance along the scalp right below it.
It is important to distinguish true horizontal dipoles, such as those arising at a sulcus or the interhemispheric fissure, from field distributions resulting from widely separated activity but giving rise to distinct negative and positive maxima. For example, bisynchronous temporal spikes differing slightly in phase, such that the negative component on the left aligns with the positive component on the right, may appear to represent huge transverse dipoles (36); however, careful evaluation with an alternative reference (or the demonstration that the spikes also occur asynchronously) can prove that the fields represent not the source and sink of a single dipole but rather two generators (47) linked by corticocortical propagation.
When a source lies deeper in the brain, two changes occur: The surface potential becomes smaller and the field becomes more widespread relative to the surface maximum (34,35,48). Although the shape of the electrical field gradient can indicate the type of field and the distance of the generator, identifying the source on the basis of the potential difference between any scalp electrodes becomes increasingly difficult. When the potential field gradient is relatively flat, as is the case in the far-field potential from a deep-seated source, a bipolar montage will display the waveform at relatively smaller amplitude (see Fig. 7.1). Diffuse discharges may be better appreciated on referential montages, assuming that the reference is not involved. An adequate “vantage point” may be impossible with surface electrodes when the focus is deep. It may be impossible to find a scalp electrode reference that is not electrically involved in the active region, and some cases can only be resolved by invasive electrode placements that can monitor more limited areas (see Chapter 82) (32,49–52).
The combination of multiple sources can produce a variety of results. A superficial source can overshadow a deep one, distorting or even hiding it. Because the amplitude of a measured potential is inversely proportional to the square of the distance from the recording electrode, nearby sources can appear significantly higher at the recording electrodes. A given electrode thus has a “view” of the nearby generators, such that dipoles that combine to reinforce each other will have a large net effect, whereas those that cancel will produce a smaller or null potential (53).
Complicating this problem is the fact that the equivalent dipole is an abstraction. In reality, only sources that extend over multiple layers of several square centimeters of cortical tissue have sufficient energy to generate detectable scalp discharges (48,54). An epileptogenic zone almost always consists of a continuum of dipoles, resulting in a sheet or “patch” (55) dipole. Such a source may cover an extended brain region, with the constituent areas lying at various depths and orientations. Since each surface electrode has a three-dimensional cone of pick-up, both reinforcement and cancellation are possible to produce a variety of surface potential distributions. Overall, the conduction phenomena leading to surface potentials follow the “solid-angle” rule (56), that is, the net surface potential is proportional to the solid angle of the cone subtended by the recording electrode, that is, Velectrode = Vsource (Ω/4π). Unless a dipole sheet parallels the surface, the maximum surface potential may be elsewhere than directly over the affected area, as illustrated in Figure 7.3. The solid angle theorem helps to explain the results of multiple synchronously discharging pyramidal neurons arrayed over a cortical region containing both sulci and gyri.
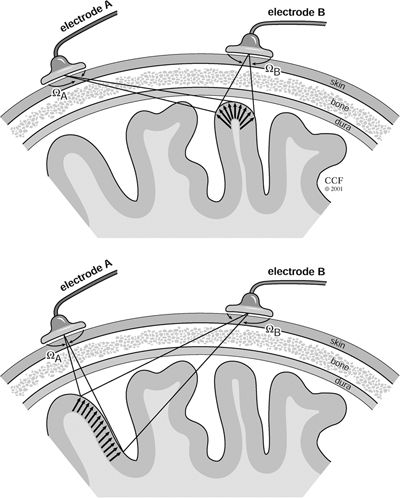
Figure 7.3. Use of the solid-angle rule to ascertain the signal measured on the scalp surface relative to the orientation of the dipole. Top:Surface electrode B sees a large electrical potential because of the orientation and proximity of the dipole layer, as borne out by the solid angle ΩB. Bottom:: In this case, the potential seen by electrode A is actually lower than that measured by the more distant electrode B because of the arrangement of the dipoles in the discharging region. The smaller solid angle, ΩA, is proportional to the voltage measured on the scalp.
In the same way that opposing dipoles can cancel each other relative to a distant electrode, a sheet of nonparallel dipoles can produce a “closed” field (57) whose potential contributions will cancel, resulting in a negligible potential at the surface (58). These generators, usually not visible on scalp EEG, are observed primarily on invasive recordings (53). Even when not a completely closed field, multipolar source–sink configurations tend to produce more cancellation than dipolar generators and to attenuate more quickly as a function of distance (9). This irregular structure is particularly likely in the basal and mesial areas of the temporal cortex and the hippocampus, where cortical infolding is so prevalent (59).
The head consists of a series of roughly concentric layers that separate the brain from the scalp surface. Each of these layers—CSF, meninges, bone, and skin—presents different electrical characteristics to the currents that conduct the EEG to the surface. These layers occasion considerable current spreading, which causes the potential from localized foci to appear in a much broader scalp area (9,60). Spreading in itself would not be an insurmountable problem, because it is theoretically possible to recover deep dipole sources based on observed surface potentials, using appropriate mathematical transformations. Such recovery, however, is guaranteed only in a perfectly spherical concentric conductor, onto which electrodes can be placed in any location. The head is not a perfect globe, however, and significant constraints disqualify the face or neck, which may be preferred for certain sources, as electrode sites.
Electrode Placement as Spatial Sampling
Placement of scalp electrodes should be considered an exercise in spatial sampling. Electrode density must be generous enough to capture the available information but not so closely spaced as to overwhelm with redundant data. Inability to precisely locate a cortical generator may be the result of spatial undersampling (“aliasing”). The assumption that a potential will decrease monotonically as distance increases from the involved electrode is based not only on an uncomplicated electrical field, that is, a monopole (61), but also on an electrode placement sufficiently dense to accurately represent the spatial contours of the field. Cooper et al. (54) suggested that at least 6 cm2 of cortex discharging simultaneously is required to reflect a visible potential on the scalp surface, and more recently, it has been suggested that the required area for surface detectability is even larger, based on simultaneous intracranial and scalp EEG recordings (22,62). Because most epileptogenic potentials seen on the scalp are visible at multiple electrodes, a considerably larger cortical area must be synchronously discharging to produce these potentials (24).
Especially controversial is the detectability of spikes generated in the mesial temporal lobe. Some authors believe that scalp EEG recording of deep sources is possible (63), while others have found it impossible to record spikes from the mesial temporal structures (64,65). Sphenoidal electrodes provide a significantly better view of the mesial area, as shown in Figure 7.4, and are frequently employed in epilepsy monitoring units.
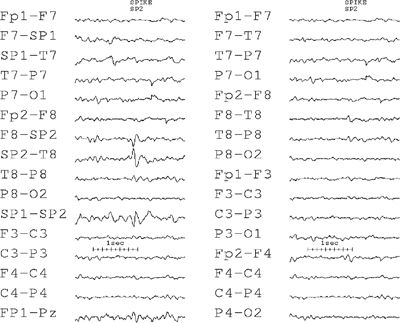
Figure 7.4. This EEG shows an example of a spike that is highly focal in the right sphenoidal electrode. Note that in the conventional double-banana longitudinal montage without the sphenoidals, this discharge is almost invisible.
The widely accepted International 10–20 Electrode Placement System (66), although relatively easy to apply reproducibly, has some inherent limitations in terms of the accuracy of localization (67). When more precise localization is indicated to avoid spatial aliasing, scalp electrodes should be placed at least once every 2.5 cm (68). The maximum spacing can be determined theoretically (24) as well as experimentally, and as many as 128 electrodes (spaced approximately 2 cm apart) may sometimes be necessary (69).
Boundary Problems
Regardless of the fineness of the scalp electrode grid, boundary effects will occur at the edges of the array. The maximum potential must be well within the scope of the recording electrodes to ascertain that a physiologic gradient exists away from the electrode. For example, epileptic sharp waves arising from mesial temporal structures are frequently localized outside the area covered by the 10–20 placement (70–73). It is impossible to determine the complete extent of the maximum fields unless the area is surrounded by regions of lesser activity. Recordings in which the activity is large all the way to the boundary of the region defined by the montage must be “remontaged” to include, if possible, all the relevant electrodes, or further recording must be carried out with additional electrodes. This may be especially complicated when it is difficult to position electrodes inferior to the customary borders of scalp coverage.
A significant portion of the head cannot be practically surveyed, and important brain areas such as the basomesial temporal cortex and other deep sources are only indirectly accessible with standard scalp electrodes. Additional electrodes inferior to the 10–20 system (66) must be employed to provide a better view. In certain circumstances, the information obtained from a combination of closely spaced scalp electrodes such as the international 10–10 system (74–76) and sphenoidal electrodes can obviate the need for more invasive recordings (77).
EEG INSTRUMENTATION CONSIDERATIONS RELATED TO LOCALIZATION
Differential Amplifiers
Amplifiers used in clinical neurophysiology measure the difference between two potentials at the inputs to the amplifier and provide an amplified version of this difference at the output. These devices, called differential amplifiers, eliminate unwanted signals that are identical at both inputs, called common-mode signals. The two terminals at the input to a differential amplifier are sometimes labeled G1 and G2, recalling when a screened “grid” within the vacuum tube amplifier controlled the flow of electrons from cathode to plate. Modern opamp-based differential amplifiers employ complex integrated circuits, and the terms “input 1” and “input 2” are used throughout this chapter.
The amplifier itself has no concept of polarity; it simply does the subtraction and the gain multiplication and then provides an output voltage that is a linear function of the input voltages, according to the following equation:

where Voutput(t) and VinputN(t) are the output and input voltages, and G is the gain of the amplifier. Only during interpretation of the EEG waveform in the context of the underlying generators does the concept of polarity have any meaning. Inexperienced electroencephalographers often mistakenly ascribe a polarity at the input to a specific waveform deviation at the output (12). It should be remembered that there are no positive deflections and no negative deflections. There are only upward and downward deflections (12). Figure 7.5 illustrates four different input conditions that give rise to exactly the same deflection.
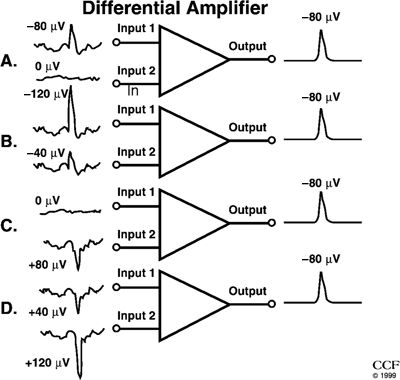
Figure 7.5. A and B:Illustrate a surface-negative spike. Input 1 is more negative than input 2. Because a differential amplifier responds only to the difference between the two inputs (input 1 – input 2), the spikes illustrated will yield identical output voltages; (−80) – (0) is the same as (−120) – (−40). The background electroencephalogram activity, because it is more widespread than the spikes and therefore almost the same at both inputs, is largely canceled out. In (C) and (D), the spike is surface positive, that is, input 2 is more positive than input 1. The calculations (0) – (+80) and (+40) – (+120) both result in an answer of −80, and the background is still canceled out. All four circumstances yield identical outputs despite the differing amplitudes and polarities.
Polarity Conventions
Deflection refers to the vertical direction on the page or display screen in which the waveform component under study appears to go, and it is a function only of the display instrumentation. By EEG convention, upward deflections are caused by input 1 being more negative than input 2. Downward deflections are caused by input 1 being more positive than input 2 (78). These relationships imply nothing about the underlying polarity of the signals at inputs 1 and 2—only the polarity of their differences. When the name of electrode connected to input 1 is written above the deflection and the name of input 2 below, the deflection will point to the electrode with the “relative” negativity as has been done in Figure 7.6.
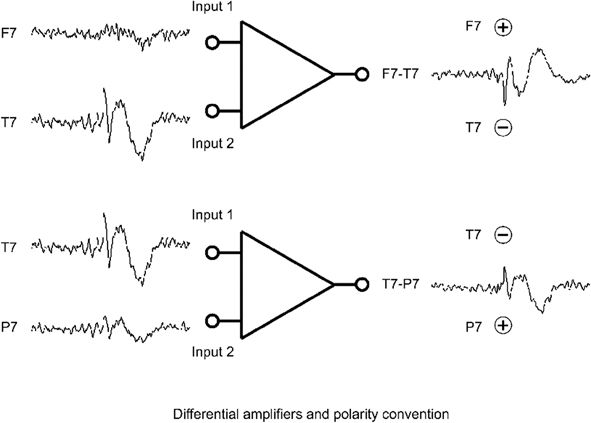
Figure 7.6. Differential amplifier and polarity conventions. The differential amplifier is designed to amplify only the difference between the signals at the two inputs. An upward deflection appearing at the output is caused by input 1 being more negative than input 2. A downward deflection results from input 1 being more positive than input 2. This convention is common to all clinical EEG machines. When the name of the electrode (i.e., its “derivation”) connected to input 1 is written above the waveform and that connected to input 2 is written below as in this figure, the deflection always points to the electrode of higher “relative” negativity.
If the difference between the two signals at the input is 0, no deflection will occur. When two electrodes (no matter how close to the source of the sharp wave or spike) that lie along the same isopotential line (typically at the same distance from the generator) are input to a differential amplifier, the output will reflect no activity, even though both electrodes may be measuring high amplitudes in an absolute sense. Some amplifiers used in basic neurophysiology research and in clinical evoked potentials employ another convention, designed to display positive input 1 as an upward deflection.
Derivations and Montages
A derivation describes the connections of the electrodes to the amplifier inputs. A montage is a combination of derivations arranged down the EEG page to display many amplifier channels simultaneously in a way that aids in the identification and localization of abnormalities (79). Each amplifier could be connected to any pair of electrodes available. Likewise, these amplifier outputs could be arranged in any fashion on the screen; the arrangement in chains assists our visual localization capabilities.
The arrangement of derivations into a montage determines whether it is called bipolar or referential. Derivations in bipolar montages are established between neighboring electrodes to emphasize focal activity. They take advantage of the subtractive nature of differential amplifiers to effect a high degree of cancellation. Any montage can be analyzed to locate the maximum of a sharp wave or spike, provided that the montage has a logical order (6,80,81). It is convenient to link the electrodes in a systematic “chain” of bipolar derivations. Because input 1 of each succeeding channel in the montage is the same as input 2 of the preceding channel, the electrodes are all electrically linked in a structured way and—more importantly—algebraically.
Bipolar montages are of maximum advantage when attempting to pick out localized potentials, as they help to cancel out more widespread activity. Bipolar montages are most logically arranged in a longitudinal or transverse direction. In a referential montage, the same electrode is connected to input 2 of every channel, while each channel has a different electrode connected to input 1. In contrast to bipolar montages, referential montages do a better job (as long as the reference is judiciously chosen) of picking up activity that has a more widespread distribution.
ELECTRICAL FIELD DETERMINATION ON THE SCALP
Identification of Peaks; Measurement of the Amplitude
Interictal epileptiform abnormalities are recognized by their morphology—an impression of “standing out” from the background—and by their electrical field distribution, which must demonstrate a realistic relationship between the electrical potentials at topographically associated electrode positions. In choosing an abnormality to localize, the peak selected must be representative of the patient’s population of spikes, and the sample must be as clean as possible.
It is assumed that an activity starts from “zero” and reaches its maximum after a certain time. The amplitude of the activity is measured between the zero and the maximum peak. However, it is often difficult to identify the level of the “zero” in each EEG channel correctly, because the activity is superimposed on the background, arises from the noise level, or continues from the preceding activity. Sometimes sharp activity can be separated from a slower background, if the frequency of the epileptic activity is clearly different, by using filtering.
Practically, the amplitude is measured as peak to peak or baseline to peak. Identification of the baseline and peak may be particularly troublesome in the case of polyphasic discharges, in which each phase is brief and difficult to line up temporally. When analyzing a peak, the maximum value in each EEG channel should be identified at exactly the same time point. During visual analysis of a waveform, the montage selected will influence identification of the peak, resulting in different, or sometimes erroneous, field determinations. Multiple peaks or phase reversals with small time shifts reflect sequential change in the location of the maximum. In the EEG tracings shown in Figure 7.7, note that the peaks of several of the channels were reached on different phases of the waveform, giving the erroneous appearance of a phase reversal. Computerized source localization techniques are especially sensitive to the selection of the appropriate time frame. Errors in identifying the peaks that are to be mapped can cause extraordinary displacements in the apparent localization of the sources (82,83).
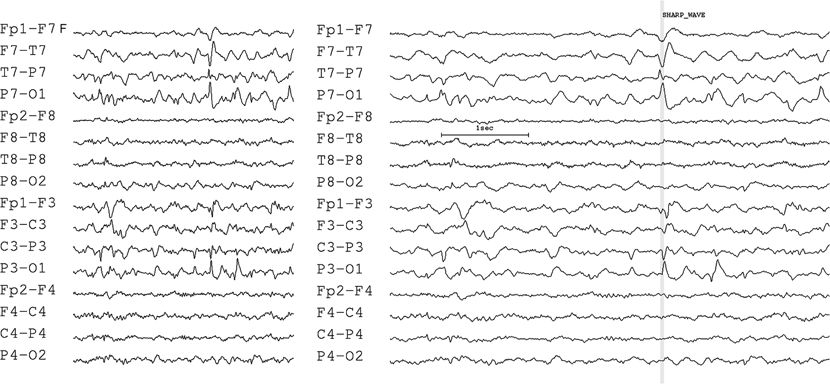
Figure 7.7. Phase reversals—choosing the same component. Be certain to select the proper phase of the discharge. The EEG on the left appears to show a confusing distribution, at first glance, with phase reversals at multiple sites. On the right, the timescale of the same epoch has been doubled. The vertical marker reveals that the discharge actually consists of three phases, with each peak at a slightly different time. The phase reversal at T7–P7 occurs prior to the phase reversal at P3.
The peak of the sharp wave (i.e., the negative extrema) generally has the highest amplitude at the electrode closest to the involved cortical epileptogenic neurons (7). The main component of an epileptic discharge may be preceded by a smaller deflection of the opposite polarity. Early components show a more localized field than later ones (84,85), and they are more synchronous than the slow wave that frequently follows a spike. Thus, the initial deflection probably contains more localizing information (36), and employing the lower- frequency waves for localization may not always represent the epileptogenic region.
Mapping the Electrical Field
The two-dimensional display of the scalp regions involved in epileptiform or other activity is called mapping. Isopotential lines are drawn on a representation of the scalp to specify the topography of equivalent electrical potentials, similar to the isocontour lines drawn by a surveyor on a land map. From the area where the activity is maximum, succeeding regions that are further away will show a lower amplitude and can be divided into convenient isopotential contours. Because EEG amplitude is always measured with respect to a reference, the absolute amplitude will be dependent on the reference. But as shown in Figure 7.8, the shape of the contour distribution does not change with the reference.
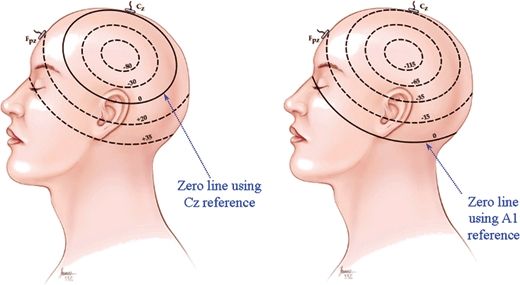
Figure 7.8. Topographical distribution of electrical potentials (in microvolts). EEG amplitudes are always measured relative to another reference. Note that the specific choice of reference electrode does not affect the shape of the isocontours of this left temporal discharge.
The potential fields of spikes and sharp waves can be mapped even without electronic assistance by tracking the relationships of the electrical potential level between electrodes. As the initial step, a longitudinal or transverse chain of the electrodes is used to map the one-dimensional relationship of voltage level to electrode position, as illustrated in Figure 7.9, top. Then, two chains are connected to each other through a common electrode to obtain the two-dimensional relationship. To create an isopotential contour map, a 100% value is assigned to the maximum and a 0% value is assigned to the minimum. However, as discussed later, the polarity of the maximum depends on an assumption about the generator. The “maximum” may be the highest negative point or the highest positive point. Similarly, the “minimum” may be negative or positive or may have a mid-curve value when two maxima of opposite polarity are assumed, for example, a horizontal dipole generator. Depending on the polarity of the maximum, that is, the point given a 100% value, at least two different isocontour maps can be obtained, as shown in Figure 7.10. To make the correct choice, some assumptions must be introduced, as described later.
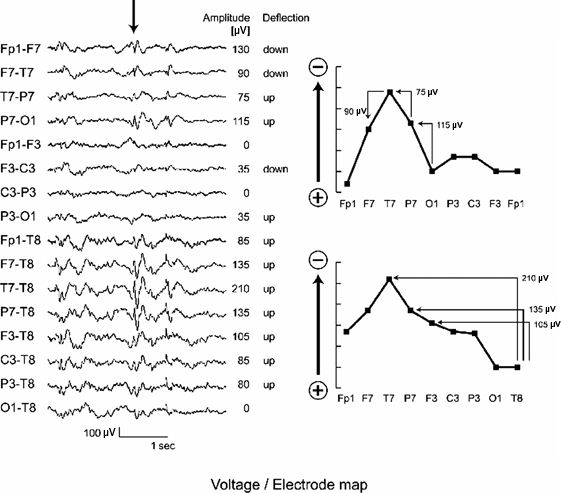
Figure 7.9. Voltage/electrode map. The EEG shows the same activity in two different montages: A bipolar montage in the top eight traces and a referential montage in the bottom eight. Two voltage/electrode maps for the spike indicated by the arrow are reconstructed manually from the two montages, respectively. In the bipolar montage, the difference of the potential level (amplitude) and relative polarity (deflection) between neighboring electrodes is sequentially tracked along the “chain” of the montage. Here, the potential mapping was started from a common electrode O1 with a value of 0 μV assumed. Employing the algebraic relationships between the electrode derivations, the calculated amplitudes at each individual electrode are graphed. The resulting voltage level at Fp1 differed slightly between the two bipolar chains, owing to minor differences in manual measurement of the amplitudes. For the referential montage, the measured amplitudes are written down directly, as no calculations are necessary. If all the deflections are in the same direction and the referential electrode (input 2) is located at the minimum, as seen in this example, then the amplitude of the deflection simply reflects the voltage level of the electrode. No matter which montage is used, the field determination should be same in terms of location of the maximum. The voltage/electrode maps may differ in detail, however, reflecting a varying degree of visibility of the spike between montages.
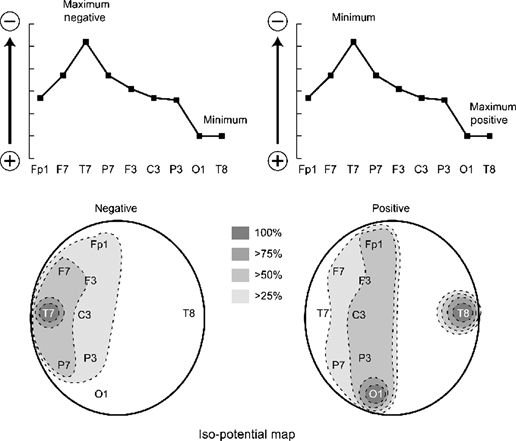
Figure 7.10. Isopotential map. As in Figure 7.9, the vertical axis of the top figures represents electrical potential, and the horizontal axis shows electrode location. A 100% value is assigned to the maximum, and a 0% value is assigned to the minimum. Depending on the polarity of the maximum, at least two different maps can be obtained, illustrated on the bottom row. In the map on the left side, the maximum is assumed to be negative, and the falloff of potential with distance is physiologic. On the right, the opposite assumption was made, that is, the maximum is a positive potential, resulting in a very unphysiologic distribution. Thus, it was deduced that this spike has maximum negativity from the left temporal area.
The ideal situation in referential recording occurs when the reference electrode is totally inactive or picks up activity of negligible amplitude. In this situation, those channels showing some activity will deflect in one direction only, as illustrated in Figure 7.9, bottom. The electrode closest to the generator will show the largest waveform deflection, and the amplitude of the deflection in all the other channels will be directly proportional to the magnitude of the activity recorded from each of those electrodes. This situation makes it especially easy to find the maximum and to assess the extent of the field distribution (see Fig. 7.9). To achieve this ideal situation, a contaminated reference must be recognized and a “distribution montage” constructed instead, typically with a reference electrode from the other hemisphere (Fig. 7.11).
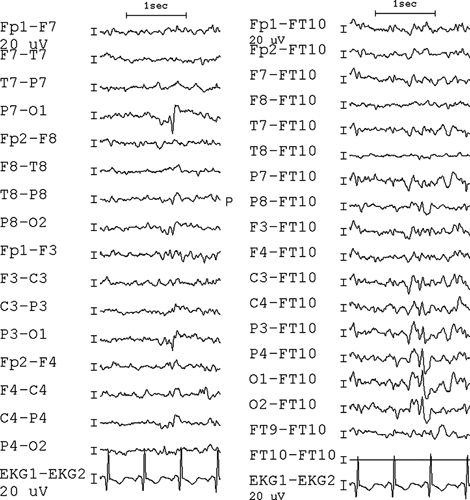
Figure 7.11. On the left, a bipolar montage with no phase reversal suggests that the activity is either at the beginning or at the end of the chain. The same time period is shown on the right, and the distribution montage to an uninvolved contralateral electrode confirms the left posterior maximum of this surface-negative discharge.
In mapping potentials measured from a bipolar recording, the bipolar measurements first must be converted to voltages relative to a selected “reference” electrode. The wisest choice usually is to select the least involved electrode at the beginning or end of the chains, taking advantage of the fact that certain electrodes are common to more than one chain. For instance, in the “double-banana” longitudinal montage, the frontal polar and occipital electrodes occur in both ipsilateral chains. These common electrodes provide an electrical connection between chains and allow an algebraic determination of the potential gradient of the electrical field over the entire area covered by the two chains. Because all the electrodes in both chains are related to each other by a sequence of subtractions, one can determine the relative amplitude at any electrode to the reference electrode. Of course, the exact amplitude (in absolute terms) at any scalp electrode is unknown. However, electrodes relatively distant from the site of maximum activity “see” a negligible potential, hence the assumption that the potential of the particular transient under study at these uninvolved electrodes is zero. The fact that the potential at this uninvolved electrode may not be exactly zero is unimportant because the relative differences between electrodes will be appropriately preserved.
Although it is possible to localize a spike or sharp wave from a single montage if electrical connections between the chains (or appropriate assumptions) exist, recording from multiple montages, especially “crisscrossing” montages, will help to confirm the topography of the discharge and can better define the topographic distribution. When the amplitudes of the potential distribution do not match exactly between chains or montages, the discrepancies most likely arise from errors in visual measurement, erroneous assumptions of zero potential, or difficulty recognizing the same waveform in different montages. Generally, referential montages with uninvolved references will be better able to map the distribution of the activity.
The procedure for mapping the potential field, illustrated in Figures 7.9 and 7.10, can be summarized as follows:
1. Measure the amplitude of the component of interest in each channel.
2. Select an electrode that appears to be uninvolved. Assume a value of 0 for that electrode.
3. Calculate the amplitude of all the electrodes relative to the selected electrode, based on the algebraic relationship established by the montage.
4. Follow this procedure for all the chains connected by common electrodes.
5. Assume another zero electrode to calculate the distribution in chains not connected by a common electrode.
6. If the resulting distribution has potentials both above and below zero, start with another “zero” electrode.
7. Draw isopotential contours around the resulting distribution.
8. If the topographic distribution is unphysiologic, assume the opposite polarity for the waveform.
These principles can be applied most profitably when electrode montages are simple and systematic, as recommended by the American Clinical Neurophysiology Society (79).
Rules for Field Identification
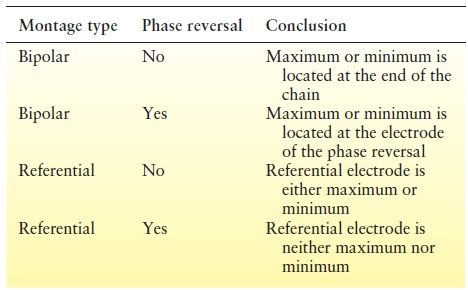
A practical set of rules for identification of the electrical fields seen on the EEG is outlined in Table 7.1. The following sections provide more detailed instructions for the application of these rules.
Table 7.1 Rules for Potential Distribution
Bipolar Montage
Derivations in a bipolar montage are customarily arranged in chains (6,79,80); that is, the electrode connected to input 2 of one channel is also connected to input 1 of the next channel. Electrode chains are usually parallel, along transverse or sagittal axes, and contain no single electrode common to all channels.
When the deflections of two channels move simultaneously in opposite directions, this defines a “phase reversal.” The presence or absence of phase reversals provides useful and immediate clues to localize maxima and minima. Whether the montage is bipolar or referential radically alters the meaning of the phase reversal (Table 7.1). In bipolar montages, there are two types of phase reversals: negative phase reversals (wherein the deflections point toward each other) and positive phase reversals (wherein they point away from each other).
If there is a phase reversal, the electrode where it occurs is either the minimum or the maximum of the electrical field. (The term “maximum” denotes absolute value, not necessarily maximum negativity.) The location of the maximum depends on the assumed polarity of the generator. Phase reversals involving surface-negative activity generate a negative phase reversal, in which the deflections “point” toward each other. However, the same picture theoretically could result from a positive electrical field that is minimum at the site of the phase reversal and larger at the ends of the chain. Conversely, a positive potential maximum at an electrode in the middle of a bipolar chain will cause the deflections to point away from each other, that is, a positive phase reversal.
If there is no phase reversal, then the electrical field maximum must be located under either the first or the last electrode of the chain (Fig. 7.12). The potential field minimum must then be at the opposite end of the chain. Because the potential gradient for each pair of electrodes in the chain is in the same direction, the potential decreases progressively from the electrode with the highest potential to the one with the lowest potential.
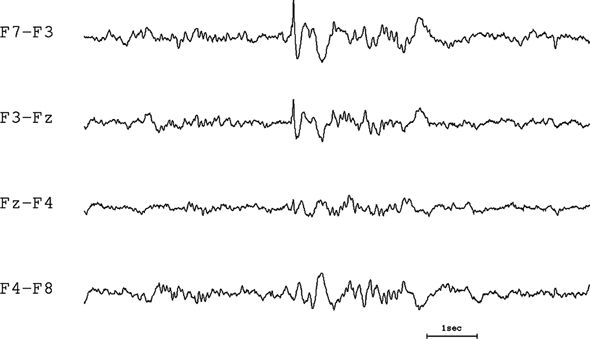
Figure 7.12. Bipolar montage with no phase reversal. Electroencephalographers are used to looking for phase reversals in a bipolar montage. In this tracing, there is no phase reversal; therefore, the discharge must be coming from either the beginning or the end of the chain. If the sharp wave is negative, implying that the activity is at the beginning of the chain (F7), the distribution has a much more realistic falloff (i.e., it has a single peak with a monotonic decline). If the sharp wave is assumed to be positive, then the maximum would have to be at the end of the chain (F8) with an oddly flat distribution on the right and a rapid falloff on the left.
In a bipolar montage, the amplitude may be misleading because it indicates differences in electrical potential and not the electrode of maximal involvement (Fig. 7.13). Because the gradients tend to be steeper in regions of highest activity, the electroencephalographer may habitually but unwisely determine the maximum on the basis of amplitude. Inexperienced electroencephalographers will often (erroneously) localize by a cursory impression of the “maximum field.” It is very important, however, to keep in mind that recordings made between a pair of electrodes (a derivation) are actually measuring the electrical gradient.
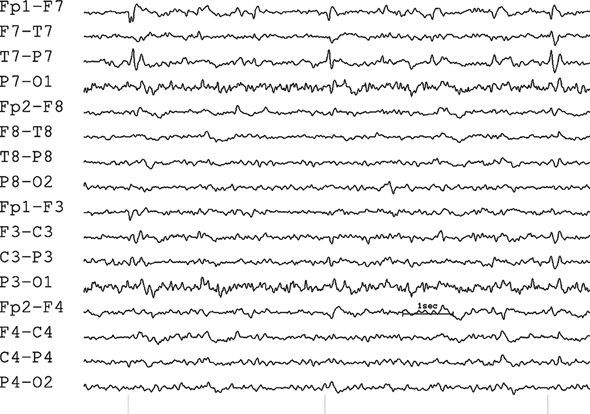
Figure 7.13. Bipolar montage with phase reversal. The amplitudes of the differences between the voltages at input 1 and input 2 do not indicate the maximum of the electrical field. In this circumstance, the amplitude of the sharp wave is actually maximum at F7 and T7, but approximately equal in those two adjacent electrodes, so the discharge is localized to both electrodes.
Referential Montage
All derivations in a referential montage connect the same electrode (or electrode combination) to input 2. If some derivations within a given montage use one reference electrode (e.g., the left ear) whereas others use a different reference (e.g., the right ear), only those sets of channels with a common reference should be analyzed together.
If there is no phase reversal (as shown in Fig. 7.14), the reference electrode (i.e., the one connected to input 2) is either the minimum or the maximum of the electrical field. If the reference electrode is the minimum of the electrical field, the maximum will be at the electrode with the largest amplitude. This situation is the easiest to analyze, because the amplitude of the deflection in each channel directly reflects the level of activity in input 1 of the channel.
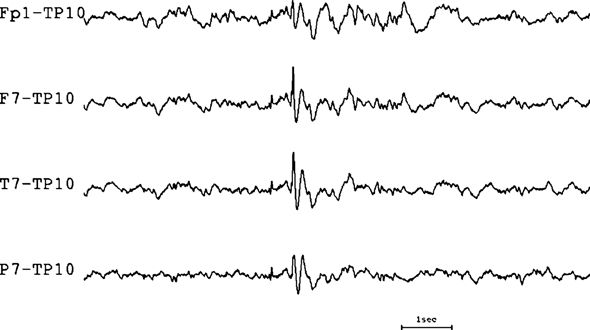
Figure 7.14. Referential montage with no phase reversal. This montage, which employs a contralateral reference chosen because it appeared to be uninvolved in the discharge, helps to clarify the location of a spike widely distributed across the left temporal region.
If the reference is maximum, the electrode at input 1 of the largest amplitude channel is at the minimum of the electrical field. If the reference is maximum and some channels show no deflection, the electrodes connected to input 1 of those channels are also maximum.
If there is a phase reversal, then the reference electrode is neither the minimum nor the maximum of the electrical field (Fig. 7.15). Hence, the reference is “involved,” that is, at some intermediate potential. This indicates that some electrodes connected to input 1 have a greater potential and some a lower potential than the reference. If, for instance, the polarity of the discharge is negative, those electrodes connected to input 1 that have a higher potential than the reference will point upward, whereas those less negative than the reference will point downward. The channels that show no activity (isopotential with the reference) measure a negativity at input 1 equal to that at the reference. If the recorded potential has two maxima of opposite polarity, such as seen in tangential dipole sources, then referential montages will show phase reversals even if the reference is the minimum.
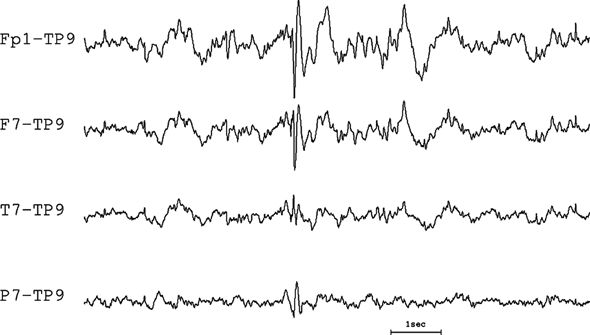
Figure 7.15. Referential montage with phase reversal. Since there is a phase reversal between channels 2 and 3, the reference is neither minimum nor maximum, that is, it must be “involved.” This tracing is actually of the same discharge as shown in Figure 7.14, employing a less wisely chosen reference.
Choice of a Reference
In a referential montage, any electrode may be the reference, but a reference that is one uninvolved in the electrical field will best suit the electroencephalographer’s purpose. The voltage difference between any pair of electrodes is entirely unrelated to the choice of reference (86,87); subtracting the voltage measured referentially at electrode B from that measured referentially at electrode A will produce exactly the voltage measured bipolarly from the A–B derivation, regardless of the reference chosen. This is true for a single electrode or a mathematically calculated one such as the average reference (88–90) and is the principle of computer-aided montage reformatting.
The amplifiers in a reference montage perform their differential function exactly as in a bipolar montage. Referential recordings measure not the absolute potential under the various scalp electrodes but the potential difference, as do bipolar recordings. Specifically, however, they measure the difference between each electrode and a chosen common reference. Instead of chains of electrodes, with each succeeding amplifier sharing one input from the previous amplifier, all the amplifiers share a common input 2. What the amplifier “sees” depends on the electrical relationship between the reference and the field of the waveform. The reference may be completely uninvolved in the field (a minimum), may be in an area that picks up a higher value of the waveform than any of the other electrodes (a maximum), or may lie somewhere in between (neither a maximum nor a minimum).
When mapping the distribution of a particular wave, the choice of reference electrode will affect the appearance of the traces as well as the electroencephalographer’s ability to localize. For evaluating epileptic foci, the reference is normally chosen to be completely uninvolved in the electrical field distribution of the spike or sharp wave (all deflections should point in the same direction). Typically, the electrode most distant from the activity of interest will be the least involved reference. “Standard” referential montages occasionally include the reference in the field distribution (some deflections pointing upward, some downward). An electrode at the vertex (Cz) is an excellent reference for displaying temporal spikes but may be a poor choice during sleep when it is very active. In the linked-ears reference (91) (frequently used to decrease electrocardiographic artifact), the reference electrode (A1 connected to A2) connects the two brain regions. This electrical shunt changes the field generated (92), decreasing, for example, asymmetries between the temporal regions (9) and producing other distortions (93). The “weighting” applied to activity from each side will depend entirely on the electrode impedances, with the ear having the lower impedance predominating. When temporal lobe epileptiform activity spreads to the ipsilateral ear, the linked-ear reference will inappropriately reveal spikes in both hemispheres.
A common average reference has been advocated (89) to avoid the problem of an “active reference.” Using passive summing networks, active amplifier configurations, or combinatorial software, it is possible to devise a reference that combines all the electrodes applied to the head, the so-called common average reference (88,89). The disadvantages of this system are threefold: (i) The common average reference is, by definition, contaminated because the abnormal potential will influence all of the channels (94); (ii) depending on the number of electrodes included in the average, the potential under study will be reduced by a small proportion; and (iii) large-amplitude focal pathologic activities will be reflected proportionally in all the inactive channels as well, albeit with apparently opposite polarity.
A variety of calculated references and transformations are available, but these must be used with caution. The “source derivation” provides useful “deblurring” by arithmetically estimating the cortical sources that generate a scalp distribution; however, this method gives increasing weight to distant electrodes and can produce erroneous results when these sites are active (36,38,95,96). Because there is no ideal reference for all cases, it is usually best to distribute the electrical field potentials by manual selection of an uninvolved and quiet electrode as a reference.
SOURCE LOCALIZATION
Assumptions
After determination of the electrical field, the sources responsible for the production of the field can be localized with the aid of a number of simplifications. The procedure for determining the polarity and location of the generator is based on the following four specific assumptions:
1. Epileptogenic sources are simple dipoles or sheets of dipoles obeying a simple principle of superposition (48).
2. Dipoles are fundamentally oriented perpendicularly, with only one pole generally detectable on the scalp (78) and therefore can be treated as if they were monopoles. When both the positive and the negative poles are recorded from the surface, the localization system outlined below will not apply.
3. Epileptiform discharges are chiefly surface-negative phenomena. In the absence of a skull defect, a transverse- lying dipole (as in benign focal epileptiform discharges of childhood), or other evidence of an unusual discharge, the assumption of surface negativity will usually result in the proper distribution.
4. The head is essentially a uniform, homogeneous volume conductor.
Choosing Between Two Possibilities
The application of the rules above will yield two possible hypotheses in each case. In a bipolar chain, for example, a downward deflection with no phase reversals may be generated by either a negativity maximum at the last electrode of the chain (Fig. 7.16) or a positivity maximum at the first electrode of the chain. To choose between the two possibilities in any given case, one must guess about the polarity of the source generator or the relative likelihood of one of the two electrodes being the more active.
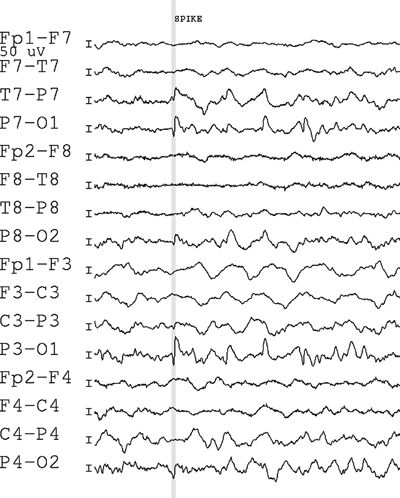
Figure 7.16. Bipolar montage with maximum negativity at the end of the chain. The marker brackets the downgoing negative component.
Stay updated, free articles. Join our Telegram channel

Full access? Get Clinical Tree


