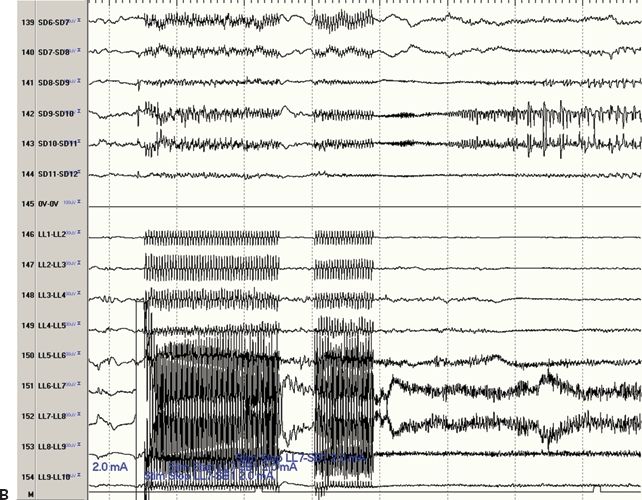
Figure 80.1. Figure A is an MRI coregistration of four subdural arrays (plates) and three depth electrodes. The subdural arrays include a high-density 10 × 12-electrode array (labeled “A” plate) and three 2 × 6-electrode subdural arrays (labeled “B” plate covering the left dorsolateral frontal cortex, “C” plate covering the mesial left frontal cortex, and “D” plate covering the mesial parietal cortex). The three depth electrodes each have eight electrode contacts and are placed in the caudal portion of the superior frontal gyrus (LA depth), in the precentral sulcus (LL depth), and close to the central sulcus (LP depth). Figure B shows the electrocorticography during electrical stimulation of the LL depth electrode. The channels are displayed in a bipolar recording of the “D” plate and LL depth. Stimulation of depth electrode LL6 referenced to subdural electrode B1 elicited an afterdischarge noted most prominently at subdural electrode D10 greater than at subdural electrodes D7, D8, D9, and D11.
Although patients are often weaned from their anticonvulsants during their stay in the epilepsy monitoring unit in order to better assure that seizures are captured, they are often restarted on anticonvulsants prior to the beginning of stimulation testing, typically by acutely loading them the day before. Reinstitution of anticonvulsant medication acutely without titration, however, may complicate cortical stimulation testing, as patients may become fatigued or toxic, making interpretation of clinical symptoms related to cortical stimulation more difficult. Stimulation mapping may be less reliable in the setting of general anesthesia. Some functions, such as language, can only be tested in the awake state. Mapping language in cooperative patients can be performed either during an awake craniotomy or in the invasive EEG–video monitoring unit (2).
Stimulation and Testing Procedure
Cortical stimulation is carried out in a systematic fashion in order to adequately map the accessible functions. Completion can sometimes take several days. The stimulation parameters used at the Cleveland Clinic are as follows: 25 Hz, biphasic, constant current stimuli, of duration 0.3 ms, with intensity ranging from 1 to 15 mA. The stimulus is applied to an “active” electrode, while a distant “reference electrode” in a noneloquent region serves as a nonactive current sink. The active electrode is varied electrode by electrode throughout the entire grid, thereby testing the function of the cortical region underlying each electrode in turn. When the stimulus is applied to two adjacent electrodes, the typical close bipolar configuration, ascertaining which of the two electrodes elicited the given functional effect can be difficult. Therefore, many neurophysiologists initially stimulate all involved electrodes covering adjacent electrodes of the area of interest and subsequently confirming electrodes with suspected function during stimulation against a “silent,” usually more distant, electrode. The stimulus intensity is increased in steps of 1 to 2 mA while carefully watching for functional changes as well as for the occurrence of afterdischarges.
When stimulation testing has been completed, a map outlining the various eloquent functions can be compared with the maps of ictal and interictal activity to help guide surgery resection margins. In the ideal situation, areas found to be responsible for eloquent functions are separated from the epileptogenic zone.
In general, surgical resection of eloquent cortical areas identified by cortical stimulation will lead to neurologic deficits. There are exceptions, however, and surgical removal of some “eloquent” cortical areas (such as primary motor face area) leads only to temporary neurologic deficits, with complete or almost complete neurologic recovery.
Neurophysiologic Effects of Cortical Stimulation
There are three general types of neuronal structures that can be affected by electrical stimulation: local neurons, afferent inputs, and fibers of passage. The current density, membrane depolarization, or hyperpolarization can affect the voltage distribution seen in the tissue medium generated by stimulation (6). The stimulation-induced membrane polarization in turn affects voltage-gated ion channels to induce action potentials, which in turn results in the clinically observed behavioral response (2). However, a neuron can either be activated or suppressed in response to extracellular stimulation depending on its position in relation to the electrode and the stimulation parameters being used. The sum of the effect from stimulation to neuronal output is made up of the direct effect on local neurons and the indirect effect of induced transsynaptic excitation and/or inhibition (2). Electrical stimulation of the human cortex is one experimental model that could reproduce the effect of activation of the cortex by an epileptiform discharge (7). Depolarization and hyperpolarization of cell membranes produces action potentials, which results as positive or negative clinical effect. Positive or negative clinical effects are dependent on stimulus intensity and stimulated area (8–10).
Mapping Primary Motor and Primary Sensory Areas
Direct cortical stimulation of the premotor and motor areas has been widely used to localize human motor function. The main objective is to identify the primary motor cortex so that surgical damage can hopefully be avoided in cases where the anatomical landmarks may have been distorted due to the presence of a lesion or in nonlesional cases where the resection needs to be maximized (11). Penfield’s and Jasper’s description of the somatotopic distribution of human motor function in the primary motor cortex has stood the test of time with only a few variables patterns observed in individual patients (4). Using gradual increments in the square wave biphasic stimuli, the patient is observed for motor responses involving contralateral muscle contraction. For the most part, the central sulcus is a reliable demarcation separating motor and somatosensory cortex, and there is a consistent relationship among tongue, face, thumb, and finger in the dorsoventral axis (Fig. 80.2). Somatosensory function can be elicited from the human brain by electrical stimulation, from three areas—the primary sensory cortex (SI) in the postcentral gyrus, the SII in the frontal and parietal operculum, and the supplementary sensorimotor area in the mesial surface of the frontal and parietal cortex. The SI can be defined as the postcentral or anterior parietal region. The clear somatotopy of SI corresponds to that of the motor strip with the exception of the representation of the genitals that is found only in the postcentral cortex (12).
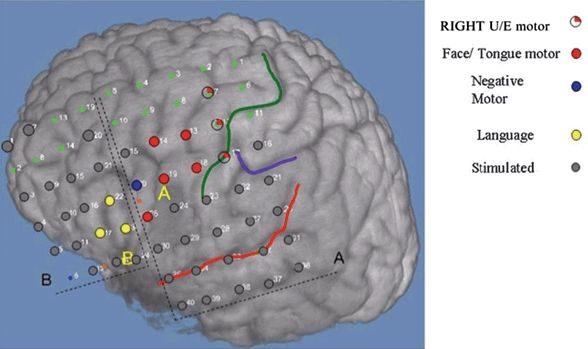
Figure 80.2. An 18-year-old girl with severe pharmacoresistant epilepsy and encephalomalacia in the left inferior frontal gyrus posterior to pars triangularis and pars opercularis. Grid A (5×8). Grid B (4×6). Positive motor function (red), negative motor function (blue), motor speech (yellow), electrodes stimulated without clinical manifestations (gray), central sulcus (green line), sylvian fissure (red line). (U/E, upper extremities).
Special Considerations in Children
Cortical mapping in children poses additional unique challenges. The changes inherent to a developing nervous system and absence of firm guidelines for electrical safety necessitate that the energy and charge requirements be kept to a minimum. In addition, the cooperation from pediatric patients is commensurate with the age and level of development and as such may be limited. This makes it challenging to obtain a reproducible objective study of cortical stimulation in selected patients with mental handicaps and in the very young (13).
The stimulation paradigm in infants and young children could be different from used in adults. The longer chronaxies characteristic of immature cortex and poorly myelinated nervous system require increments of both stimulus intensity and pulse duration in order to approach the chronaxie while minimizing the energy required eliciting a response. Stimulation is begun at a low intensity (1.0 mA) and gradually increased in increments of 0.5 to 1.0 mA, keeping an eye on afterdischarges and/or clinical response. Pulse durations are increased from a starting level of 0.3 ms up to a maximum of 1.0 ms. Jayakar et al. (14) were also able to demonstrate that most clinical responses in children were obtained at or above the afterdischarge threshold. This was felt to be a result of maturational factors giving rise to variations in the coupling of functional responses to afterdischarges. Faced with an absence of clinical response in the presence of afterdischarge therefore does not exclude the presence of eloquent cortex under that electrode. Motor tasks administered must be tailored to the patient’s age and neurocognitive status.
Response Characteristics
Motor responses can be obtained at all age groups with some ontogenic trends. In children younger than 2 years of age, tongue movements are difficult to elicit, and they may demonstrate bilateral rather than unilateral responses from the lower face when the lower rolandic region is stimulated. Individual finger movements are usually first manifest at or after 3 years of age. Clonic finger movements appear after tonic finger movements. These observations are likely to be a result of the maturing systems in Brodmann area 4.
Cortical Somatosensory Evoked Potentials
The mapping of the evoked cortical response to peripheral nerve stimulation can give clues to the localization of central sulcus as well as somatotopic organization of the sensorimotor cortex of hand, face, and leg regions. The responses are cortically generated contralateral to the side of peripheral nerve stimulation over the primary somatosensory cortex. In this regard, the responses from cortical evoked potential mapping can be used to cross-check the functional mapping of other modalities such as cortical stimulation. This may be particularly important in children in whom it may be difficult to reliably interpret responses from cortical stimulation (15), or in patients with malformations around the sensorimotor cortex (16).
The standard methodology for somatosensory evoked potentials applies when performing cortical somatosensory evoked potentials (SEP) mapping. An electrical transcutaneous monophasic stimulation (current durations of 100 to 300 μsec) is applied over a peripheral nerve. Median nerve at the wrist, posterior tibial nerve at the ankle, and mandibular branch of the trigeminal nerve are common sites of stimulation for cortical SEP mapping of the hand, foot, and face regions, respectively. Due to the stimulation artifact encountered while performing trigeminal nerve stimulation, the polarity of the stimulation is alternated in order to diminish the stimulus artifact. The intensity of the stimulation is set either at motor threshold or slightly above motor threshold. Stimulus rates of 1 to 10 per second are commonly used, and averaging of 500 sweeps usually results in good signal-to-noise recordings from scalp somatosensory evoked potentials (17). Cortical SEPs usually can be recorded with less number of sweeps as the signal-to-noise ratio is five to eight times higher than with scalp recordings. Band pass should be set from 3 Hz to 2000 Hz.
Cortical SEP mapping is obtained using subdural electrodes placed over the mesial and lateral convexity of the frontoparietal cortex. These responses can be recorded acutely during surgery or in the extraoperative setting. Cortical SEP responses to median nerve stimulation show initial peak latencies around 20 ms in adults. Responses consist of an initial negativity in the hand postcentral gyrus area (called N1 or N20) and a smaller positive polarity in the precentral region (called P1 or P20) (18,19). These two opposite polarity potentials make a phase reversal between the post- and precentral gyrus across the central sulcus in a referential derivation (Fig. 80.3.) (20). Following these initial N1/P1 responses, a second prominent positive peak (P2 or P25) response can be seen that appears over the postcentral gyrus. These occurrences of these waveforms can be explained by a two-dipole model over the postcentral gyrus (18,19). The generator of the initial N1/N20 response is thought to be in the posterior wall of the central sulcus (Brodmann area 3b). The horizontal dipole in area 3b thus produces a widely distributed polarity inversion across the central sulcus. The source of the P2 or P25 response is thought to be due to a radially oriented generator at the crown of the postcentral gyrus (Brodmann areas 1 and 2), which is more narrowly distributed with no polarity inversion.
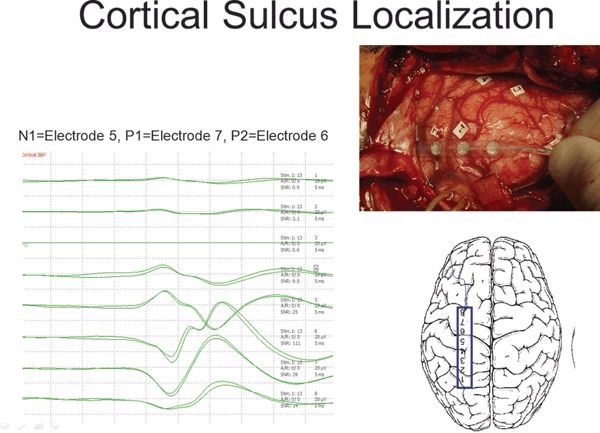
Figure 80.3. Cortical somatosensory evoked potentials (SEP) mapping performed intraoperatively on a 1×8 subdural strip placed over the left frontoparietal lateral convexity. The recordings are referenced to a needle electrode placed in the surgical scalp incision. The N1 or N20 response is seen maximally at electrode 5, the P1 or P20 response is seen at electrode 7, and the P2 or P25 response is seen at electrode 6.
Related posts:
 Epidemiologic Aspects of Epilepsy
Application of Electroencephalography in the Intensive Care Setting
Hormones, Catamenial Epilepsy, Sexual Function, and Reproductive and Bone Health in Epilepsy
Other Nonepileptic Paroxysmal Disorders
Driving and Social Issues in Epilepsy
Dietary Therapies for Epilepsy
Epidemiologic Aspects of Epilepsy
Application of Electroencephalography in the Intensive Care Setting
Hormones, Catamenial Epilepsy, Sexual Function, and Reproductive and Bone Health in Epilepsy
Other Nonepileptic Paroxysmal Disorders
Driving and Social Issues in Epilepsy
Dietary Therapies for Epilepsy
Stay updated, free articles. Join our Telegram channel

Full access? Get Clinical Tree


