Figure 73.1. Broca and Wernicke area: A, B: Major landmarks on sagittal images to identify Broca and Wernicke area. C–E: Left perisylvian encephalomalacia due to perinatally acquired ischemic injury displayed in sagittal, axial, and coronal planes. The lesion involves the region of potential Broca and Wernicke areas (fMRI in this subject confirmed language representation in the right hemisphere, likely a result of plasticity due to early brain injury). (1, sylvian fissure; 2, “V”-shaped anterior rami of sylvian fissure; 3, posterior ramus of sylvian fissure; 4, precentral sulcus—inferior part; 5, central sulcus; 6, inferior frontal sulcus; 7, precentral gyrus—inferior part; 8, superior temporal gyrus; 9, superior temporal sulcus; 10, middle temporal gyrus; 11, pars opercularis; 12, pars triangularis; 13, pars orbitalis; 14, usual location of Wernicke area over the dominant hemisphere; 15, superior frontal gyrus; 16, middle frontal gyrus; 17, inferior frontal gyrus; 18, superior frontal sulcus.)
Wernicke area is located in relation to the posterior end of sylvian fissure, which terminates in the temporoparietal region as the ascending posterior rami. Wernicke area lies in the posterior part of the superior temporal gyrus (4.5 cm posterior to the tip of the temporal pole) extending around the banks of the posterior terminal ascending ramus of the sylvian fissure or around the superior temporal sulcus in the language-dominant hemisphere (Fig. 73.1B). In a minority, the middle or inferior temporal gyrus harbors Wernicke area. Rarely, Wernicke area may lie within the anterior part of the superior temporal gyrus (6–8). On coronal sections, tracing the sylvian fissure and superior temporal sulcus posteriorly may assist in the identification of Wernicke area. Atypical locations of language area tend to occur when congenital or early-acquired brain lesions are located in the vicinity of the presumptive language areas (Fig. 73.1C–E). These lesions may result in shift of the language areas to the perilesional regions or, in extreme cases, to the contralateral homologous region of the brain. This can be confirmed by a Wada test or fMRI studies.
Primary Motor Area: The Precentral Gyrus
Surgery for epileptogenic lesions around the central sulcus poses special challenges due to the risk of motor deficits. A thorough knowledge of the anatomy of the central sulcus and precentral gyrus—the primary motor area—is crucial to localize the lesions around this region. The central sulcus and the precentral gyrus are best identified on the axial and sagittal images (Figs. 73.2 and 73.3). The precentral gyrus is outlined anteriorly by the precentral sulcus and posteriorly by the central sulcus.
On axial MR images (Fig. 73.2A and B), five features help to localize the central sulcus and precentral gyrus (9–11):
1. The central sulcus begins near the interhemispheric fissure and descends in a slight forward angle toward the sylvian fissure. The central sulcus is longer than other adjacent sulci and is least intersected by other sulci. The precentral sulcus is frequently discontinuous and intersected by superior and inferior frontal sulci on its course toward the sylvian fissure.
2. The sagittally oriented superior frontal sulcus at its posterior end meets the coronally oriented precentral sulcus; the adjacent gyrus posterior to the precentral sulcus is the precentral gyrus.
3. The right and left marginal sulci (the ascending terminal portion of the cingulate sulcus on the medial surface of hemisphere) on either side of the interhemispheric fissure produce an easily recognizable mustache-like image (Fig. 73.2A). The central sulcus is usually the first sulcus anterior to this marginal sulcus in most individuals.
4. The precentral gyrus is often 1.5- to 2-fold bigger (sagittal thickness) than the adjacent postcentral gyrus.
5. The hand motor area on the precentral gyrus has an easily recognizable morphologic pattern in most individuals and can further aid in identification of the precentral gyrus. The most common morphologic pattern described on axial image is the “inverted omega” or “knob”- or “knuckle”- like appearance, with its rounded knob abutting the central sulcus. Other morphologic patterns such as “horizontal epsilon” and “asymmetric horizontal epsilons” have been recognized (10,11).
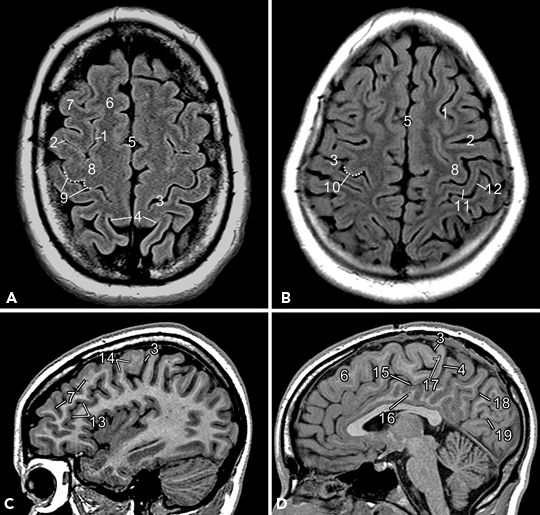
Figure 73.2. Primary motor area: Major landmarks on axial (A and B) and sagittal images (C and D) to identify the central sulcus and primary motor area (precentral gyrus). (1, superior frontal sulcus; 2, precentral sulcus; 3, central sulcus; 4, marginal sulcus (note mustache-like appearance); 5, interhemispheric fissure; 6, superior frontal gyrus; 7, middle frontal gyrus (note “zigzag appearance” in sagittal image); 8, precentral gyrus; 9, “horizontal epsilon”–shaped hand motor area; 10, “knob”-shaped hand motor area in a different subject; 11, postcentral gyrus; 12, postcentral sulcus; 13, inferior frontal sulcus; 14, posteriorly directed “hook”-shaped hand motor area on sagittal plane; 15, cingulate sulcus; 16, cingulate gyrus; 17, paracentral lobule; 18, parietooccipital sulcus; 19, calcarine fissure.)
On sagittal MR images, the central sulcus and precentral gyrus can be identified at three different levels—the far lateral surface, along the hand motor region, and over the medial surface (Figs. 73.1A and 73.2C and D).
1. As described in the earlier section of Broca area, in far lateral sagittal images, at the anterior end of sylvian fissure, the anterior ascending rami of sylvian fissure can be identified (Fig. 73.1A). The sulcus posterior and parallel to the anterior ascending rami denotes the inferior precentral sulcus, which descends inferiorly and often meets the sylvian fissure. The central sulcus lies posterior and parallel to the precentral sulcus, and it usually does not unite with the sylvian fissure unlike the precentral sulcus. Thus, the opercular (lower) part ends of the precentral gyrus and postcentral gyrus (primary sensory cortex) together form the subcentral gyrus (4,5).
2. Further medially, in the mid parasagittal sections (Fig. 73.2C), the hand motor area may be recognized as a posteriorly directed “hook”-shaped appearance (the sagittal view of the “knob” described on axial plane) and usually better visualized if thin sagittal sections are obtained.
3. Further medially (Fig. 73.2D), in the medial surface of the cerebral hemisphere, identification of the cingulate sulcus and its ascending segment—the marginal sulcus—assist in delineation of the central sulcus. The central sulcus makes a small dip in the medial surface and is often the first sulcus anterior to marginal sulcus. The region on either side of the central sulcus on the medial side forms the paracentral lobule, which carries motor and sensory representation for contralateral lower extremity.
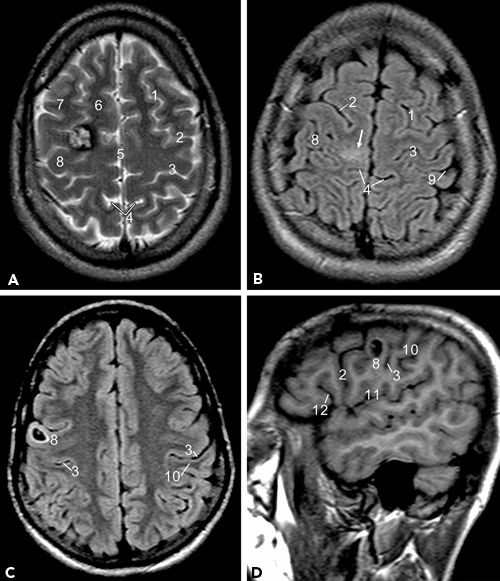
Figure 73.3. Lesions around the region of the central sulcus and precentral gyrus. A: T2-weighted image shows a cavernoma at the junction of the right superior frontal gyrus and precentral gyrus. B: FLAIR image shows an area of hyperintensity over the paramedian precentral and postcentral gyrus. C, D: A cystic lesion in the precentral gyrus over the lateral convexity displayed in axial and sagittal planes. (1, Superior frontal sulcus; 2, precentral sulcus; 3, central sulcus; 4, marginal sulcus; 5, interhemispheric fissure; 6, superior frontal gyrus; 7, middle frontal gyrus; 8, precentral gyrus; 9, postcentral sulcus; 10, postcentral gyrus; 11, sylvian fissure; 12, anterior rami of sylvian fissure.)
On coronal MR images, precise identification of the central sulcus and precentral gyrus is difficult using the coronal slices alone. On volume acquisition images, the inferior precentral gyrus may be identified by tracing the inferior frontal sulcus posteriorly.
Visual Area: The Calcarine Cortex
Calcarine cortex, the primary visual area, is located in the inferior and superior lips of the calcarine fissure in the occipital lobes. Calcarine fissure can be readily identified on the sagittal and coronal images (Figs. 73.4 and 73.5) (12). On sagittal images close to midline (Fig. 73.4A), in the medial surface of the occipital lobe, calcarine fissure extends from a point below the splenium of corpus callosum to the occipital pole. The parietooccipital sulcus extends from the anterior part of calcarine fissure and extends upward in an oblique direction toward the dorsal surface of the brain. Between the parietooccipital sulcus and the calcarine fissure lie the cuneus—a wedge-shaped region in the medial occipital lobe. Precuneus lies anterior to this, between the parietooccipital sulcus and the marginal sulcus. On axial images, the parietooccipital sulcus is more readily visualized on multiple slices because of the oblique orientation of the parietooccipital sulcus (Fig. 73.4B).
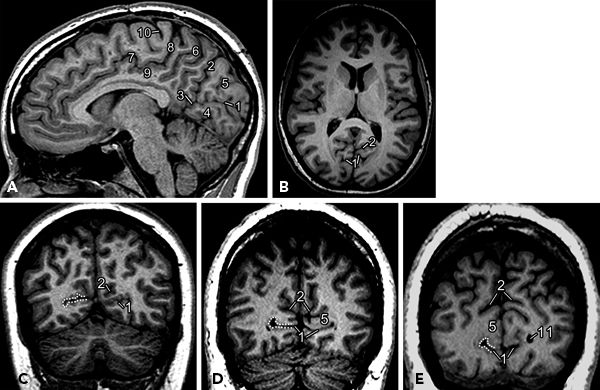
Figure 73.4. Visual cortex: Major landmarks on sagittal (A), axial (B), and coronal (C–E) planes to display calcarine fissure and parietooccipital sulcus. (1, calcarine fissure; 2, parietooccipital sulcus; 3, anterior calcarine sulcus; 4, lingual gyrus; 5, cuneus; 6, precuneus; 7, cingulate sulcus; 8, marginal sulcus; 9, cingulate gyrus; 10, central sulcus; 11, occipital horn of lateral ventricle.) Dotted lines on coronal images indicate region of visual cortex on the right side.
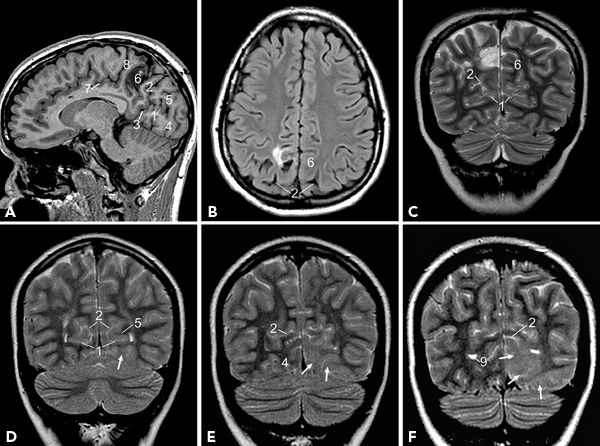
Figure 73.5. Lesions around the calcarine fissure and parietooccipital sulcus. A–C: Residual tumor with postoperative changes noted in the right precuneus region displayed in sagittal, axial, and coronal planes. Note that the lesion is anterior to the parietooccipital sulcus and posterior to the marginal sulcus. D–F: T2-weighted image shows hyperintensity (arrows) of the cortex and subcortical white matter in the left occipital lobe; lesion is inferior to calcarine fissure in anterior images (D) but involves calcarine fissure, cuneus, and lateral occipital gyrus in posterior sections (F). (1, calcarine fissure; 2, parietooccipital sulcus; 3, anterior calcarine sulcus; 4, lingual gyrus; 5, cuneus; 6, precuneus; 7, cingulate sulcus; 8, marginal sulcus; 9, occipital horn of lateral ventricle.)
On coronal MR images, both calcarine fissure and the parietooccipital sulcus are readily identified as the two major fissures in medial occipital lobes that diverge as they course posteriorly (Fig. 73.4C–E). Calcarine fissure becomes shallow as it courses posteriorly and does not quite extend to the occipital pole. The parietooccipital sulcus is generally deeper and reaches dorsal surface and can normally be somewhat asymmetric in depth and configuration (12).
Temporal Lobe
Broadly, temporal lobe epilepsy is categorized as mesial temporal epilepsy and lateral temporal epilepsy syndromes based on presumed anatomic origin of epileptogenicity. Temporal lobe on its outer surface is limited superiorly from the frontal lobe by sylvian fissure. The posterior limits of temporal lobe are poorly defined by an imaginary line from the preoccipital notch of the basal aspect of temporal lobe to the superior aspect of the parietooccipital sulcus. Lateral temporal region consists of three major gyri, namely, the superior, middle, and inferior temporal gyri divided by the superior and inferior temporal sulci. There are two gyri on the basal aspect—the laterally located fusiform or occipitotemporal gyrus and the medially located parahippocampal gyrus (PHG). The fusiform gyrus is limited laterally from the inferior temporal gyrus by the lateral occipitotemporal sulcus and separated medially from the PHG by the collateral sulcus. Temporal structures medial to the collateral sulcus are referred to as mesial temporal structures (13–17).
Mesial temporal structures are best visualized on volumetric high-resolution coronal MR images (Fig. 73.6). Hippocampal formation, amygdala, and PHG are usually considered together as part of the mesial temporal epilepsy network. The term hippocampal formation is often used to denote the hippocampus proper along with the dentate gyrus. Hippocampus derives its name from its morphologic resemblance to a “sea horse,” best appreciated on sagittal images (Fig. 73.6A). It has three parts, namely, head, body, and tail of hippocampus, from anterior to posterior. The head and body of hippocampus extend posteriorly along the inferomedial border of temporal horns of lateral ventricles (Fig. 73.6A and B). Head of hippocampus is the most voluminous part and occupies the anterior end of hippocampus (Fig. 73.6D). Head of the hippocampus is further recognized by its typical undulating superior margin produced by the digitations on the ventricular surface of the structure, better visualized on coronal T2-weighted or inversion recovery images. Many landmarks have been used to identify body and tail of hippocampus, but the most useful would be internal landmarks such as fimbriae and crus fornix—the output tracts of hippocampus. On the coronal MR images, posterior to the head of hippocampus, the appearance of fimbriae signals the junction of head and body of hippocampus (Fig. 73.6E). Further posteriorly, the clear appearance of crus fornix signals the beginning of the tail of hippocampus (Fig. 73.6F). The tail of the hippocampus and fornix course superiorly and medially along the medial margins of atria of lateral ventricles. The dentate gyrus is often indistinguishable from the hippocampus proper and forms a single unit on MR images. The dentate gyrus runs parallel to the hippocampus with its cuplike superior surface covering the CA4 region, forming the hilus of hippocampus. The dentate gyrus continues anteriorly as the band of Giacomini, also referred as tail of dentate gyrus, and posteriorly curves around the callosum as indusium griseum. The amygdala, located on the roof of the temporal horn of the lateral ventricle, is anterior and superior to the head of hippocampus (Fig. 73.6C). The amygdala fuses with the globus pallidus superiorly (13–18).
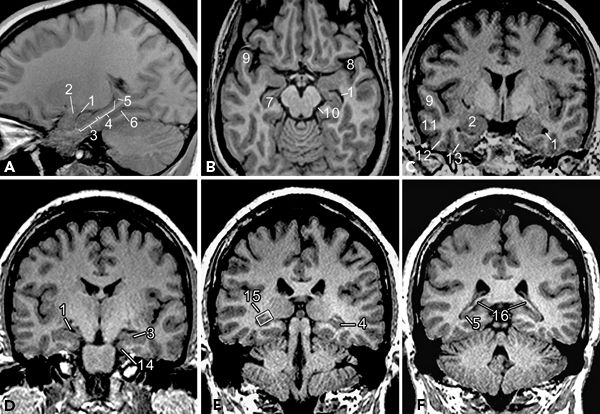
Figure 73.6. Temporal lobe structures displayed in sagittal (A), axial (B), and coronal (C–F) planes. (1, temporal horn of lateral ventricle; 2, amygdala; 3, head of hippocampus; 4, body of hippocampus; 5, tail of hippocampus; 6, collateral sulcus; 7, hippocampus; 8, sylvian fissure; 9, superior temporal gyrus; 10, ambient cistern; 11, middle temporal gyrus; 12, inferior temporal gyrus; 13, occipitotemporal (fusiform) gyrus; 14, parahippocampal gyrus; 15, fimbriae—hyperintense structure within the box; 16, crus of fornix.)
The PHG is located inferolateral to the hippocampal formation and extends posteriorly along the margin of the tentorium cerebelli in contact with the ambient cistern medially. The hippocampal sulcus separates the PHG from hippocampal formation superiorly, and collateral sulcus separates it from the fusiform gyrus laterally on the basal aspect (Fig. 73.6C and D). Anterior end of the PHG is hooked backward and medially, to form the uncus. The PHG has two components, namely, the subiculum and the entorhinal area. Subiculum, the superomedial part of PHG, is continuous with the CA1 of hippocampus and forms the bed of hippocampal formation. Entorhinal area is a poorly demarcated area located in the uncus and the anterior extension of PHG. In the posterior part, the anterior end of calcarine fissure divides the PHG into a superior and an inferior part. The superior part called isthmus curves up and continues with the cingulate gyrus, and the inferior part continues posteriorly with the lingual gyrus of occipital lobe (13–16).
MRI: TECHNICAL CONSIDERATIONS
Most centers use a 1.5 T MRI for routine imaging to evaluate for medically refractory partial epilepsy. 3 T MRI scanners are now widely available and increasingly used for epilepsy protocol imaging. 3 T MRI is likely to replace the 1.5 T MRI for imaging of potential epilepsy surgical candidates. Most MRI studies for evaluation of epilepsy incorporate a sagittal T1-weighted spin-echo acquisition as a scout image to position the slices of the subsequent pulse sequences. The other sequences and the imaging planes are tailored according to the referral information about presumptive epileptogenic zone. Broadly, two kinds of protocols are used in epilepsy imaging—temporal lobe protocol and extratemporal protocol. Different centers use different sets of sequences in these protocols. In general, high soft tissue contrast, thin sections, and imaging in all three planes are critical to epilepsy protocols. A cost- and time-effective protocol, frequently employed at Cleveland Clinic, is shown in Table 73.1.
Table 73.1 Epilepsy Protocol MRI Commonly Used at Cleveland Clinic
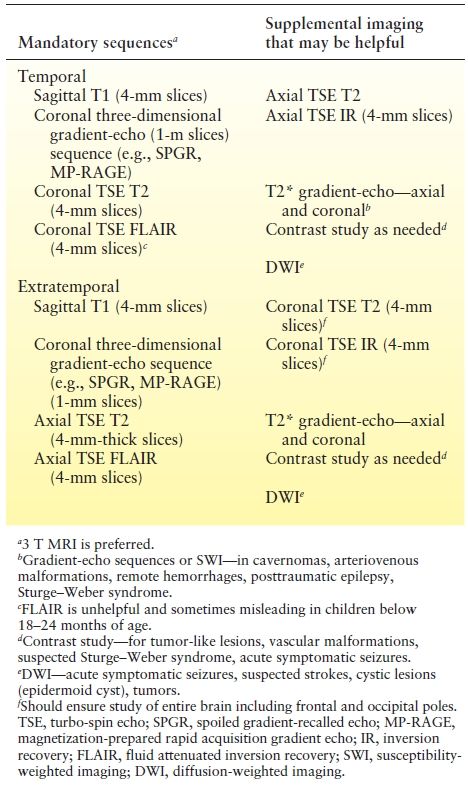
In general, T1-weighted (short repetition time [TR], short echo time [TE]) images serve largely to define the anatomy, and T2-weighted (long TR and long TE) images are well suited for detecting most brain pathology. Fast spin-echo (FSE) or hybrid rapid acquisition relaxation enhancement sequences have replaced the earlier double-echo T2-weighted imaging because of inherent advantages in signal-to-noise ratio, acquisition time, and reduction in motion artifacts (19,20). The heavily T2-weighted images provide strong contrast between CSF and brain parenchyma and tissues with long T2 relaxation times. On the other hand, strong contrast produced by very long TRs and long echo trains can be detrimental and may obscure some parenchymal lesions and gray–white junction (19). The series of 180-degree pulses used in FSE T2 images reduces artifacts in plane with CSF motion as well as susceptibility artifacts at bone–CSF interfaces or adjacent to metallic foreign bodies. However, the same effect makes the visualization of some blood products less evident than on conventional spin-echo imaging. The absence of 180-degree rephasing pulse in the gradient-echo sequences accentuates the local susceptibility artifact related to blood by-products and compensates for this shortcoming of FSE sequences. Consequently, a gradient-echo sequence should be used in any patients in whom vascular malformations or prior trauma is the apparent etiology (Fig. 73.7).
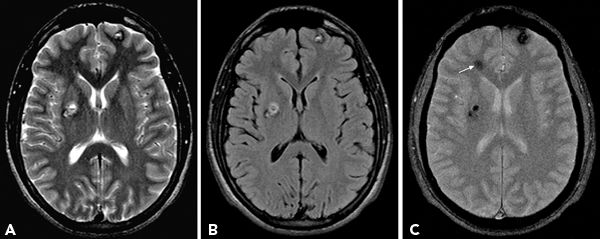
Figure 73.7. Axial T2-weighted (A), FLAIR (B), and gradient-echo images (C) show multiple cavernomas. Gradient-echo sequence reveals additional lesion in right frontal region (arrow) that is inconspicuous on T2 and FLAIR images.
FLAIR images improve the detection of lesions by suppressing the CSF signal and accentuating the signal of lesions with relatively short T1 and long T2 relaxation times (21). Fast FLAIR incorporates a preparatory 180-degree pulse and inversion time before the long TR/long TE FSE sequence to nullify the signal intensity of CSF. Hence, it has a specific advantage over T2 for lesions in the brain–CSF interface, namely, periventricular and subpial cortex location, as the CSF signal appears dark. In MTS, the hyperintense signals in the hippocampus may be obscured by the hyperintense CSF in the temporal horns on T2 sequences (21–23). FLAIR, by suppressing the CSF signal, accentuates the abnormality in the hippocampal region. Although FLAIR is often thought to be as “a heavily T2-weighted image with dark CSF,” the nature of FLAIR sequence causes anything with relatively short T1 and long T2 relaxation times to be hyperintense on the FLAIR images. Some of these lesions may be overlooked on the T2-weighted study alone (Fig. 73.8). Direct comparison of T2 and FLAIR makes it clear that the lesions that are evident on both sets of images are often more obvious on the fast FLAIR. Lesions that are better visualized by fast FLAIR include subtle hyperintensity blurring the gray–white junction of MCD, subcortical foci of gliotic hyperintensity in areas of encephalomalacia, and the extent of infiltration of low-grade neoplasms.
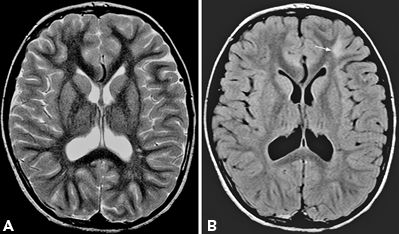
Figure 73.8. MR images to demonstrate superior visualization of subcortical hyperintensity associated with focal cortical dysplasia on FLAIR sequence. The dysplastic region in the left frontal region, nearly invisible on the T2-weighted image (A), is conspicuous (arrow) on the FLAIR image (B).
FLAIR has its own limitations. (i) Motion artifacts due to CSF pulsations, often more striking in the basilar cisterns, can blur the medial temporal regions. Fast T2 sequences are less susceptible to this, and hence, correlation with T2 makes this a relatively minor issue. (ii) Suppression of contrast between gray and white matter may obscure visualization of small foci of heterotopic gray matter without correlative pulse sequences. (iii) Detection of prior hemorrhages is limited with both fast FLAIR and fast T2 images because of the common sequence structure. (iv) Lastly, the contrast on fast FLAIR seems to be most limiting in young children (<2 years) with immature white matter. Normal children in this age group demonstrate patchy foci of hyperintensity in the subcortical and sometimes periventricular white matter that may be misinterpreted as abnormal. Conventional spin density images tend to be more helpful in this age group.
Volumetric High-Resolution Imaging
Conventional spin-echo imaging is generally sufficient to characterize a lesion when it is relatively large. In the case of smaller lesions, it may be difficult to interpret the nature of lesion or even identify the abnormality at all without high-resolution volumetric imaging. The best example of this would be the case of focal area of the dysplastic cortex, which constitutes the major substrate in many patients with refractory extratemporal epilepsy. Diagnosis of these subtle malformations requires critical evaluation of the thickness and morphology of cortical mantle, delineation of the interface between gray and white matter, and detection of minor signal intensity changes in the subcortical white matter. The 4- to 5-mm-thick slice of the routine T2 and FLAIR images frequently fails to detect such subtle abnormalities. Consequently, three-dimensional high-resolution volumetric imaging with T1-weighted gradient- echo protocols has become an integral and critical part of imaging for epileptogenic lesions.
Sequences such as fast spoiled gradient-recalled echo (SPGR), magnetization-prepared rapid acquisition gradient echo (MP-RAGE), and fast spoiled gradient-recalled acquisition in a steady state (GRASS) can be performed rapidly with very short TRs and TEs that provide strong T1-like contrast between gray and white matter (24,25). The hypointensity of the gray matter is quite comparable to the adjacent CSF, and hence, signal abnormalities in the gray matter are generally quite subtle. Conversely, many lesions in the white matter are obvious, but the signal intensity characteristics are frequently nonspecific. Lesions such as gliosis, heterotopia, and neoplasm may have the same degree of hypointensity and may be indistinguishable based on volumetric sequence alone. Lesion morphology, correlation with other pulse sequences, and the clinical setting are necessary to distinguish the lesions. Images acquired through the volumetric study protocols do not have the true T1 contrast as they are gradient-echo sequences and not spin-echo sequences as in conventional T1 image. Hence, lesions that are typically hyperintense on T1 images such as blood products, dystrophic calcification, and proteinaceous fluids may not be apparent on this high-resolution volumetric imaging using gradient-echo sequences.
These three-dimensional sequences are designed to cover the entire head with very thin 1-mm contiguous slices. These thin slices are especially sensitive to detection of subtle dysmorphism of the cortical mantle and can also highlight minimal mass effect by depicting effacement of the adjacent sulcus in case of small tumors. Detection of subtle variations in configuration and volume of hippocampus is greatly improved by high-resolution volumetric imaging and has markedly reduced the need for invasive monitoring in patients with suspected MTS (26). Similarly, detection of concomitant malformation of cortical development in patients with MTS is critical in presurgical evaluation. Routine 4- to 5-mm FLAIR and T2 images are susceptible to volume averaging artifacts and thus misleading when one tries to assess the morphology of hippocampus. Even minimal tilt of the head in the scanner may accentuate this problem. The thin, contiguous three-dimensional slices minimize the volume averaging errors and improve detection of selective atrophy, developmental dysplasia, and subtle masses such as gliomas in the hippocampal formation by visual inspections alone. Volume averaging errors are further minimized if the slices are taken perpendicular to the long axis of the hippocampal formation. Quantitative volumetric analysis of the hippocampal formation and T2 relaxometry—a technique to quantify the signal intensity—may potentially improve recognition of subtle variations in volume and signal abnormality, respectively, as compared to visual inspection alone. However, these techniques are time consuming with minimal additional advantage if any and are not routinely used in clinical practice (27,28).
Other MRI Techniques and Their Utility in Epilepsy
In the last decade, newer MR imaging techniques have tremendously improved our understanding of the disorders of the brain. Careful selection of these sequences may provide useful information in selected causes of epilepsy such as cavernomas, posttraumatic epilepsy, epidermoid cyst, tuberous sclerosis, and acute symptomatic seizures. Some of the newer techniques provide information about the function and connections of the brain further assisting in surgical strategy.
Diffusion-weighted imaging (DWI) has revolutionized the neuroimaging of acute stroke but has limited role in epilepsy. In DWI, diffusion weighting is achieved by two strong diffusion-sensitizing gradients applied symmetrically around the 180-degree radiofrequency pulse of a spin-echo sequence. This leads to dephasing followed by rephasing of protons. Protons that have moved during and after the dephasing gradient move randomly, which leads to incomplete rephasing and signal attenuation. Areas with restricted diffusion of water molecules retain the signal and appear bright on DWI. The degree of diffusion restriction can be quantified by apparent diffusion coefficient (ADC) value. Areas with restricted diffusion appear bright on DWI with low signal intensity (correspondingly low ADC values) on ADC maps (29,30). In focal epilepsies, peri-ictal changes with foci of hyperintensity on DWI with decreased ADC values presumably due to cytotoxic edema have been reported (31,32). Isolated low ADC values without overt hyperintensity on DWI are more common in the peri-ictal studies (33). Conversely, interictal DWI has revealed increased ADC values, which may reflect neuronal loss and increased extracellular space. Other disorders related to epilepsy that may show DWI abnormalities include the following: cortical and subcortical abnormalities in status epilepticus, tumors such as epidermoid cyst (Fig. 73.9), and transient lesions of splenium of corpus callosum related to seizures and antiepileptic drugs (34–36). A significant increase in ADC has been reported in epileptogenic tuber compared to other tubers in patients with tuberous sclerosis and may be helpful in surgical decisions (37).
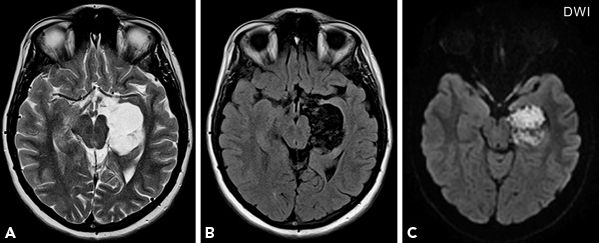
Figure 73.9. A cystic lesion in the left medial temporal region, with signal characteristics similar to CSF, hyperintense on T2-weighted image (A) and hypointense on FLAIR (B), shows diffusion restriction on DWI (C) consistent with epidermoid cyst. Histopathology confirmed the diagnosis.
DTI demonstrates the connections of different regions of the brain. Unlike conventional DWI, the diffusion-sensitizing gradients are applied in six different directions in DTI. As a result, the directionality of water diffusion is studied in addition to magnitude of diffusion. In general, the diffusivity is greater parallel (i.e., along the long axis of the tracts) to than perpendicular to the fiber tracts, and this can be quantified by DTI (38,39). DTI and its role in epilepsy evaluation are presented in greater detail in Chapter 78.
Susceptibility-weighted imaging (SWI) techniques that exploit differences in magnetic susceptibility of tissue components may provide additional information in epileptogenic lesions containing blood products such as cavernomas, certain posttraumatic epilepsies, and Sturge–Weber syndrome. T2* gradient echo (GRE) is the most commonly used sequence for detecting remote blood products. However, SWI—now widely available commercially—is superior to T2* GRE in detection of remote hemorrhages. SWI is a high-resolution three-dimensional gradient-echo technique, which exploits the small differences in magnetic susceptibility among different components of the tissue such as deoxygenated blood, iron, and calcium compared to the surrounding brain tissue. This also illustrates the smallest of veins (because veins contain higher deoxygenated blood) in the submillimeter caliber in great detail. Lesions such as cavernomas tend to be multiple, and some lesions not apparent on T2* GREs may be recognized with SWI (40). In Sturge–Weber syndrome, SWI improves detection of transmedullary and periventricular veins and cortical gyral abnormalities compared to contrast-enhanced T1 images (Fig. 73.10). The cortical gyral abnormalities on SWI seem to represent venous stasis–related hypoxia and correspond to the hypometabolic areas detected on FDG-PET. Thus, SWI has the potential to show functional information in addition to anatomical details in Sturge–Weber syndrome (41,42).
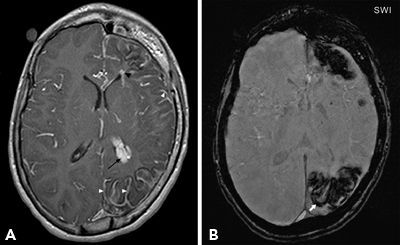
Figure 73.10. Contrast-enhanced T1-weighted image (A), and susceptibility-weighted image (SWI) (B) in a child with Sturge–Weber syndrome. Contrast study shows enlarged periventricular veins (black arrowhead), abnormal leptomeningeal (white arrowheads), and choroid plexus enhancement (black arrow). SWI is superior to visualize the extent of cortical abnormality (arrow). Also, note diffuse left hemispheric atrophy and thickening of ipsilateral calvarium. (Courtesy of Dr. Ingrid Tuxhorn, Cleveland, OH.)
Related posts:


Stay updated, free articles. Join our Telegram channel

Full access? Get Clinical Tree


