Figure 76.1. MEG can be recorded in either the supine or seated position. Patients are placed in a seated position when it is necessary to view a screen or to carry out a task requiring hand–eye coordination. In epilepsy patients, the supine position is used most often in order to promote sleep as an activation procedure for epileptiform activity. The MSR is large enough to accommodate a screen for presentation of visual stimuli or to allow a parent or caregiver to accompany an anxious patient during the MEG study.
In contrast to electroencephalography, where the electrodes are in fixed positions on the scalp, the MEG sensors bear only a vague relationship to brain regions. In addition, the location of the head within the Dewar varies from patient to patient, and it changes even during a recording session on an individual patient. The spatial relationships of the sensor locations to the brain are obtained indirectly based on three-dimensional digitization of several anatomical landmarks, for example, nasion and preauricular points, and by “head position–indicating” (HPI) coils that are affixed to the head with collodion. The locations of the HPI coils, as well as the locations of the anatomical fiducials, are carefully digitized so that their positions can be coregistered with the same landmarks ascertained from the patient’s MRI.
Because the patient must remain relatively still during MEG recording, duration is limited and generally confined to the interictal state (24). Typical MEG monitoring times for epilepsy patients range from 40 minutes to a few hours. Continuous head-position monitoring and correction obviates the need for general anesthesia. Systems that can continuously monitor and correct for head movement have been developed (42,43) and clinically validated (44). Incorporation of these movement compensation methods into commercial MEG systems has dramatically increased their practical clinical utility, especially in children who are unable to stay still. MEG is now extensively employed in children (45–51). While it is well known from EEG that epileptic spikes, which indicate the “irritative zone,” are not always coincident with the ictal onset zone, localization by MEG is generally a robust indication of the epileptogenic zone (52,53).
ANALYSIS AND INTERPRETATION
It is important to review the raw MEG waveforms and to realize that these “brain waves” are analogous to the familiar EEG waveforms (Fig. 76.2). Experience as an electroencephalographer can be applied to MEG, and the fundamental concepts of field determination and source localization, previously established for EEG, are also similarly applied to MEG interpretation (54). Review of the recorded data, typically about 1 hour per patient, is accomplished by paging through 10-second pages in a process quite similar to the traditional electroencephalographic review of high-density EEG, employing several “montages” of MEG sensors. In contrast to EEG, MEG is inherently reference free (55).
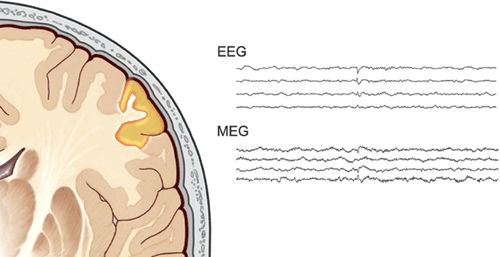
Figure 76.2. Epileptic activity is embodied as an electrical signal. The electrical current also generates a magnetic signal at the same time. Although the morphology and apparent polarity can be different, they record the same phenomenon. EEG is better at detecting radially oriented activity, while MEG sees tangential activity better. It is rare for MEG to be blind to a source, however, as some tangentially oriented cortex is almost always involved, as illustrated by the spike in this figure.
Although there are some differences between normal variants seen in MEG and EEG, identification of MEG spikes essentially follows traditional EEG criteria: Sharp contour, standing out from the surrounding background, following a physiologic distribution, and often presenting with an aftergoing slow wave. The EEG can be viewed separately (blindly if desired) or simultaneously (Fig. 76.3), but in the majority of patients, spikes and sharp waves are more copious on the MEG channels than on EEG (30,54). Since EEG and MEG record the same phenomenon, epileptic spiking for example, reports should include the results of MEG localization along with interpretation of the simultaneous EEG.
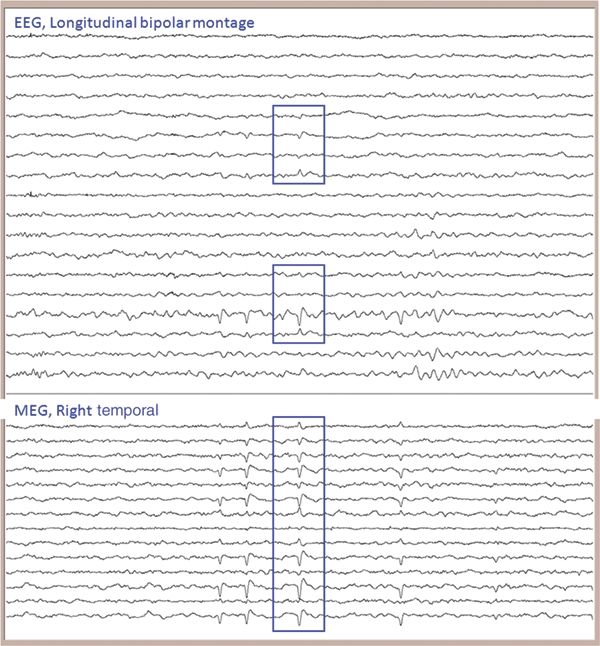
Figure 76.3. It is critical to review both the MEG channels and the simultaneously recorded EEG. They can be displayed and reviewed separately or, as shown here, together. The time window shown is 10 seconds (in this and all subsequent figures). It is important to ensure that the MEG can localize spikes habitually seen on the patient’s previous EEG. Looking at only the MEG spikes which are coincident with EEG, however, would waste a wealth of information that the abnormalities seen only or more prominently on MEG provides.
After identifying and marking candidate spikes in the raw waveforms, the next step is to ascertain what part of the brain is generating these epileptiform discharges. Magnetic field distribution is usually displayed as an iso-field contour map with the aid of computerized calculation. The field distribution produced by a single current dipole is observed as a pair of influx and outflux field maxima distributed on each side of the dipole location (5). Assuming a single dipolar generator for a typical “dipolar” field distribution, an ECD is localized below the middle point of both influx and outflux field maxima. As introduced above in source modeling, this localization is carried out by synthesizing a putative dipole location in a plausible (typically spherical) head model, computing the theoretical field pattern associated with this location, comparing it to the actual measured field pattern, and then iteratively adjusting the location until theory and measurement achieve the “best fit.”
The reason that the term “single equivalent current dipole” (or SECD) is encountered frequently in MEG is often misunderstood. We look for a “dipolar field” distribution for reassurance that employment of the SECD model is appropriate. Modeling the source of cerebral currents as an SECD offers a convenient and rapid method for finding the location of that source. Dipole models are well established for known regional sources, such as somatosensory evoked responses. However, for sources of unknown origin like epileptic spikes, the interpreter must make sure that the SECD is reasonable, as the solution can be significantly biased by the interpreter’s assumptions. Several automated approaches have been proposed to avoid such biases (56–58), but there has been scant utilization of such techniques in clinical work.
Computerized source estimation is more feasible in MEG than in EEG, because of the relatively simpler source and volume conductor models. Employing the vendor’s (Elekta Neuromag, Helsinki, Finland) or third-party (such as CURRY [Compumedics, Charlotte, NC], BESA [MEGIS, Gräfelfing, Germany], etc.) software, epileptic spikes can be localized using an equivalent current source dipole model, on an interactive basis as each spike is encountered, in order to continuously build and test a hypothesis. Alternatively, spike identification can be carried out in a first pass, then source localization as a second pass. Our process is to carry out localization of individual spikes, and never to average spikes, because of the well-known pitfalls of spike averaging (59). Whether the localization of each spike is considered acceptable is based on:
- Presence of a dipolar appearing magnetic field pattern
- No simultaneously occurring artifact
- Stability of the localization with time (i.e., within a window of approximately 5 to 50 ms)
- Acceptable goodness of fit/confidence volume (usually a function of SNR)
Figure 76.4 illustrates the selection of a time point to localize, the magnetic field potential at the scalp surface, and SECD-modeled source of the sharp wave in the right parietal operculum.
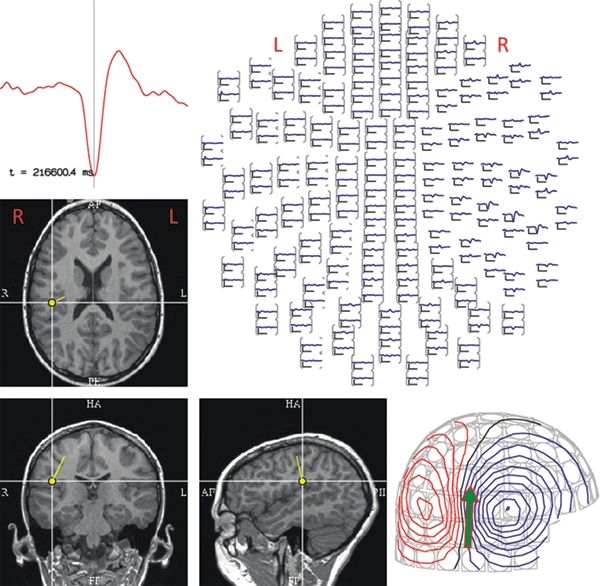
Figure 76.4. This figure depicts the analysis steps that are part of the SECD localization, for the sharp wave that is displayed in Figure 76.3. A representative signal from one of the MEG sensors is shown in the time-expanded graph in the upper left. In the top view of 204 (out of a possible 306) sensors (shown at the upper right), the magnetic activity of this same epoch can be seen maximally in the right temporal sensors. The magnetic field distribution over the head, shown in the lower right, with red indicating magnetic efflux (i.e., exiting the head) and blue showing influx (i.e., entering the head) illustrates a typical “dipolar field.” The results of SECD analysis are instantly coregistered to the patient’s MRI, implicating a source in the right parietal operculum. (R = right, L = left.)
Sources deemed to be acceptable are coregistered to the patient’s own MRI, primarily based on three spatial fiducials, the nasion, and both preauricular points. Using these digitized landmarks and continuous monitoring of the position of the HPI coils during the recording, the location and orientation of the ECD solution can be coregistered with the anatomy and displayed graphically. Typically for epileptiform discharges, dipole locations of several representative spikes are shown (13,36,51,60–62). Some magnetoencephalographers try to superimpose as many as 100 dipoles on one image, in an effort to convey the extent or variability of spike distribution (63).
In electroencephalography, source localization has not yet been broadly accepted as a clinical tool (64). Visual, manual inference of the localization, aided by judicious montage selection (see Chapter 7), has served the electroencephalography community well. Part of the poor penetrance of source localization into the EEG community is due to the requirement for modeling the conductivity of all of the layers of the head and the inherent inaccuracy that this suboptimal modeling produces. In addition, the application of a large number of EEG sensors (sometimes called “high-density EEG”) in order to have sufficient data points for improved source localization has historically been a practical limitation. MEG suffers from neither of these limitations (65,66). Computerized source localization methods are always included as part of the analysis of MEG signals. Not only are the 300 or more time series difficult to analyze visually, but the underlying physics of MEG source modeling make it considerably simpler and more accurate than for EEG. Simple, single-layer, spherical head models have proven adequate for MEG source localization (16,67). In a study from Utrecht (68), spikes localized with MEG were closer to the presumed epileptogenic lesion (tubers) than those localized from EEG recorded at a separate time. In addition, agreement on identification of spikes was higher (as measured by kappa scores) on MEG (151 channels) than on EEG (mostly 85 channels).
Whether the localizations of all detected spikes are diagnostically significant is determined from:
- Number of acceptable dipoles
- Tightness of the dipole cluster
- Orientation of the dipoles
- Plausibility of the location
Studies of the localization accuracy of MEG have shown variable results, primarily dependent on the phenomenon under study (e.g., epileptic spikes vs. SEF), the location of the activity (e.g., dorsal, inferior, mesial), signal-to-noise ratio (which is dependent on room shielding, noise cancellation methods, etc.), localization technique (ECD vs. linear methods), and types of subjects (highly motivated volunteers vs. clinical patients). In studies employing phantoms, typical MEG accuracy for dipole localization is 2 to 4 mm, while EEG achieves only 7 to 8 mm (69,70). The higher spatial resolution is a function of not only the typically greater number of sensors used in MEG relative to EEG but, more importantly, an inherently more accurate forward model (70,71).
In either modality, however, it is important to distinguish the resolution of a single dipole versus a pair (or more) of dipoles, simultaneously fit to the same time slice. If the SECD is unsuitable due to high modeling error, one approach is to employ two synchronous dipoles. As theoretically examined previously (72), while the modeling error is naturally reduced (due to more modeling parameters), the stability of the location of two dipoles is dramatically diminished. The resolving ability of a pair of synchronous dipoles may be as poor as several cm (72). In practice, the vendor or commercial software may not provide automatic fitting procedures and error control of the multiple synchronous models, further complicating routine clinical application, in contrast to the single ECD. An alternative to multiple dipole modeling is to attempt modeling the non-SECD source as a “patch” constrained to cortex (73,74), but this approach also requires a much greater degree of sophistication in reliably and routinely extracting cortical surfaces from a patient’s MRI and then designing the parameters of the patch (e.g., the extent and pattern of assumed activation across the patch). Thus, for routine clinical modeling, the SECD remains the viable approach.
The temporal resolution of MEG is limited only by the sampling rate of the recording system, meaning that it is possible to record wide-band MEG signals all the way to the upper frequency limits of any brain process. This is particularly important in epilepsy where the high spatial and temporal resolution of MEG makes it possible to analyze propagation of epileptic activity and to evaluate the relationship of multiple areas of epileptogenicity, as the case in Figure 76.5 illustrates.
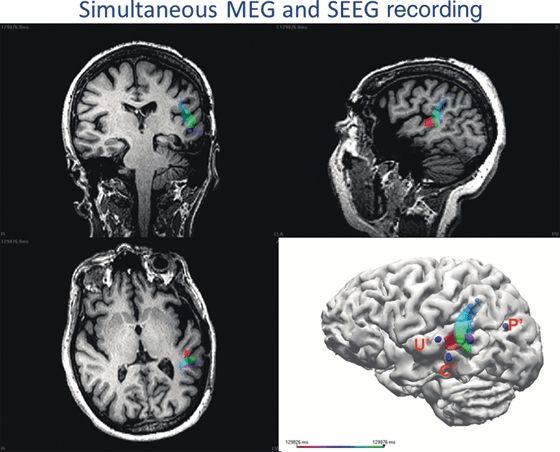
Figure 76.5. This 55-year-old patient had undergone a previous left temporal lobe resection, but automotor seizures with left temporoparietal seizure activity on scalp EEG activity recurred within 2 months. During her intracranial evaluation with SEEG electrodes, spike activity was seen at the C’ and U’ electrodes, but the main area of concern was at the P’ electrode where the onset of seizures was noted. Because of the proximity of Wernicke area, the C’ area was not a candidate for surgical removal, but U’ could be removed. The patient was sent to the MEG laboratory for simultaneous MEG and SEEG recording with the following questions posed: Is C’ entirely separate? Or is there some connection from P’ to C’ and U’? A sequential dipole fit was performed on spikes detected maximally at C’ on the SEEG, evaluating the rising slope of the spike, and the trajectory of the entire 50 ms time course is shown by the multiple dipoles moving from red to green. The epileptic activity moves from the posterior bank of the resection to the posterotemporal gyrus (pink epoch), then back to the posterior bank of the resection, and onward to the posterior superior temporal gyrus (purple epoch), and finally, there is posterior propagation toward the occipital area (green epoch).
INDICATIONS AND BENEFITS IN EPILEPSY
MEG provides another localization data point in the workup of patients being considered for epilepsy surgery. Concordance or discordance of multiple-modality information helps to guide the therapeutic strategy, and it is helpful prognostically as well. In a study of 22 children with normal or minimal MRI findings, good outcome correlated with inclusion of MEG dipole clusters within the resected area, and none of the patients with scattered dipoles or with clusters not resected became seizure free (49). This study confirmed that the best outcomes following epilepsy surgery occur when VEEG and MEG localization results are concordant. Similarly for patients who underwent invasive recordings at our institution, 87.5% were seizure free when ICEEG and MEG were concordant and resected, but only 30% of discordant cases achieved seizure freedom (75).
In patients with tuberous sclerosis, MEG has been used to identify the “hot tuber,” that is, the most epileptogenic of the lesions, whose removal will likely result in the best surgical outcome, using either source analysis (76,77) or other techniques such as “synthetic aperture magnetometry” (78,79).
Especially in those patients with skull defects, as a result of either previous neurosurgery or traumatic injury, EEG localization may be misleading. In these difficult patients, MEG’s immunity to the effects of variations in conductivity offers reliable localization (50,80,81). MEG can also prompt a focused rereview of MRI, converting a nonlesional case into an MRI-positive case (82,83).
APPLICATION AND UTILITY IN COMPLICATED EPILEPSY PATIENTS
Because of the complexity of their evaluation and the difficulties encountered while trying to develop a treatment plan, the majority of the referrals to the MEG lab include patients with intractable epilepsy who are being considered for epilepsy surgery. The typical scenarios where MEG can be of particular benefit are when:
- Other noninvasive tests do not adequately localize the epileptogenic zone or produce conflicting results.
- The MRI is normal.
- More refined definition of the focus in relation to structural lesions is needed.
- Multiple or extensive lesions are present, and it is unclear which part of the lesion or adjacent cortex is epileptogenic.
- Preexisting cranial defects from previous neurosurgery or other alterations of the anatomy distort the localization provided by EEG.
- Contemplated surgical resection is adjacent to essential functional areas of the brain.
- Guidance for placement of intracranial electrodes is required.
The following three cases typify the challenges and results obtained in the evaluation of epilepsy patients with MEG.
Nonlocalizable on Scalp EEG
This 55-year-old, right-handed male, with the onset of seizures at age 25, has mostly nocturnal seizures consisting of asymmetrical tonic posturing. Previous EEGs were negative, MRI was negative, and the ictal SPECT showed bilateral frontal activation. During scalp VEEG monitoring, the findings included only extremely rare bifrontal spikes and nonlocalizable seizures. The sharp waves on MEG shown in Figure 76.6, however, were easily detected, and they were robustly localized in a tight cluster, which was subsequently confirmed by intracranial recording.
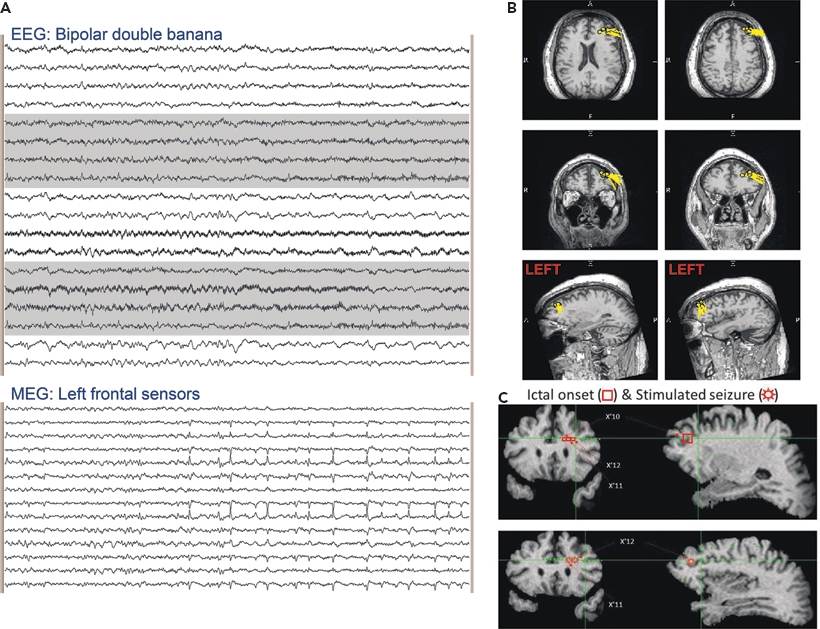
Figure 76.6. The EEG in (A) (standard longitudinal bipolar montage) shows no detectable epileptiform activity. The selected MEG channels from the same time epoch at the bottom of (A) show frequent sharp waves, which are localized to the left middle frontal gyrus and superior frontal sulcus in (B). The subsequent intracranial EEG investigation summarized in (C) demonstrates that the patient’s seizures were coming from the same location. Eleven spontaneous seizures were captured with onset at SEEG electrode contacts X’10,11,12, and the seizures evoked by electrical stimulation were at the same location.
Multiple, Widespread Areas on EEG
In this 32-year-old patient, the EEGs displayed a multifocal picture that appeared to implicate several areas. The patient’s seizure onset was at age 6, and his seizures consisted of abdominal aura, followed by dialeptic seizures, progressing to generalized tonic–clonic seizures. The MRI showed right hippocampal sclerosis, but the PET showed hypometabolism of the both medial temporal lobes, as well as the posterior aspect of the right temporal lobe. The results in Figure 76.7 illustrate how MEG was able to clarify the propagation of the epileptic activity, because of its high temporal and spatial resolution.
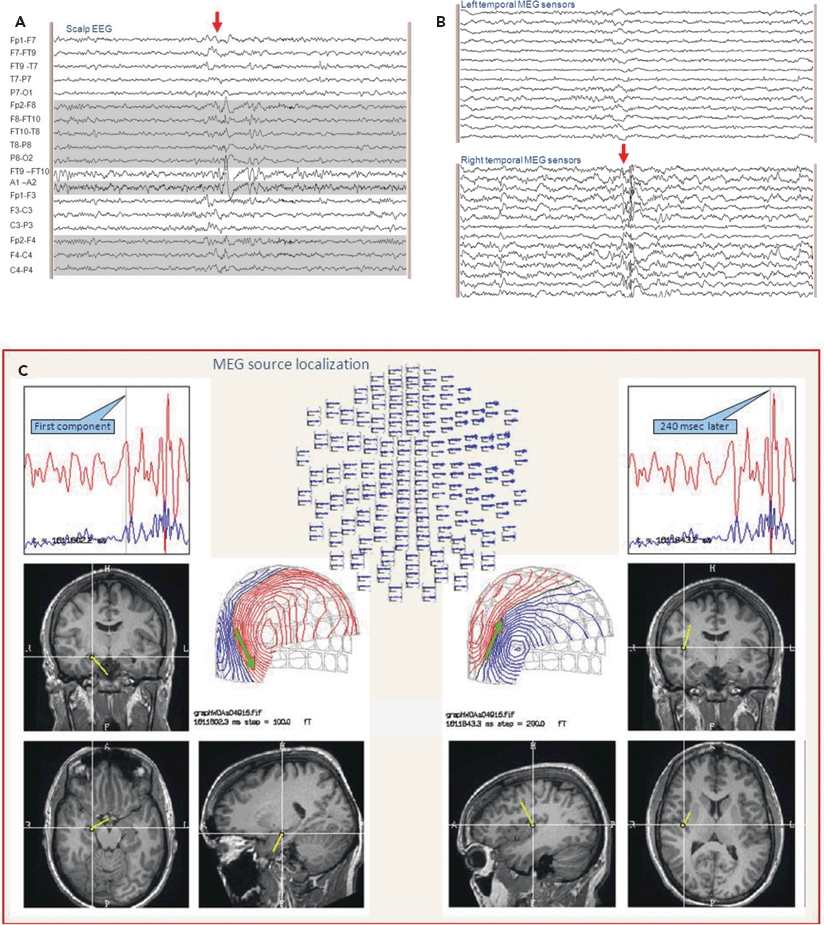
Figure 76.7. The EEG, in (A), shows polyspikes with a complicated distribution in the right frontotemporal region. The selected MEG sensors seen in (B) during the same time epoch show clear definition of the multiple components of the polyspikes. The localization of the sequence of these components shown in (C) clarifies the spread from the right hippocampus to the insula.
Ictal MEG Recording
Although seizures in the MEG are relatively uncommon, they can be serendipitously captured. At the Cleveland Clinic, this occurs in approximately 10% of the patients referred to the MEG laboratory, and when they occur, these recordings of ictal onset by MEG can yield precise localization of the epileptogenic zone. The patient illustrated in Figure 76.8 had six seizures during MEG recording, one of which was a clinical seizure, manifest as a left somatosensory aura, and the rest showed no clinical signs. The MEG demonstrated a clear difference, with the seizures accompanied by clinical manifestations propagating from the posterior middle frontal gyrus to the postcentral gyrus. This propagation pattern was confirmed when the patient underwent intracranial monitoring with subdural grid electrodes.
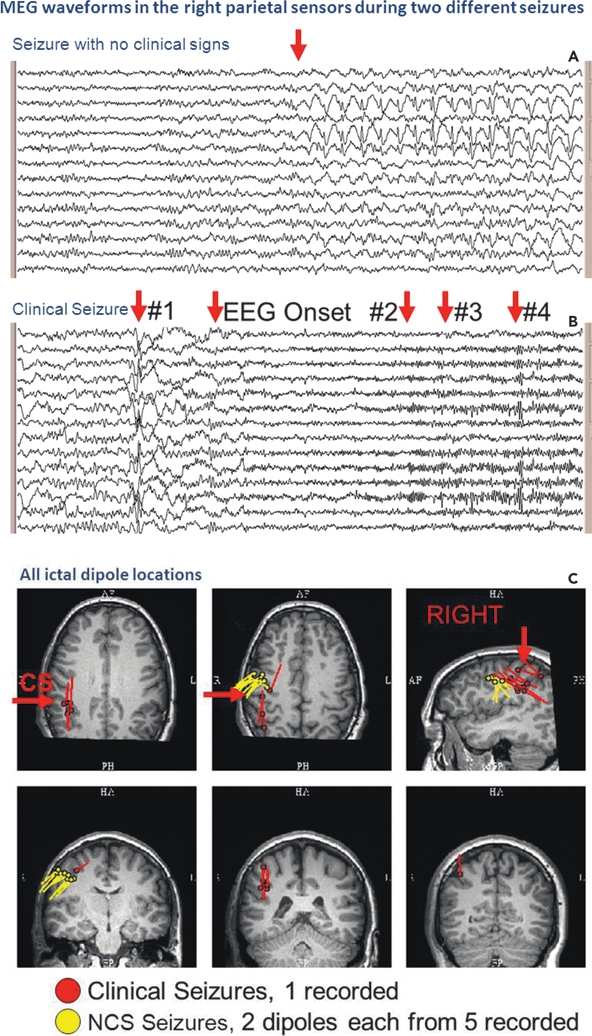
Figure 76.8. An ictal MEG recording captured six seizures in this patient. Five, with no clinical signs, ranged in duration from 10 to 50 seconds, one of which is shown in (A). The seizure without clinical signs showed spike-and-wave complexes, maximally in the right parietal sensors. The clinical seizure on MEG, shown in (B), was marked by background attenuation, the development of an increasing beta discharge, followed by polyspikes in the right parietal sensors. Localization of the portions of the clinical seizure indicated by the arrows was performed and is illustrated by the red dipole locations in (C). From each of the seizures without clinical signs, two time points each were localized, indicated on the figure by the yellow dipoles. Location of the central sulcus is marked by “CS.” The propagation, which is shown by the red dipoles, explains the reason for the clinical manifestations (B).
When the noninvasive data are not entirely concordant, or when the surgical strategy requires further localization, implantation of intracranial electrodes may be contemplated (see Chapter 81 in this volume). MEG’s role in providing guidance for the implantation is extremely important in order to assure adequate sampling of the epileptogenic areas.
SENSITIVITY AND YIELD
MEG has a different spatial sensitivity than EEG and generally does show more spikes than scalp EEG (30,54,84). The sensitivity of MEG is higher for tangentially oriented current flow (55,85–88). However, Hillebrand and Barnes (89) found that <5% of the cortical surface is within 15 degrees of the radial orientation, and at that point, the strength is 25% of that of the tangential dipole. In a more recent study (90), potential sources were distributed over all possible cortical areas. A cortical patch was defined as radial if the orientation angle was within ±10 degrees from the scalp surface normal, and it was defined as tangential if the orientation angle was within ±10 degrees of a line parallel to the scalp surface. The ratio between the number of tangential and radial sources was approximately 3:1. Therefore, for realistic sources in heads, which are never exactly spherical, MEG is very rarely blind to a source due to orientation.
Comparison of the sensitivity of MEG versus EEG to epileptic spikes has been investigated by many authors (24,71,91–93), some concentrating on the temporal lobe (94), over an extended period of MEG’s history. Recent studies looking blindly at EEG and MEG, which were recorded simultaneously, have consistently shown a higher sensitivity for MEG (54,95–97). An example of the oft-reported “MEG-unique” spikes is illustrated in Figure 76.6.
It is important to understand that not all epileptic discharges produced in the cortex are detectable externally by either EEG or MEG. Certainly, there are prominent spikes, which are recorded easily by intracranial electrodes, but which are invisible on MEG. The combination of signal amplitude, volume of discharging tissue, and distance to the sensors determines the degree to which the MEG sensors can see neural activity (10) as illustrated in Figure 76.9 (98). The strength of the magnetic field decreases in proportion to the square of the distance from the current dipole, according to the Biot–Savart law. Therefore, the sensitivity of MEG to deep sources is similar to scalp EEG (87). In addition, there are some unusual situations where almost none of the sources are tangentially oriented, such as in polymicrogyria, where MEG’s sensitivity will be poor (88).
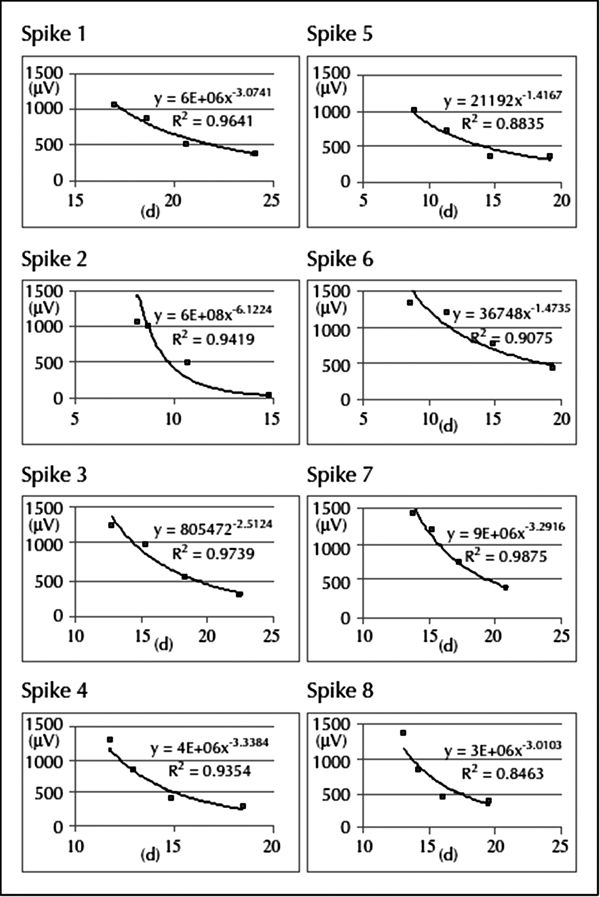
Figure 76.9. Results of the analysis of eight spikes from different locations recorded simultaneously with MEG and SEEG, showing the relationship between the electrical amplitude (μV; y-axis) on each SEEG contact and the distance (d; mm; x-axis) from each spike dipole to the SEEG contacts. The falloff as a function of distance was well approximated by a quadratic function with a high R2 value (>0.80) for all of the simultaneously recorded spikes. The MEG dipole locations reflect the center of the discharge, and the SEEG contacts detect this activity via volume conduction. (130)
Although generally the focus of magnetoencephalography in epilepsy is on localizing interictal spikes, other forms of analysis can be very helpful. Pathologic slow waves can be localized, especially in patients with structural lesions, as an indication of the epileptic substrate (99–101). Techniques based on an assumption of abnormal connectivity can localize epileptogenic areas even in the absence of any frank spikes (102,103).
MAPPING OF ELOQUENT CORTEX
Since another very important task during preoperative evaluation of epilepsy patients is the identification of eloquent cortical areas nearby the proposed surgical resection, MEG fulfills this second purpose through its functional mapping capability. Functional MRI localization of eloquent areas based on hemodynamic activation (see Chapter 73) has high resolution, but may be difficult in children where the MRI can produce claustrophobia, and parents cannot easily accompany and comfort the child (104,105). Because sensory and motor functions are close to the central sulcus, because the orientation of the current flow is in the tangential direction that MEG is best at recording, and because the areas activated by typical evoked field paradigms are small regions easily modeled by SECD, MEG is especially good at localization of somatosensory and motor cortex.
Evoked magnetic fields (MEFs) are generated using stimuli very similar to those used in the familiar evoked electrical potentials. Magnetoencephalography shares with EEG high temporal resolution, but its chief advantage for mapping is in its high spatial resolution. MEFs are therefore done for localization; unlike electrical EPs, MEF latencies and latency asymmetries are not typically employed to screen for abnormalities. The precision and validity of MEFs in the primary modalities of somatosensory evoked fields (106–108), auditory evoked fields (109,110), and visual evoked fields (111–113) have been well established. The potential evoked by voluntary movement of a single finger, widely used in MEG to map the motor cortex (114,115), produces a complex neuromagnetic response: first, a decrease of beta and a simultaneous movement-related increase in gamma are seen followed by a rebound in beta above baseline, amenable to coherence analysis (116). Higher cortical functions such as language are also amenable to MEG source localization (117–123).
FUTURE OPPORTUNITIES FOR MAGNETOENCEPHALOGRAPHY
MEG is primarily an advanced tool, with availability limited to multidisciplinary epilepsy centers, used in selected patients as described above. The number of centers with MEG capability is increasing, however, and greater reliance on MEG as a screening method has been advocated (30). Furthermore, more compact MEG systems are in preparation making more widespread use of MEG more feasible in the future. Recently, MEG has been heavily utilized as a tool for investigating connectivity (124). In epilepsy, the hypothesis, which drives this approach, is that epileptogenic regions are hyperconnected. Investigation may employ simple measures of coupling of power in various frequencies (125) or coherence (102,126). Research utilizing more advanced methods such as imaginary coherence (127,128) or phase coupling (129) is also being evaluated for their clinical utility.
Although MEG has not yet been prospectively demonstrated to replace invasive recording, MEG has the potential to change the way that we interpret depth/SEEG recordings in the multidisciplinary environment. In a study examining several cases of simultaneous depth and MEG recordings, Kakisaka et al. (130) showed that intracranial electrical source activity falls off in a logarithmic manner, and MEG can help to clarify confusing ICEEG results (Fig. 76.10) and may help to prevent inaccurate ICEEG interpretations that lead to surgical failure.
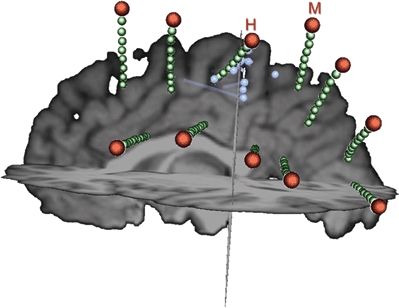
Figure 76.10. During intracranial EEG evaluation in this patient, interictal and ictal discharges were seen over a wide area of SEEG contacts (green), most prominently on several contacts of the H and M electrodes. As demonstrated quantitatively in Figure 76.9, the activity recorded by SEEG drops off rapidly with distance from the source. As seen in this figure, the spacing between SEEG electrodes is substantial. MEG can help to “fill in the gaps” produced by the sparse intracranial electrode coverage. In this case, the MEG localization (dipoles shown as blue spheres and their orientation indicated by blue rods) suggests that the abnormal activity is coming from between the H and M electrodes.
CONCLUSION
Related posts:
 Epidemiologic Aspects of Epilepsy
Application of Electroencephalography in the Intensive Care Setting
Hormones, Catamenial Epilepsy, Sexual Function, and Reproductive and Bone Health in Epilepsy
Other Nonepileptic Paroxysmal Disorders
Driving and Social Issues in Epilepsy
Dietary Therapies for Epilepsy
Epidemiologic Aspects of Epilepsy
Application of Electroencephalography in the Intensive Care Setting
Hormones, Catamenial Epilepsy, Sexual Function, and Reproductive and Bone Health in Epilepsy
Other Nonepileptic Paroxysmal Disorders
Driving and Social Issues in Epilepsy
Dietary Therapies for Epilepsy
Stay updated, free articles. Join our Telegram channel

Full access? Get Clinical Tree


