CHAPTER 3 Molecular Biology Primer for Neurosurgeons
The Candidate Gene Approach
Lacking any biochemical basis that would aid in purifying gene products associated with a disease state, the candidate gene approach was largely an outgrowth of the efforts of positional cloning strategies in the early 1980s. Using linkage analysis to look at differences in chromosome structure in diseased versus nondiseased individuals often in tandem with linkage disequilibrium mapping to define broad (i.e., <10 centimorgans) and much finer respective chromosomal intervals associated with a priori knowledge of their etiologic role in a disease state enabled molecular geneticists to narrow the number of candidate causative genes. Before completion of the Human Genome Project, identifying these loci was an incredibly arduous and time-consuming task, in large part because of the lack of high-resolution genetic and physical chromosomal maps. The unprecedented efforts to surmount these struggles were most famously recorded in the midst of the pioneering work of Louis Kunkel and Ronald Worton1 in identifying dystrophin as the gene responsible for Duchenne’s muscular dystrophy. In the past several decades, numerous genes with high relative risk for similar “simple” mendelian diseases have been successfully identified with these methods. More than 30% of mendelian disease has neurological manifestations.2 By applying the tools of molecular biology to a gene or the small set of candidate genes identified within a quantitative trait loci it has become possible to facilitate a systematic approach to answering some very basic questions about the organization of a gene and the expression of its gene products.
Emerging from the sequence of methods conceptualized first by Sol Spiegelman3 and most effectively by Edwin Southern,4 molecular biologists have exploited the now well-worn principle of molecular hybridization in which a single-stranded nucleic acid probe (or primer) forms a stable hybrid molecule, as a result of nucleotide complementarity, with a single-stranded target sequence immobilized on a solid support (i.e., nitrocellulose or nylon membranes) or in solution (Fig. 3-1). Under the appropriate experimental conditions, the stability and biochemical kinetics of the hybrid are directly proportional to the length and degree of nucleotide complementarity.
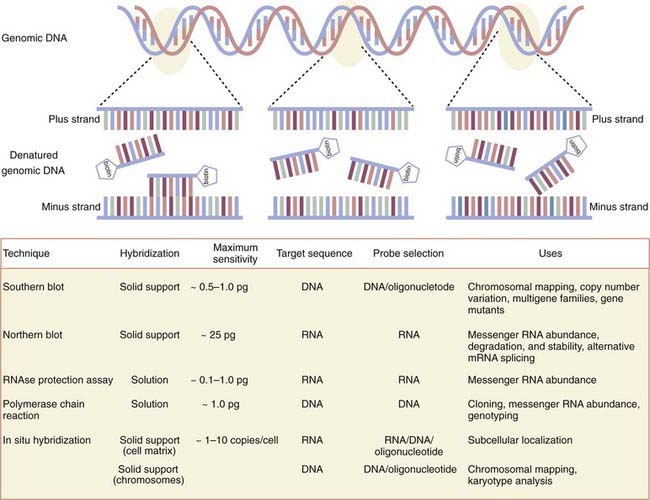
As first applied in Southern blotting whereby genomic DNA was separated according to size by agarose gel electrophoresis, transferred to nitrocellulose, and annealed to complementary DNA probes labeled with a detectable tag hybridized to target genomic DNA, the dosage or deletion analysis, or both, of candidate genes was affirmed. Indeed, Southern blot analysis of the dystrophin gene has identified duplications as well as mapped various exon deletion mutants. Recently, variation in the copy number of genes has received new consideration inasmuch as several new genomic disorders have been shown to be manifested in a gene dosage–dependent manner.5 Such disorders include dup7 (q11.23) syndrome, methyl-CPG-binding protein 2 (MECP2), and adult-onset autosomal dominant leukodystrophy. By reducing the stringency of hybridization conditions, however, differences in hybridization patterns may reveal the existence of certain fragments that are not able to hybridize to the probe under the most stringent hybridization conditions. These data are often the first clues that the gene is part of a larger multigene family that shares significant but not complete nucleotide sequence identity. By using a modification of the Southern blotting method to screen a complementary DNA library at moderate stringency, the dystrophin-like sequence utrophin was identified.6
Traditional Southern blotting has largely been supplanted by the advent of polymerase chain reaction (PCR) protocols. The ability to replicate short fragments of DNA with an enzymatic assay first described by Kleppe and colleagues7 and transformed by Mullis and associates’ use of a thermostable DNA polymerase8,9 has dramatically reduced lead times in comparison to conventional Southern blotting methods. As with Southern blotting, there must be some knowledge of the target DNA sequence for PCR. In practice, PCR typically requires two primers, one of which is complementary to the 5′ DNA region of interest and the other to the 3′ end of the DNA region. The DNA regions can be any part of a gene, exonic or intronic, although amplifications longer than 10 kilobases become increasingly difficult to isolate. Replication of the DNA fragment, or amplicon, occurs processively as part of a series of 20 to 40 repeated temperature cycles in which one cycle consists of denaturation of the DNA target, annealing of the primers to the single-stranded DNA, and enzymatically catalyzed elongation of complementary DNA by a thermostable DNA polymerase. One noteworthy improvement in the past 15 years has been the addition of thermostable DNA polymerases with separate 3′ to 5′ exonuclease proofreading activity, which has resulted in higher sequence fidelity of the amplified product. Among the multiple variants of the basic PCR methodology that have been developed, identification of allele-specific, single nucleotide polymorphisms (SNPs)10 and foci of methylated CpG islands11 in genomic DNA are just two. Because of the dependability and efficiency of amplifying a specific locus within the genome, PCR and its basic multiplex versions, which can amplify several amplicons simultaneously,12 continue to be workhorses for the preparation of genomic samples.
A parallel set of approaches for studying expression of the primary products of gene transcription that involve messenger RNA (mRNA) has enabled neuroscientists to assign critical spatiotemporal information to gene function. The first technique developed to do so, the Northern blot,13 differs from the Southern blot in that the target molecules separated according to size by agarose gel electrophoresis under denaturing conditions and transferred to a membrane support for hybridization consist of RNA, whether total RNA or poly A+ mRNA. At the organ or tissue level, it remains unmatched in its ability to provide an accurate size of the transcript and quantifiable patterns of gene expression during development or disease states, or both. Furthermore, differences in the size of the transcript within or among samples suggest any number of possibilities, including but not limited to alterative splicing, alternative start sites, or differences in polyadenylation. Typically, medium- and high-abundance messages are readily visualized with labeled probes. However, low-abundance messages can be difficult to detect.
The low-throughput methodology, long lead times, and limits of detection dictated by RNA immobilization on solid-phase supports have largely been overcome by the development of solution-based hybridization techniques that provide at least an order of magnitude more sensitive for detecting mRNA transcripts. Detection of mRNA in its native state by the ribonuclease protection assay adapts the Northern blot approach by hybridizing a labeled complementary RNA probe (usually 100 to 500 base pairs) with high specific activity to unlabeled cellular RNA that is freely suspended in solution.14 The resulting RNA duplexes, which are highly stable, are protected from digestion by single-strand–specific ribonucleases and separated by polyacrylamide gel electrophoresis (PAGE). Detection of signal by the isotopic or nonisotopic labels offer sensitive and reliable detection and quantitation of mRNA that is up to 50 times more sensitive than Northern blotting.15 A second solution-based alternative requires conversion of the native mRNA to complementary DNA by reverse transcriptase followed by PCR. Although gene-specific primers can be used for the reverse transcription, a polythymidine oligonucleotide (oligo-dT), random hexamers, or combination of them are most frequently used. Oligo-dT primers readily hybridize to the translationally important poly A+ tails present in most mRNA and thereby bias the start site of reverse transcription toward the 3′ end of the mRNA. Conversely, random hexamers are often used when attempting to obtain a target template closer to the 5′ end of long mRNA sequences. Detection of the target sequence can be achieved by standard PCR protocols, whereas multiplex PCR protocols allow the simultaneous detection of several amplicons.12 However, when quantitation is required, quantitative real-time PCR (qRT-PCR) protocols are necessary.16,17 qRT-PCR requires primers with specific design characteristics and amplicons with no more than 250 base pairs. Before quantitation, it is essential that the primers be exhaustively tested with the target template to ensure that the gene of interest is amplified and is the expected size. Two versions of qRT-PCR are now in use. The most simple qRT-PCR methodology uses a fluorescent dye that emits short wavelengths of ultraviolet spectrum light as a function of the number of amplicons created during each successive cycle when it intercalates with the double-stranded DNA formed during the thermocycling process. The generation of nonspecific, double-stranded PCR products, often referred to as primer-dimers, can interfere with or completely prevent quantitation. A more reliable but more expensive qRT-PCR route uses the addition of a separate sequence-specific RNA- or DNA-based probe modified with a fluorescence reporter at one end of the molecule and a quencher of fluorescence at the other end. In this version of qRT-PCR, the fluorescent reporter probe anneals to the target template somewhere in the target amplicon between the qRT-PCR primers. In intact reporter probes, the fluorescence is quenched. Detection and quantitation occur only as signal is emitted because the fluorescent reporter is physically cleaved from the quencher by the 5′-3′ exonuclease activity of the thermostable polymerase during the elongation step. To ensure accuracy with any of these solution-based mRNA quantitation assays, it is necessary to normalize expression of the target transcript with a stably expressed control gene. These methods are most favored when dealing with low-abundance transcripts and when the cellular RNA material is limited or, in a worst-case scenario, partially degraded.
In the past several years there has been a renaissance in Northern blotting methods for detecting a specific set of small RNA molecules, microRNAs (miRNAs). miRNAs are abundant, single-stranded, 21- to 23-nucleotide RNA molecules processed from endogenous 70-nucleotide pre-miRNAs by two enzymes, Drosha and Dicer.18–20 These small noncoding RNAs are recruited to unique ribonucleoprotein complexes, RNA-induced silencing complexes,21,22 where they mediate the translational suppression or degradation of nascent mRNA transcripts bearing homologous antisense sequence in their 3′ untranslated regions.23 miRNA function appears to have an essential role in neuronal development,24,25 and recent indications suggest that dysregulation of miRNA networks contributes to neurodegenerative disease.26–28 As an analytic tool, the popularity of the Northern blot lies in its continued accuracy in estimating the size of the mature miRNA molecule and the ability to detect the pre-miRNA product simultaneously. Enhanced detection advances consisting of cross-linking small RNA molecules (<100 nucleotides) to nylon membranes,29 as well as the use of locked nucleic acids,30,31 to increase probe specificity are among the most recent contributions.
Originally, detection schemes for in situ hybridization used isotopic labels (33P or 35S) incorporated into the complementary probes. Quantitative methods for converting radioactive signal with silver grain density via photographic emulsion have been widely used since the mid-1990s.32 Nonisotopic detection methods have multiplied over the past 2 decades because they take a considerably shorter time, can have greater signal resolution, and allow the simultaneous detection of multiple different targets by combining various detection methods. Complementary probes labeled with biotin or digoxigenin allow a number of different detection options. Some use colorimetric substrates consisting of horseradish peroxidase or alkaline phosphatase conjugated to streptavidin beads or primary antidigoxigenin antibodies to facilitate detection. Data from the Allen Brain Atlas use just such a colorimetric detection strategy, which provides an increasingly comprehensive data set of expressed gene at the cellular level.33 One continuing technical concern with enzyme-linked amplification schemes is diffusion of the colorimetric signal from the site of localization. Research laboratories have used fluorescence detection schemes within the past several decades that involve new generations of fluorophores with long-term photostability, such as Alexa dyes or quantum dot (Qdot) nanocrystals; these fluorophores have been key components in illuminating the trafficking dynamics of mRNA molecules within the subcellular compartments of dendrites34 and axons35,36 via conventional epifluorescent microscopy or single-photon confocal laser scanning microscopy. Quantitative data analysis of these fluorescent images requires the use of image acquisition and analysis software such as Metamorph or IP Lab. In a typical sample, the total fluorescence intensity for a region of interest, normalized against background noise and any differences in the area of the region of interest, is compared across experiments or among samples and subjected to statistical analysis. In contemporary molecular cytogenetics, fluorescence in situ hybridization (FISH)-based karyotyping and banding methods refer to a rubric of techniques used for both clinical genetics and tumor cytogenetics that can simultaneously characterize several chromosomes or chromosomal subregions (Box 3-1).
Box 3-1
Array of Fluorescence In Situ Hybridization–Based Methods in Molecular Cytogenetics
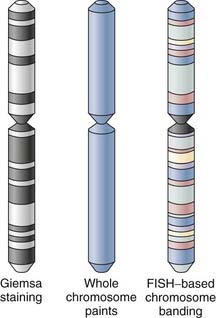
Over the past several decades, G-banding has served as one of the routine standards for chromosome banding. It relies on successful culture of the tissue of investigation, often fetal or tumor tissue, and preparation of metaphase cells. It should be noted that product-of-conception samples in particular suffer relatively high rates of failure (10% to 40%) during the tissue-culturing process37 and poor chromosome morphology.38 Monochrome changes in the visible karyotype of morphologically optimal samples produced by Giemsa staining can provide low but sufficient chromosomal resolution to distinguish changes in chromosome number and large structural rearrangements whether translocations or macrodeletions. Chromosomes with small translocations, cryptic aberrations, microdeletions, and inversions or more complex karyotypes are often beyond the limits of conventional G-banding analysis.39 As a result, complementary fluorescence in situ hybridization (FISH)-based karyotyping and banding methods have been developed to overcome the intrinsic morphologic and technical obstacles in karyotyping associated with G-banding protocols.
In its most basic form, FISH-based karyotyping uses DNA probes hybridizing to a specific gene or chromosome locus in metaphase or, less commonly, interphase chromosome preparations for the straightforward detection of deletion/duplication syndromes and gene fusions or rearrangements. In contrast to metaphase FISH, interphase FISH does not require the growth of viable cells for the preparation of a chromosomal spread. Interphase FISH makes use of preserved tissue and cellular material such as that found in paraffin-embedded biopsy samples. Perhaps the most significant advance in the past decade or so has been the development of multicolor FISH-based karyotyping and banding techniques (Fig. 3-2). The various iterations of multicolor FISH karyotyping methods are all based on the availability of chromosome-specific probe sets developed from degenerate oligonucleotide–primed polymerase chain reaction of flow-sorted chromosomal libraries40,41 labeled in tandem with four to seven spectrally separable fluorochrome labels42 that simultaneously “paint” and distinguish each whole chromosome.43,44 Chromosome painting with chromosome-specific probes can be done combinatorially (e.g., multiplex FISH or spectral karyotyping) or by using an additional ratiometric approach45 (i.e., combined binary ratio–FISH) and has proved to be a powerful adjunct to conventional cytogenetic techniques in the diagnostic analysis of interchromosomal events and characterization of the cytogenetic evolution of tumors, even in complex aberrations. The sensitivity (i.e., whether a translocation can be detected) and specificity (i.e., whether it can classified with assurance) of the analysis are vitally dependent on the fluorochrome combinations used in the target chromosomes.46 The resolution of these whole chromosome–painting techniques is limited by the lack of any additional spatial delineation within a chromosome. For this reason, multicolor karyotyping alone is often not sensitive enough to precisely determine chromosomal breakpoints, subtle chromosome rearrangements, or intrachromosomal aberrations (e.g., inversions, duplications, terminal deletions). Differential hybridization signals obtained with other FISH-based karyotype techniques, such as comparative genomic hybridization, have similar resolving capabilities.47 Efforts to improve the resolution of these assays have used chromosome arm–specific,44,48 region-specific,49,50 centromeric,51 and subtelomeric probes.52,53 To address the latter issue of intrachromosomal aberrations, FISH-based banding patterns obtained by using differentially labeled and pooled subregional DNA probes were designed to produce high-resolution chromosomal karyotypes with identifiable fluorescent banding patterns within a single chromosome via spectral color banding,54 cross-species color banding49,55 or multicolor banding.50,56
As intermediaries in the continuum between genotype and phenotype, levels of mRNA should be taken as a surrogate for corresponding protein expression or their functional activity with caution. Early data sets attempting to establish a correlation between protein and mRNA levels found varying degrees of concordance. Although a significant positive correlation has been observed in human transitional cell carcinomas,57 more marginal grading was observed in a comparative examination of 19 genes in the human liver.58 Conversely, in a more limited study of three matrix metalloproteinase–related genes expressed in benign and neoplastic prostate tissue,59 no correlative relationships were identified. When these data are placed in the context of the vast regulatory networks that monitor the various posttranscriptional events, this wide variability is not entirely unexpected. A nearly universal theme among the traditional tools for assaying protein expression is the use of affinity between an antibody and an epitope on the target protein to facilitate protein detection. The specificity of the primary antibody is the central determinant in the accuracy of protein recognition. Much like assays for detecting nucleic acids, methods to identify protein expression can be accomplished with the use of blots, free in solution or in situ.
Protein blots, more commonly referred to as Western blots,60 immobilize size-separated protein lysates on membranes (e.g., nitrocellulose or polyvinylidene difluoride [PVDF]), where they are detected with a monoclonal or polyclonal antibody.61,62 In short, cellular proteins solubilized in a lysis buffer containing one or more detergents, protease inhibitors, and more often than not, a strong reducing agent are separated by PAGE. Separation is most commonly accomplished by molecular weight. However, separation in this single dimension may be further refined by prior separation in an immobilized pH gradient gel, and these gels are often referred to as two-dimensional (2D) gels. Although protein lysates can be run under nondenaturing conditions, usually when separating by molecular weight, sodium dodecyl sulfate (SDS) is incorporated in the polyacrylamide gels and the running buffers to maintain the protein lysates in a denatured state. Strong reducing agents such as β-mercaptoethanol or dithiothreitol in the lysis or loading buffer (or in both) eliminate any secondary or tertiary folding that would interfere with protein migration within the polyacrylamide gel. Changes in the percentage of acrylamide within the gel determine how well low- or high-molecular-weight proteins separate within the gel. Gels with a higher percentage of acrylamide resolve lower-molecular-weight proteins better and vice versa. The gel-immobilized proteins are transferred in a glycine-based buffer to nitrocellulose or PVDF membranes. The addition of a primary antibody recognizing the target protein facilitates detection of the protein, most commonly in a multistep (i.e., indirect) detection scheme using fluorescently labeled secondary antibodies or enzyme-linked secondary antibodies and various colorimetric, chemifluorescent, or chemiluminescent substrates. Advances in antibody production offer not only a growing selection of primary immunoreagents but also novel innovations in antibody development that combine the most attractive properties of mouse monoclonal (e.g., uniformity, purity, indefinite availability) with rabbit polyclonal (higher affinity) antibodies.63,64 The choice of primary antibody is not without a caveat. A single primary antibody will rarely share equal affinity for the target proteins in nondenaturing and denaturing conditions and often has to be determined empirically. Signal detection reveals the experimental molecular weight of the protein, which can be compared against the calculated molecular weight of the open reading frame. Although aberrant migration can occur as a result of the intrinsic properties of the protein sequence, significant differences in molecular weight are also suggestive of cotranslational or posttranslational protein modifications. The ability to obtain quantitative information from signal detection is quite limited regardless of the detection scheme, but with proper normalization for loading errors65 and effort to increase the dynamic range of signal66 by using cameras with charge-coupled devices, there has been considerable improvement. A far more sensitive technique for determining protein abundance is the sandwich enzyme-linked immunosorbent assay (ELISA).67 Sandwich-ELISA methodology requires a capture antibody that recognizes the protein of interest. It is adsorbed to the surface of a microtiter plate and flooded with the presence of protein lysate. Any antigenic sequence within the protein of interest binds to the capture antibody. A detecting antibody that also recognizes the protein of interest, although at a different epitope not occluded by the capture antibody, is added to facilitate detection of the protein. Once an enzyme-linked secondary antibody is bound to the detecting antibody, an inert substrate of the enzyme is cleaved to create fluorescent or chemiluminescent signal that can be quantified to determine the concentration of the antigen.
Another widely used protein detection method is immunoprecipitation.68 The principal methodology is very simple. An antibody recognizing the target protein is incubated with cell lysates in solution in the presence of protease inhibitors and allowed to form an immune complex, which can then be “precipitated” out of the solution by using protein A/G–coupled agarose beads. Proteins not captured by the primary antibody and sequestered within the immune complex are washed away. The immune complexes (antibody and antigen) are eluted from the protein A/G–coupled beads, separated by SDS-PAGE, and analyzed by Western blot to verify the identity and quantity of the target protein. One important variable is the composition of the immunoprecipitation lysis buffer. Ideally, the lysis buffer is able to balance the solubilization of proteins from the original tissue or cell matrix while leaving their native conformation intact.69 By so doing, immunoprecipitation protocols seek to physically isolate the protein of interest from the rest of the cell lysate while retaining the protein-protein interactions of the target antigen. One criticism of this methodology has focused on the potential for identifying false-positive co-immunoprecipitation protein partners because of the lysis step, which allows all the solubilized cellular constituents to mix in solution. This mixing may produce nonphysiologic interactions because proteins normally compartmentalized within the cellular milieu or expressed in different cell types are now allowed to interact. As a result, validation of such protein-protein interactions by parallel methods will be required (Box 3-2).
Box 3-2
Protein Domains and Selected Parallel Methodologies for Assessing Protein-Protein Interactions
The three-dimensional structure of a protein is often scattered, with various protein modules that can fold and, in some cases, autonomously retain the function of the rest of the protein chain.70 Numerous protein-protein interaction domains and their sequence boundaries have been identified by structural data from x-ray crystallography and nuclear magnetic resonance, but obtaining these data is time-consuming and labor-intensive. By extrapolating from these data, mathematical algorithms have been constructed to query the primary amino acid sequence for the presence of and boundaries for various types of protein-protein–interacting domains and interfaces. Meanwhile, curated databases have been assembled to identify and catalog many of the physical interactions among pairs or larger groups of proteins.71 Identification of direct interacting partners will require multiple ways of verifying any interaction. A selected set of protein-protein interaction methodologies that are, to varying degrees, complementary with immunoprecipitation are presented in the following sections.
Protein Affinity Chromatography/Pull-Down Assay
A protein is covalently or noncovalently coupled to a solid-phase matrix, such as cyanogen bromide (CNBr), and protein lysates are run through the column.72 Weakly retained and strongly retained protein can be eluted under differing salt conditions. These columns can be incredibly sensitive with detectable binding constants as weak as 10−5 M. However, retaining the native structure, activity, and proper orientation of the protein when directly immobilized to a CNBr matrix can be difficult and result in contradictory results when compared with other methods.73 As an alternative, the target protein is expressed with a suitable affinity tag (e.g., poly-His, biotin, GST, FLAG, c-myc) and immobilized on agarose-Sepharose supports by its respective ligand (e.g., Ni2+, streptavidin, glutathione, or monoclonal antibodies specific to FLAG or c-myc). The interacting partner can be identified by Western blots, direct sequencing, or mass spectrometry.
Tandem Affinity Purification
This protein affinity assay requires placing two tags such as protein A and the calmodulin-binding protein on a bait protein separated by a TEV protease cleavage site. It reduces nonspecific pull-down of proteins through successive rounds of purification, but it does so at the expense of transient protein-protein interactions.74,75 A particularly successful application of the tandem affinity purification system in combination with mass spectrometry was used for the systematic analysis of yeast protein complexes.76
In Vivo Cross-Linking
False-positive results generated by the loss of spatial organization during the lysis step are mitigated by chemical and photo cross-linking to covalently “freeze” the protein-protein interactions in situ before isolation. Chemical cross-linking77,78 typically uses the exogenous introduction of a variety of homo- or hetero-bifunctional cross-linking reagents. In contrast, photo cross-linking uses modified versions of leucine (photo-leucine) and methionine (photo-methionine) containing a photoactivatable diazirine ring incorporated into growing peptide chains by the nascent translation apparatus.79 The addition of either amino acid does not alter the cell’s metabolism, but when the cells are exposed to ultraviolet light, highly reactive intermediates enable identification of protein-protein interactions when used in combination with immunoprecipitation, Western blotting, or mass spectrometry.
Label Transfer
Label transfer is a variation of the cross-linking methodologies that is especially useful for detecting weak or transient protein-protein interactions. It involves coupling of an isotopic or nonisotopic label transfer reagent into the bait protein and incubating it with an unlabeled protein lysate. When exposed to ultraviolet light, any interacting proteins are cross-linked by the label transfer reagent. The actual label transfer occurs when the cross-linker is cleaved so that the label is left attached to the interacting protein, where it can be detected by separation via sodium dodecyl sulfate–polyacrylamide gel electrophoresis and Western analysis, sequence analysis, or mass spectrometry.80,81
Yeast Two-Hybrid Screening
Pioneered by Fields and Song,82 the yeast two-hybrid screening technique uses transcriptional activity to assess protein-protein interactions. The premise of the technique is activation of a downstream reporter gene (e.g., β-galactosidase, secreted alkaline phosphatase, luciferase) that is easily assayed by binding of the Gal4 binding domain (BD) and Gal4 activating domain (AD) proteins to an upstream activating sequence. The BD and AD do not need to directly bind but are brought together in apposition with suspected interacting proteins fused with the AD or BD. Although useful as a complementary tool, this technique has a notoriously high false-positive rate.
Fluorescence Resonance Energy Transfer
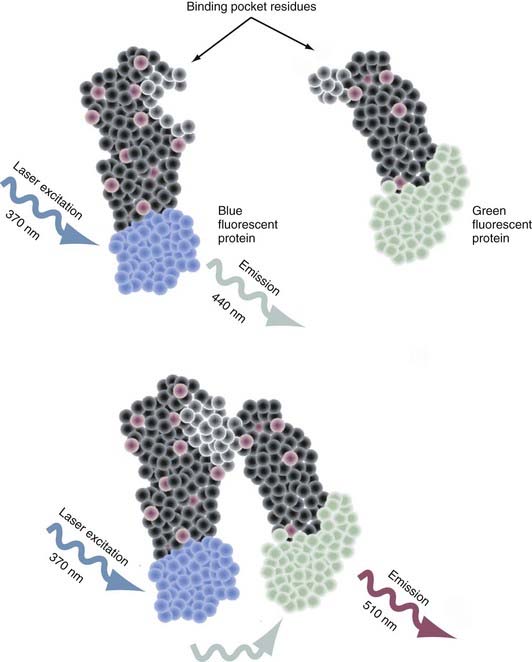
Intermolecular fluorescence resonance energy transfer (FRET) is a spectroscopic method that assesses the proximity and relative angular orientation of two different proteins—one having a donor fluorophore such as cyan fluorescent protein and the other having an acceptor fluorophore such as yellow fluorescent protein—by monitoring the emission spectra when laser excitation of the donor protein is applied.83–85 When the fluorophores are separated, only the emission spectra of the donor protein is observed (Fig. 3-3). When in close enough proximity, laser excitation of the donor fluorophore transfers the excited energy state to the acceptor fluorophore and generates a peak in its emission spectra. The two principal reasons why this technique is proving to be an extremely valuable tool for probing protein-protein interactions are that (1) the efficiency of this transfer is extremely sensitive to the separation in distance between the two fluorophores and (2) the range over which the transfer in the excited energy state can occur is spatially delimited to approximately 10 nm.
Determining the subcellular distribution of protein expression from the results of Western blotting or immunoprecipitation is constrained by the type of lysate used. Differential centrifugation protocols are the simplest way to fractionate various organelles, membranes, and subcellular structures as starting material for these protein assays, but residual contaminants interfere with detection of the nuanced changes in subcellular localization and intercompartmental translocations that are thought to be crucial to cellular information-processing networks.86 In situ visualization of protein expression in sections of frozen or paraffin-embedded fixed tissue (i.e., immunohistochemistry) and its cognate technique in fixed cells in culture (i.e., immunocytochemistry) are robust and dynamic methods for identifying and quantifying alterations in patterns of localization in the various compartments and subcellular structures intrinsic to nerve cells. They apply a common methodology based on the ability of a primary antibody to bind to endogenous proteins expressed within its native cytoarchitectural matrix. Primary antibodies can be directly conjugated to enzymes or fluorophores to facilitate detection. More often, because of reduced cost, labeled secondary antibodies are used with colorimetric or indirect immunofluorescence visualization schemes to provide quantifiable patterns of protein distribution. Indirect immunolabeling of multiple primary antibodies, which is most easily accomplished when the primary antibodies are raised in different species, can be used to correlate the colocalization of additional proteins when the emission spectra of the fluorophore-conjugated secondary antibody are separable. Because the maximal optical spatial resolution defined by Rayleigh scattering is approximately 200 nm for conventional wide-field fluorescence microscopic techniques, colocalization is suggestive of, although not formal proof of a protein-protein interaction.
The microinjection of a directly conjugated, high-quality antibody presents an opportunity to visualize protein expression dynamics in live cells. Recent improvements in neuronal transfection techniques frequently make heterologous expression of DNA constructs a more consistent option. A chimera of the target protein fused with a fluorescent protein (FP),87,88 such as GFP, DsRed, or their variants, with increased brightness and folding efficiency89 has the enviable characteristic of requiring no cofactors other than O2. When directly imaged, changes in the subcellular distribution of the chimeric protein can be quantified in largely the same manner described for FISH-based mRNA trafficking dynamics in neuronal processes. There persist three experimental concerns, only one of which is technical, that limit the usefulness of this type of transfection approach. The technical limitation is the size of the chimera sequence itself. Ordinarily, mammalian expression constructs are only efficient at driving overexpression of DNA constructs that are less than about 10 kilobases in size. The additional concerns are biologic and twofold. First, does overexpression of the DNA construct lead to ectopic expression of the target chimera? Second, does expression of the FP tag interfere in any way with the functional activity of the target protein? Most autofluorescent fusion proteins have been constructed by placing the coding sequence of the target protein upstream or downstream of the FP sequence. When either of these locations has a negative impact on target protein function, the alternative is to insert the FP sequence within the open reading frame. Lacking any previous knowledge of where to place the FP within the open reading frame, finding a permissive site is guesswork at best. One strategy to overcome the pitfalls of performing sequential insertions to create a functional FP fusion uses the bacterial Tn5 transposon to create libraries of FPs that can then be individually isolated and tested.90
When interfering with the activity of the target protein is the desired goal, there is no equivalent instrument in the molecular neurobiologist’s toolbox to genetic techniques that precisely and completely eliminate gene function.91 One now widely disseminated nucleic acid–based gene-specific silencing method to partially silence gene function uses the RNA interference (RNAi) pathway.92 Small interfering RNAs (siRNAs) are 20- to 25-nucleotide, double-stranded effector molecules of RNAi. They are integrated into the RNA-induced silencing complex in the same fashion as miRNA (Fig. 3-4),93–95 where they become juxtaposed with endogenous mRNA, base-pair with perfect homology to the mRNA, and cause it to be cleaved by argonaute-2 (Ago-2), the catalytic component of the RNA-induced silencing complex (RISC). In primary neuronal or astrocyte culture, transient transfection with the siRNA duplexes or with plasmid-encoded short-hairpin RNA (shRNA), which expresses the siRNA duplex as a hairpin suitable for processing with the enzyme Dicer, is the most common course of action. In vivo delivery of siRNA has proved successful with plasmid- or viral vector–encoded shRNA via a number of local96–100 or systemic96,101–103 applications. Although the empirical rules for rational siRNA design and selection prediction algorithms improve specificity,104 the efficacy of the knockdown can vary as a function of whether individual or pooled sets of siRNA are used and the potency of this siRNA. The most attractive potential of RNAi is the flexibility that it allows in controlling the spatial and temporal effects of inhibition. With the development of inducible siRNA whose expression is controlled by tetracycline- or doxycycline-regulated promoters,105–109 photoactivated versions of “caged” siRNA,110 and focal transfection methods,111 stepwise advances to this promise are being realized. Although the low to moderate concentrations of siRNA typically used to produce significant knockdown tend to evade interferon response–mediated changes in global gene expression,112,113 a secondary effect has on occasion been noted.114,115 A more acute concern is the possibility of an siRNA modulating the expression of a closely related sequence116–118 and resulting in observable changes in phenotype.119 Chemical modifications of the siRNA can mitigate some of these off-target effects,120 but the exact nature of siRNA specificity remains unclear (see Elbashir and colleagues121 and Miller and associates,122 but compare with Semizarov and coworkers123). Until a better consensus of siRNA specificity is reached, current siRNA design suggests allowing for at least two nucleotide mismatches with all off-target genes. A recent editorial suggests that the ideal control is to rescue the siRNA phenotype by using an siRNA-resistant gene with a silent mutation in the 3′ nucleotide of a codon in the middle of the siRNA binding site.124
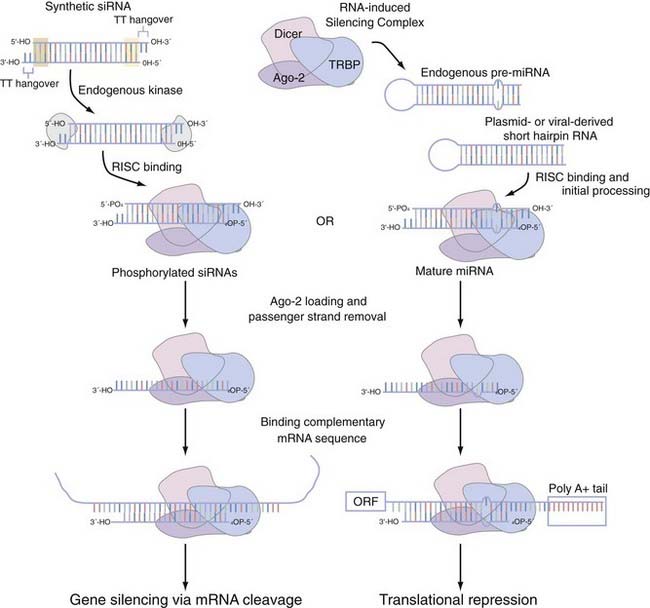
FIGURE 3-4 Small interfering RNA (siRNA) and microRNA (miRNA) processing pathway using the RNA-inducing silencing complex (RISC). RISC mediates the functional activity of both siRNA and miRNA. Short-hairpin versions of siRNA or endogenous miRNA are recruited to the RISC, which in mammals is composed of three core proteins (e.g., Dicer, TRBP, and argonaute-2 [Ago-2]) and associate with each other in the absence of double-stranded RNA (dsRNA).93,94 Synthetic siRNA duplexes, which are initially processed by an endogenous kinase, have a number of structural features that we highlight. The 21- to 23-nucleotide complexes have areas of high (highlighted by the green shaded box) and low (highlighted by the yellow shaded box) thermodynamic stability that dictates which strand is eventually incorporated into the RISC complex as the guide strand. These siRNA duplexes typically also incorporate a pair of thymidine base pairs as 3′ overhangs of each strand. After incorporation into the RISC, the dsRNA of both siRNA and miRNA is then unwound; only the guide strand is loaded onto Ago-2, whereas the passenger strand is released.95 On binding of mRNA with complete complementarity (siRNA) or with nucleotide mismatches (miRNA or, not pictured, siRNA), this dsRNA is able to influence gene function. siRNA can bind anywhere in the messenger RNA (mRNA), whereas miRNA is thought to bind primarily in the 3′ untranslated region.
The Rise of Functional Genomics
Candidate gene studies take advantage of two lines of evidence that dovetail to increase success: the increased efficiency of association studies in selected population-based samples and an a priori understanding of the clinical phenotypes and how it might be affected by candidate gene function. However, this approach has met with mixed success when assessing complex diseases in which multiple genes, as well as their sequence and functional variants, probably initiate small individual contributions and relative risk for a cumulative phenotype that varies in the severity of symptoms and age at onset and evolves over time. Lacking the tools of scale to perform the simultaneous analyses required, continuing efforts toward miniaturization and scalability epitomize the new “omics” technologies that are transforming nervous system studies by allowing data-rich and detailed characterization of the molecular mechanisms underlying cell physiology. Ironically, it does so by using the very same methods of biochemistry, molecular biology, and cell biology worked out decades earlier. At its core, functional genomics aspires to integrate data from the study of different molecular strata—the genome, transcriptome, proteome, metabolome, and their regulatory mechanisms—into a systems-level model of cell biology. The ostensible goal is to obtain a richly detailed, global understanding of the nervous system’s emergent properties through the interactions among all its constituent elements.125 In so doing, it promises to expand our insight into the root problems of complex diseases and transform the current predictive power of our diagnostic and therapeutic regimens.126
Transcriptomics
Evolving technologic innovations fostering miniaturization, increased scalability and efficiency, and decreased cost born from the Human Genome Project now exploit this wealth of genomic data. Gene expression profiling127,128 is the most widely used functional genomics technology due in equal parts to its early development and the ease with which it can be performed. High-density DNA microarrays anchor cDNA129 or oligonucleotides130,131 of different genes in massively parallel arrays of up to approximately 10,000 spots/cm2 and greater than 1,000,000 spots/cm2, respectively, on a glass surface. Using the principle of molecular hybridization, several micrograms of fluorescently labeled RNA or cDNA probes hybridize with the target DNA and are analyzed with high-resolution scanners that optically detect the strength of fluorescent signal from the bound probes. Raw data are normalized and processed through a series of statistical approaches to determine whether any gene is differentially expressed. The probes are constructed from abundant sources of high-integrity mRNA, which is reverse-transcribed in the presence of fluorophore-coupled deoxyribonucleoside triphosphates (dNTPs) or amino-allyl–labeled dNTPs that can be coupled to a fluorophore such as Cy3 or Cy5. In postmortem tissue, even with extended postmortem intervals of up to 30 hours, high-integrity mRNA can be isolated for microarray sample preparation. However, it is not the postmortem interval inasmuch as it is the pH of the tissue (great than 6.25) that determines mRNA integrity.132 Alternatively, when confronted with small amounts of starting material, it may be necessary to amplify the mRNA population so that there will be enough material to drive the hybridization reaction when labeled without skewing the complexity of the original mRNA population.16 Because exponential amplification techniques, such as PCR, do not offer this capability, a linear amplification technique, aRNA amplification, enzymatically converts the mRNA population into a single-stranded cDNA with reverse transcriptase by using a specialized oligo-dT primer containing a 3′ T7 RNA polymerase promoter sequence. When a complementary second strand is synthesized, it serves as a transcription template for T7 RNA polymerase to produce RNA oriented in the antisense direction, which can be labeled directly or converted into labeled cDNA as a probe. Amplification of mRNA by manual harvesting of individual live neurons128,133,134 or dendrites,135,136 as well as neurons in fixed tissue,137,138 has been equally as successful as automated approaches such as laser capture microdissection.139
Experimental artifacts can be introduced by sample preparation (e.g., differences in the integrity of mRNA or in the efficiency of labeling), the array (e.g., DNA spotting or printing errors), or processing (e.g., variable fluorescence scanner performance). Careful experimental design (e.g., checking the integrity of the mRNA before use, dye swaps and parallel processing of samples to control for labeling efficiency, quality control experiments for each lot of custom and commercial microarrays) can largely eliminate these issues. Reducing systemic biases in the results requires the optical data to be normalized at the global level to facilitate comparisons across microarray experiments and at the local level to account for individual variations in signal intensity that are unique to the surface of that microarray.140,141 Common approaches on how best to apply these normalization procedures to distribution of the data are available in the form of open source and open development software offered by the Bioconductor project. When analyzing data, the most conservative treatment of it uses a Bonferroni correction to reduce possible false-positive errors. However, this correction for multiple measurements can also lead to increases in the number of false-negative errors. Various data analysis software packages try to balance the discovery rates of these two types of errors. As with all high-throughput assays, these data should be verified with other techniques. Although the current generation of high-throughput, low-cost cDNA or oligonucleotide microarrays is the primary laboratory workhorse for quantifying the transcriptome, next-generation technology is already on the horizon (Box 3-3).
Box 3-3
Next-Generation Technology for mRNA Gene Expression
Sources of noise within the experiment can be controlled, in part, by the normalization techniques discussed earlier. However, there are several notable technical limitations of DNA microarrays at present: high background levels as the result of cross-hybridization by multiple targeting probes142 and low concordance (≈30% to 40%) of transcript detection between platforms.143–145 In the former circumstance, the probe will normally bind with high specificity to an arrayed target sequence. Off-target effects such as cross-hybridization occur when a flanking, unbound sequence of the same probe binds weakly to an adjacent arrayed sequence. The resulting background noise contributes to the relatively small dynamic range (≈2 orders of magnitude) of signal detection in microarrays, although in the latter circumstance the weak overlap in mRNA expression profiles across different microarray platforms is a consequence of unpredictable intramolecular folding events in some long probes146 and hybridization differences driven by the use of different sequences for the same target gene on various platforms. The cross-platform differences can be improved by using the RefSeq database for gene matching147 and still further when expression patterns are analyzed only when target sequences between platforms overlap.148
Next-generation technologies determine the identity of the mRNA transcript with the use of highly paralleled, direct sequencing methods.149 Although expensive at the moment, RNA sequencing (RNA-Seq) has several clear advantages over the current array-based methods, including low background noise, a large dynamic range (up to ≈3.5 orders of magnitude), and single–base pair resolution, which allows the ability to distinguish different isoforms (i.e., splice variants) and allelic expression (i.e., single nucleotide polymorphisms or structural variants, including insertion-deletions and copy number variations) of the same mRNA without subsequent need for any specialized normalization. Briefly, the total or poly A+ mRNA population is converted into a library of short, adaptor-modified cDNA (200 to 500 base pairs) that is compatible with deep-sequencing instrumentation. In the case of a population enriched in poly A+ mRNA, there are two general paths for processing. The poly A+ mRNA can be fragmented first, usually by hydrolysis or nebulization, and then ligated to adaptors and reverse-transcribed into cDNA. Conversely, the poly A+ mRNA can be ligated to the adaptor, reverse-transcribed into cDNA, and then fragmented with DNAse I or sonication. When fragmented at the RNA level, there is limited bias over the length of the transcript.150 However, fragmentation at the cDNA level greatly biases the readable sequence toward the 3′ end.151 Depending on the amount of input mRNA, amplification of the population may or may not be necessary. These libraries can generate millions of short reads that typically vary from 30 to 250 base pairs by 454, Solexa, or SOLid sequencing and can be compared against the genomic sequence or the coding sequencing of a gene.

Stay updated, free articles. Join our Telegram channel

Full access? Get Clinical Tree


