Monitoring and Staging Human Sleep

Chapter 141 Monitoring and Staging Human Sleep


Abstract


Polysomnography involves recording a wide assortment of bioparameters while a person sleeps. The electroencephalogram, electrooculogram, and skeletal muscle electromyogram can be summarized according to specific scoring criteria as sleep stages N1, N2, N3, and R (previously called stage 1, 2, 3, 4, and REM). Scoring criteria depend upon EEG bandwidth activity (delta, theta, alpha, and beta), EEG events (vertex sharp waves, sleep spindles, and K complexes), eye movement activity (slow and rapid eye movements), and the level of muscle tone. Stage N3 is characterized by high-voltage slow-wave activity. Stage N2 contains sleep spindles and K complexes. Stage N1 has low-voltage, mixed-frequency background, possibly slow eye movements, and vertex sharp waves. If rapid eye movements accompany the low-voltage, mixed-frequency EEG and skeletal muscle tone is low, rapid eye movement (REM or R) sleep is present. Central nervous system arousals also can occur from sleep, either spontaneously or resulting from pathophysiology. Quantitative analysis of sleep stages and CNS arousals provide evidence for, contribute to the definition of, and index the severity of some sleep disorders. Similarly, these measures can provide objective outcome measures for assessing therapeutic interventions. This chapter summarizes recording, digital processing, and scoring techniques used for evaluating brain activity during human sleep and its disturbance by CNS arousals.


History


From a behavioral perspective, immobility and reduced environmental responsiveness characterize human sleep. This state stands in contrast to purposeful (presumably) activities and provides the basis for dichotomizing observable living existence as either sleep or wakefulness. Furthermore, sleep and wakefulness cycle in a lawful, orderly fashion. Some rhythms are seasonal, some are daily (circadian), and some occur more than once a day. Changes in sleep cycle duration and composition in response to reduced sleep testify to sleep–wake cycle autoregulation, with a dynamic tension providing overall system homeostasis. Once techniques were developed to transcend observation, electroencephalography (EEG) revealed a complex array of brain activities clustered in a manner strongly suggesting multiple sleep states.


All scientific inquiry begins with observation and description. From there it proceeds to classification based ultimately upon measurement. Thus, when Loomis and colleagues1 electroencephalographically recorded their first continuous all-night studies, they faced the daunting task of devising a system to describe sleep patterns in normal healthy human subjects. Thus sleep staging was born. In the original studies, amplified activity derived from electrodes that were placed on the scalp’s surface at several loci produced ink tracings on paper wrapped around a slowly rotating cylinder. An enormous 8-ft “drum polygraph” enabled all-night sleep recording. One electrode was located near the eye and undoubtedly detected eye movement. However, rapid eye movement (REM) sleep remained unrecognized until Aserinsky published, in part, his University of Chicago doctoral study results 17 years later.2 Aserinsky actually christened them “jerky eye movements” (JEMs) and in the first paper referred to the phenomenon as periodic ocular motility.


Perhaps it was the quirkiness of the original commercially available polygraph systems (e.g., Ofner, Beckman, and Grass) with their tendency to polarize electrodes, problematic rechargeable car battery–like systems, and aperiodic (and difficult to predict) recording interference artifacts. Or perhaps it was Loomis’s silence on the matter of eye movements during sleep. In either case, Aserinsky’s pilot work reportedly met with considerable skepticism. Ultimately, however, REM sleep’s discovery, and particularly its correlation with dreaming, altered the course of sleep research for decades.2a The near-exclusive focus on REM sleep, to the point that all other sleep states were considered simply non-REM (NREM), overshadowed substantial findings (and likely impeded progress) in other sleep research arenas (e.g., neuroendocrinology, physiology, and medicine). The spotlight on REM sleep made electrooculographic (EOG) recording de rigueur when performing sleep studies.


Meanwhile, in Lyon, France, Michel Jouvet noted postural difference during sleep in cats.3 These differences correlated with sleep state and reduced skeletal electromyographic (EMG) activity. REM sleep (and, by association, dreaming) coincided with marked hypotonia in descending alpha and gamma motor neurons. The hypotonia induced functional paralysis that was quickly ascribed the purpose of keeping the sleeper from enacting dreamed activities. This sleep state–related EMG alteration added the final compulsory recording component to the procedure now known as polysomnography (PSG).


Polysomnography, in addition to brainwave, eye movement, and muscle tone recording, can also assess respiratory, cardiac, and limb movement activity (discussed in detail in other chapters in this volume and elsewhere3a). PSG in its simplest form (including EEG, EOG, and EMG), however, provides the basic information requisite for classifying sleep state and examining sleep processes.


Electrode Placement and Application


To make EEG, EOG, and EMG recordings, electrodes are placed on the scalp and skin surfaces. The site must be cleaned and properly prepared to assure good contact and limit electrical impedance to 5000 ohms or less. Scalp electrodes can be affixed with collodion or with electrode paste. Facial electrodes can be applied with double-sided adhesive electrode collars and paper tape. Although prescribed sites for electrode application have changed over the years, the system used to identify location remains the EEG society’s international 10-20 system. In this system, the intersection of lines drawn from the left to right preauricular point, with the midpoint along the scalp between the nasion and inion, serves to landmark the vertex, designated Cz. Other loci can be found by measuring 10% and 20% downward along longitudinal and lateral surfaces. Specific locations are designated with a letter indicating the brain area below the electrode (e.g., C for central lobe, O for occipital lobe, F for frontal lobe) and a number ascribing specific points (odd numbers for the left side, even numbers for the right, and z for midline). EEG electrode placements should be precise; consequently, appropriate measurement techniques must be applied to ensure accuracy. Additionally, EEG amplifiers require calibration at the beginning and end of PSG recording to allow actual waveform amplitude measurements.


The classic and amazingly long-lived standardized technique (i.e., the manual produced by the ad hoc committee chaired by Rechtshaffen and Kales) requires a single monopolar central-lobe scalp EEG electrode referenced to a contralateral mastoid electrode (either C3-M2 or C4-M1). This single-channel brainwave recording, when paired with right and left eye EOGs and submentalis EMG, sufficiently reveals brain, eye, and muscle activity for classifying sleep stages.4 As polysomnography evolved from a psychophysiologic research method to a clinical procedure, an occipital lead has supplemented centrally derived EEG to provide better visualization of waveforms needed to determine sleep onset and central nervous system (CNS) arousals.5,6


EOG recording capitalizes on the eyes’ cornea–retina potential difference. Strong positive corneal potential fields affect electrodes placed near the eyes’ right and left outer canthi. The recording traces the response to this positive charge moving toward or away from the recording site. Each electrode is referenced to a neutral site, typically over the mastoid behind the ear. Thus, lateral eye movements produce out-of-phase tracings for right and left EOG tracings as the cornea moves toward one electrode and away from the other (provided that two channels are dedicated to tracing eye movements). This arrangement makes eye movements easily differentiable from in-phase frontal lobe EEG activity that is also present when recording from these sites. To discern vertical eye movements, we place the right-side EOG electrode 1 cm above the outer cantus and the left-side electrode 1 cm below (or vice versa). An alternative recording montage devised to enhance vertical eye movement detection entails lowering both recording sites to 1 cm below the outer canthi and referencing each to the middle of the forehead (Fpz).


Skeletal muscle activity level is estimated from a pair of electrodes arranged to record submentalis EMG. An electrode placed midline but 1 cm above the mandible’s inferior edge is referenced to another placed 2 cm below and 2 cm to the right (or left). As a precaution, a backup electrode is also attached at the laterally homologous site of the reference electrode. The resulting submentalis EMG recording serves qualitatively (because it is uncalibratable) to provide an overall estimate for muscle activity level.


The American Academy of Sleep Medicine (AASM) has published a standardized manual for conducting clinical polysomnography in their accredited sleep disorders centers.7 This AASM standards manual makes recommendations for recording, scoring, and summarizing sleep stages, CNS arousals, breathing, various kinds of movement, and electrocardiographic activity. By bringing instructional guidelines for a range of techniques into a single volume, the AASM manual will strongly influence practice, particularly in North America. Researchers, however, should not feel constrained by these clinical guidelines. New discoveries and future techniques need to continue unshackled by even a de facto standard clinical practice cookbook.


AASM specifies recording frontal, central, and occipital monopolar EEG from F4, C4, and O2. The contralateral mastoid (M1) serves as the theoretically neutral reference. Electrodes are placed at F3, C3, and O1 sites (and referenced to M2) to provide redundancy for backup when needed. The AASM manual sanctions the use of midline bipolar recordings for frontal and occipital EEG; however, the AASM frequently asked questions (FAQ) states that frontal bipolar derivations are not appropriate for measuring frontal EEG activity. The FAQ also states that EEG amplitudes can be measured from the C4-M1 derivation. The AASM manual recommends using mastoid-referenced EOG with separate channels for E2 and E1, but it also approves a forehead-referenced alternative montage. Submentalis EMG is recorded in the traditional manner.


Digital Recording Requirements


The first time a polysomnographic signal was digitized, whether it originated from analogue or digital amplifying circuits, an entirely new set of factors required consideration. The two most important questions to resolve involved specifying amplitude and temporal resolution. Selection of voltage per digital unit (bit) and sampling rate likely had more to do with computer hardware limitations than conceptual considerations. Amazingly, no standard was established for digital polysomnography until publication of the AASM standards manual.


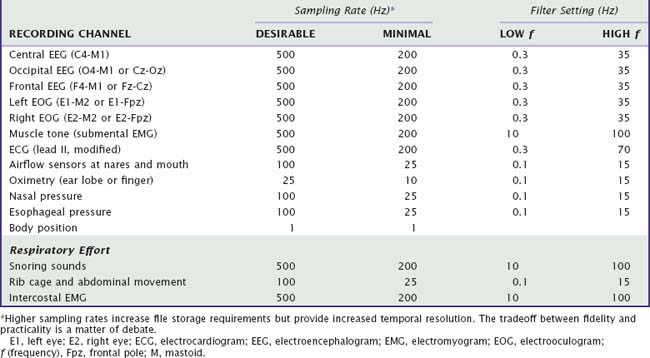
The AASM standards manual specifies minimum 12-bit representation for amplitude, providing 4096 units to represent a 2.5-volt regulated current (IREG) range, or its equivalent (Video 141-1image). In this manner, even the smallest signals, exceeding the level of electrical noise, can be detected. Temporal resolution during recording depends on sampling rate and ultimately must allow accurate waveform reconstruction, provide enough data to potentially overcome frequency aliasing, and be appropriate for high- and low-pass digital filter settings. One size does not fit all: The minimum temporal resolution needed during data acquisition to meet these requirements varies for different bioelectrical signals (Table 141-1).


Additional digital specifications involve data selection, display pagination, and calibration. Recorded channels must be selectable, and their calibration must be displayable. The viewable data should provide user-selectable time-frame compression and expansion (ranging from 5 seconds to an entire night shown on a page). Display screens definition should be at least 1600 × 1200 pixels. Digital polysomnographs should provide the capability to view data as it appeared when it was first recorded and when staging or when each event was marked and classified manually. Accompanying video at a minimum of one frame per second should be synchronized with the polysomnographic display.


Eeg Bandwidths, Waveforms, and Other Activity


Stay updated, free articles. Join our Telegram channel

Mar 13, 2017 | Posted by in NEUROLOGY | Comments Off on Monitoring and Staging Human Sleep

Full access? Get Clinical Tree

Get Clinical Tree app for offline access