Fig. 1
Infusion system setup: This schematic representation demonstrates all of the components in the infusion system. Starting with a 5 mL syringe (1) mounted onto an infusion pump (2), a secondary non-sterile line primed with sterile saline and appropriate connectors at the distal end (3), followed by a sterile loading line containing the infusate (AAV + Gd) with connectors at each end of the line (4) and terminating at a sterile infusion cannula (5). Note illustrations are not up to scale
3.4 Secondary Line Setup
1.
Start with the non-sterile secondary line, which is connected to a 5 mL syringe mounted on the infusion pump.
2.
Measure the distance from the pump to the MRI bore and the approximate the distance of the loading line from the cannula.
3.
Cut the Teflon tubing (1.57 mm outer diameter, 0.76 mm inner diameter) to the desired distance.
4.
Add Tefzel ferrule connectors and Luer-Lock adapters to both ends of the tubing.
5.
Fill the tubing with sterile saline using a 50 mL syringe.
6.
Fill a 5 mL syringe with saline, attach to the secondary line and mount the syringe directly onto the pump.
7.
Check for leaks before use and ensure that there are no air bubbles in the system.
8.
Begin setting up the loading line.
3.5 Loading Line Setup
1.
Create a sterile field and layout the sterile materials.
2.
Place the infusion cannula onto the sterile field, attach it to a 5 mL syringe on the proximal end, flush with sterile saline and check for patency.
3.
Add connectors to each end of the loading line.
4.
Prime the loading line with sterile saline prior to loading the infusate (i.e., AAV mixed with MRI tracer).
5.
Load the infusate into the sterile line and connect to the proximal end of the cannula.
6.
Continue pushing the infusate until the cannula is filled.
8.
Connect the secondary line to the loading line and cannula.
9.
Check for leaks in the entire system.
10.
Transfer the system to the MRI bore and introduce the cannula through an identified aperture on the infusion port.
3.6 MRI Protocol
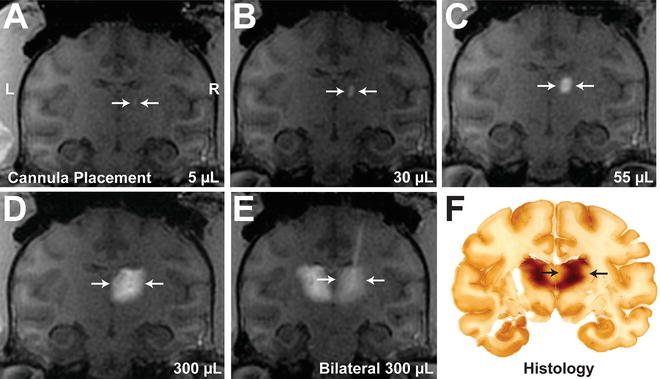
The MRI parameters are specific to visualizing the Gadoteridol contrast agent during infusion (Fig. 2). Note that this protocol has been written for use in at 1.5 T Signa LX scanner and should be modified when using different types of scanners, coils, and hardware.


Fig. 2
Real-time MRI infusion into the nonhuman primate thalamus and comparative histology section: Infusion of AAV2-GDNF /Gd visualized as a contrast demarcation on the MR images indicates placement of the cannula tip within the thalamus (a; right side; white arrow). As the infusate volume increases during the procedure, the size of the demarcation continues to grow until reaching 300 μL (b–d). Note that this was a bilateral infusion completed sequentially and the infusate was visualized in the contralateral side (e). A matching histology section processed 5 weeks after infusion demonstrates expression of the infused transgene, closely representing original MRI observations (f; black arrows). AAV2 adeno-associated virus , GDNF glial-derived neurotrophic factor, Gd gadoteridol (MRI tracer)
1.
Start with a 3D high-resolution MP-RAGE (magnetization prepared-rapid acquisition gradient echo) scan (for additional parameters, see Note 13 ).
2.
Continue with T2-weighted images to determine trajectory of the cannula from the top of the port (see Note 14 ).
3.
Advance the lancet rod through the selected aperture and penetrate the dura without damaging the cortical surface.
4.
Using a sterile ruler, measure the desired depth on the cannula and place a mark. Slide a depth stopper over the tip of the cannula and secure it to the desired length.
5.
Insert the cannula through the opening in the dura and advance to the desired depth.
6.
Monitor vital signs during cannula insertion.
7.
Begin T1-weighted image acquisition with a spoiled GRASS (gradient recalled acquisition in stead state) sequence.
8.
Set the slice thickness to 1 mm and determine the number of slices to visualize the ROI. Depending on the number of slices, the scanning time should be range between 9 and 12 min.
3.7 Infusion Protocol
2.
Calculate the total amount of infusate required to fill the dead space in the lines, connectors, cannulae, and the dose volume.
3.
Start the pump at 0.5 μL/min and ensure that infusate exits the tip of the catheter prior to insertion into the selected aperture.
4.
After the catheter is advanced to the target site, set the total volume delivered on the pump to zero. Document the start time and keep track of the infusion time by using a stopwatch timer.
5.
Acquire baseline T1- and T2-weighted images to ensure accuracy of cannula penetration to reach the target structure.
6.
Once the infusate is visualized in the MR images, the rate can be progressively increased at 0.5 increments to 1.0, 1.5, 2.0, 2.5, 3.0, 3.5, 4.0, 4.5, and 5.0 μL/min (see Note 15 ).
7.
Continue scanning during the infusion procedure.
8.
Monitor MR images to ensure infusate is confined within the ROI.
3.8 Calculating Volume of Distribution Versus Volume Infused
Linearity between the volume of distribution (Vd) versus volume infused (Vi) is a determining factor on how well an infusion was performed. This type of analysis is conducted after the infusion procedure using open-source OsiriX software and involves manually tracing the ROI on each slice. The software uses an automated calculation feature to determine the ROI volume.
1.


Upload DICOM (Digital Imaging and Communications in Medicine)-formatted MR images to a software capable of performing 3D reconstructions and volumetric analysis, such as OsiriX®.
Stay updated, free articles. Join our Telegram channel

Full access? Get Clinical Tree


