Figure 3.1. Pressure/volume curve.
Compliance should be evaluated together with ICP. There are two methods to obtain it, both of which are invasive and potentially related to risks (infections, herniation, bleeding):
- Intracranial pressure “reserve” test.
- Pression-volume index (PVI).
The intracranial pressure “reserve” test entails observing the variation in ICP while adding or removing 1 ml of fluids (saline solution of CSF). It’s considered normal when the injection of 1 ml induces an increase of ICP ≤2 mmHg or when the ICP decreases with draining of 1 ml of CSF.
The pressure-volume index represents the quantity of intraventricular fluid that has to be injected to produce an ICP increase of 10 mmHg. Usually, it is equal to 25 ml. A value <10 ml indicates severely compromised compliance.
3.7 Intracranial Pressure Curve
The arterial waves hit the choroid plexus, thus generating intracranial pressure waves which are also influenced by pulsations originating from the great intracranial arteries and in a retrograde form by the venous system. The wave’s components can be analysed obtain an approximately measure of the state of compliance.
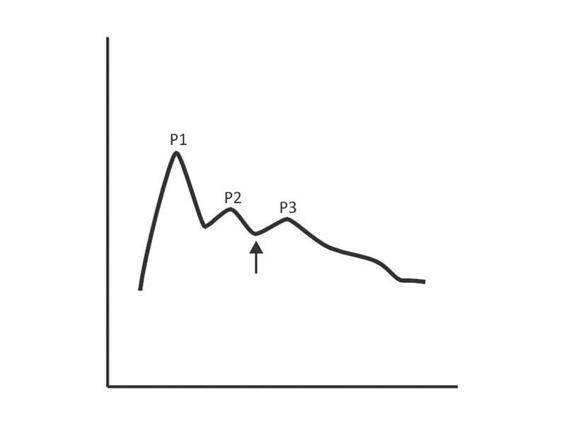
The normal ICP wave has three well-defined and universally present peaks (Figure 3.2). The first reflects the arterial input, while the two others reflect venous input. The first is called the percussion wave (P1), which is well defined and wide. The second peak is P2, also known as tidal wave, and has a variable width. Finally comes the third peak (P3), often termed the dicrotic wave.

Figure 3.2. Intracranial pressure waves.
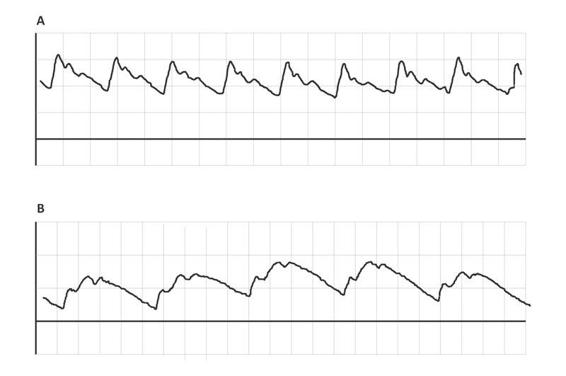
As a general rule, as ICP rises, the described wave morphology changes, adopting a pyramidal shape with gradual disappearance of P1, P3 and marked rise of P2. Sometimes the ICP does not raise its absolute value but if it changes shape. If P2 is greater than or equal to P1, even with ICP values considered normal, the compliance is decreased (Figure 3.3).
In conclusion, the analysis of the ICP wave is a tool of great value to the investigation of altered states of compliance prior to dangerous increases in ICP.

Figure 3.3. Two patients with the same absolute ICP value (6 mmHg). (A) P1>P2>P3 indicates normal compliance. (B) P2>P1 indicates altered compliance.
3.8 Cerebral Oxygen Metabolism
From a metabolic point of view, the brain is one of the most active and voracious organs of the human body. Although it does not perform mechanical work like skeletal or cardiac muscle, nor does it have complex enzymatic systems like the liver, it consumes 20% of total oxygen consumption.
The cerebral consumption of oxygen in a healthy and conscious individual is around 3.5 ml/100 g of tissue/min. Given that the brain weighs 1400 g on average, the total oxygen consumption is 49 ml/min. Consumption is maintained throughout a 24-hour period, even during sleep. Not all the oxygen provided is consumed, normally is extracted one-fifth to one-third that of the oxygen delivered. This difference underscores the great reserve capacity of the brain.
Oxygen is almost entirely used up in the mitochondrial oxidation of glucose to generate high energy phosphates. For each mol of oxygen, an equal amount of CO2 is consumed, yielding a respiratory quotient of 1. The generated energy goes into maintaining the ion transmembrane gradients; therefore, the consumption of cerebral oxygen depends on cerebral activity. It has been estimated that 75% of the ATP produced is used to recover and maintain membrane potentials that take part in nervous impulse excitation and conduction. The remaining oxygen is used in several chemical reactions for the synthesis and metabolism of neurotransmitters, such as dopamine, serotonin and monoamines.
The gold standard for the measurement of cerebral metabolic rate of oxygen (CMRO2) is positron emission tomography (PET), but in clinical practice it is calculated from the product of cerebral blood flow (CBF) the arterio-venous difference of oxygen (AVDO2), according to the following formula:
CMRO2 = CBF x OEF
Though the brain does not store oxygen, it has a great need of oxygen and therefore requires its continuous supply. The availability of cerebral oxygen depends basically on two factors: the arterial content of oxygen (CaO2) and the CBF.
3.9 Cerebral Blood Flow (CBF)
The average CBF in a healthy adult is about 55 ml of blood per 100 g of brain tissue per minute, or about 800 ml/min, corresponding to approximately 15% of the total basal cardiac output. To function adequately, the brain requires a CBF of about 54 ml/100 g brain tissue per minute. And because CBF depends on metabolic activity, CBF is greater in the gray matter (78 ml/100 g/min) than in the white matter (18 ml/100 g/min).
According to the Hagen-Poiseuille equation, the rate of laminar flow through a blood vessel is directly proportional to the existing pressure difference between the entrance and exit of the circuit (∆P) and the diameter of the vessel (r), and inversely proportional to the viscosity of the circulating fluid (n).
∆P x r4
Flow = (∆P x r4) / (8 x n x l)
Under physiological conditions, the pressure gradient and the blood vessel diameter are the main determinants of CBF. The pressure gradient is obtained by calculating the difference between the mean arterial pressure (MAP) and the venous pressure; this is called the cerebral perfusion pressure (CPP). Because venous pressure is difficult to measure, ICP is measured instead. Accordingly, the CPP is obtained by calculating the difference between MAP and ICP as follows:
CPP = MAP – ICP
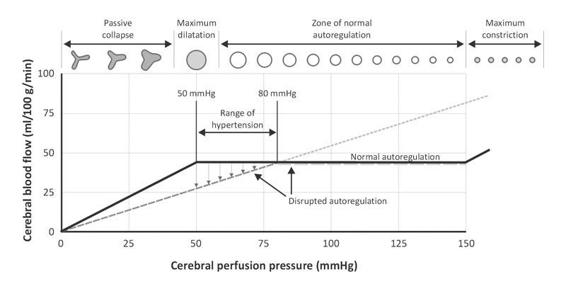
The cerebral blood vessels have the intrinsic capacity to maintain CBF constant, despite wide CPP fluctuations, in a range between 50 and 150 mmHg. This physiological property is called cerebral autoregulation.
Autoregulation of cerebral blood flow originates from the resistance of the arterioles which adapt their diameter in relation to different stimuli, thus determining cerebrovascular resistance (CVR). When the CPP increases to above 50 mmHg, the arterioles begin to contract, and the CVR increases in order to maintain CBF constant. By contrast, when the CPP decreases, the CVR decreases due to vasodilatation (Figure 3.4).

Figure 3.4. Cerebral autoregulation curve.
Under pathological conditions, the autoregulatory mechanism can be disrupted. When this happens, CBF passively follows CPP. This means that when MAP decreases, CBF decreases, and when MAP increases, CBF increases.
Thus, CBF is regulated by the control of the cerebral arteriolar tone, which is primarily modulated by CPP, in addition to other local factors such as paCO2, paO2, and pH. High CO2 levels, acidosis and tissue hypoxia, and products of metabolic activity dilate the cerebral blood vessels and increase CBF. For this reason, the rate of formation of such products depends on the metabolic rate.
The metabolites that act in the regulation of the CBF are:
- CO2: cerebral blood vessels are extremely sensitive to variations in CO2 levels. This effect is related to the tissue pH values. As CO2 levels increase, an acidic environment is created in the CSF, leading to arterial dilatation which, in turn, increases CBF.
- Potassium: a rise in perivascular potassium is a powerful stimulus to vasodilatation, as occurs, for example, in seizures or situations that cause tissue hypoxia.
- Adenosine: results from the degradation of ATP; it is a powerful vasodilator with prolonged action. Adenosine production is directly proportional to the degree and duration of tissue hypoxia.
- Nitric oxide: the cerebral vascular endothelium can express three types of enzymes called nitric oxide synthases which actively take part in CBF regulation and the transmission of impulses between neurons. It is frequently present in the prolongations of the astrocytes that form the synapses.
- Prostaglandins: another group of endogenous local acting autacoids. E2 prostaglandin and prostacyclins are both vasodilators. Experimental animal studies have demonstrated high levels of prostaglandins in CSF during arterial hypotension.
As mentioned, the brain needs a constant supply of oxygen. Oxygen transport from the air to the cerebral mitochondria depends on the correct functioning and integration of three systems: 1) respiratory; 2) circulatory; 3) hematologic.
Oxygen transport or availability (TO2) to the brain is determined by the CBF and the arterial oxygen content (CaO2). This depends on the main carrier: hemoglobin. Analyzing this protein, we will see that not only is its concentration important, but also its affinity for oxygen and capacity to transport it. Both properties are estimated by oxygen saturation and the oxygen-hemoglobin dissociation curve.
TO2 = CBF x CaO2
CaO2 = (Hgb x 1.34 x SaO2) + (paO2 x 0.003)
Oxygen circulates from the atmosphere to the mitochondria by simple diffusion across concentration gradients. After crossing the alveolus-capillary barrier in the lungs, 95% of oxygen reversibly binds to hemoglobin (Hgb), which is the main carrier of oxygen. The capacity to transport oxygen depends on the concentration of Hgb, which normally is around 15 g/100 ml of blood. Each gram of Hgb can transport 1.34 ml of oxygen.
The relationship between the carrying capacity and the amount really is transported in a given moment is referred to as arterial oxygen saturation. Its normal value is 97%.
The affinity of oxygen for Hgb is expressed by analysing the oxygen-hemoglobin dissociation curve. Its sigmoidal shape is unique: Hgb can bind to oxygen at the pulmonary level, transport it and then yield it to the cells in the capillary bed. Hemoglobin’s affinity for oxygen is expressed by P50. P50 is the PO2 corresponding to 50% saturation of Hgb. The normal value is 27 mmHg. If the P50 increases, the oxyhemoglobin dissociation curve shifts to the right.
An increased P50 indicates a rightward shift of the standard curve. This indicates a decreased affinity. In this case, the efficiency of oxygen delivery to the tissues is facilitated, as happens with an increase in body temperature, hydrogen ions, carbon dioxide or local acidosis oconcentration (the Bohr effect).
Thanks to this mechanism, the brain consumes only 33% of oxygen (cerebral oxygen extraction) and paO2 decreases from 95 to 35 mmHg in the venous end of the capillary. Conversely, a lower P50 indicates a leftward shift and a higher affinity. A left shift of the curve is a sign of hemoglobin’s increased affinity for oxygen (e.g., at the lungs). Similarly, a right shift reflects a decreased affinity.
Dissolved oxygen (paO2) plays a secondary role in the global transport of oxygen. In order to calculate the arteriovenous oxygen difference, we need to know the oxygen content of mixed venous blood, which can be obtained with the following equation:
CvO2 = (Hgb x 1.34 x SvO2) + (pvO2 X 0.003)
Returning to equation 1, if:
CMRO2 = CBF x Da-vO2
then:
Da-vO2 = TMCO2 / CBF
Ordinarily, the arteriovenous oxygen difference remains stable and equal to 4-8 ml O2 for each 100 ml of blood. If oxygen consumption remains stable, changes in Da-vO2 will reflect changes in CBF. So, if Da-vO2 <4, CBF exceeds the cerebral demand; this phenomenon is called hyperemia. Conversely, if Da-vO2 >8, this means that the oxygen supply to the brain has fallen below the demand, and this is what happens during ischemia.
3.10 Oxygen Tissue Pressure (ptiO2)
Under normal conditions, there is a direct linear correlation between paO2 and oxygen tissue pressure (ptiO2). Since oxygen is consumed in the cells, ptiO2 varies widely, from 90-95 mmHg in the capillaries to 30-35 mmHg in the venous district. Critical ptiO2 in the brain is between 15 and 20 mmHg; nevertheless, the neuronal mitochondria require only 1.5 mmHg to maintain aerobic metabolism.
The reader is referred to the chapter on tissue oxygenation monitoring for a more detailed discussion of this topic.
3.11 Cerebral Glucose Metabolism
The brain has an enormous demand for energy. To meet this need, it requires a continuous and suitable supply of its two main nutrients: oxygen and glucose. Glucose is the basic fuel. Although the human brain accounts for only 2% of total body weight, it consumes 25% of total body glucose utilization. Only uses 10% of what is supplied.
Cerebral metabolic consumption of glucose is 5 ml per 100 g of cerebral parenchyma per minute, equal to 140 g/day.
There is a linear correlation between plasma and brain glucose concentration. The cerebral concentration is about 30% of the plasma concentration, depending on variations in blood levels. Since glucose does not readily cross the BBB, it requires a transport system. This system is formed by a family of specific, highly regulated proteins collectively referred to as glucose transporters (GLUT).
Several types are distinguished: GLUT 1 transports glucose to the endothelial cells, glial cells, and astrocytes; and GLUT 3 regulates glucose entry into the neurons. Both transport systems can increase their activity during neuronal activation to optimize glucose transport according to the supply needed.
Cerebral glucose consumption depends directly on brain activity and a sufficient supply of blood and oxygen. Since the brain lacks energy reserves, the small deposits of glycogen available mainly in the astrocytes are exhausted within about 2 minutes.
In certain circumstances, lactate and pyruvate formed during glucose metabolism can maintain neuronal activity. Nevertheless, neither crosses the BBB easily nor has specific carriers, and so cannot replace glucose as an energetic substrate in physiological situations. In some pathological states such as malnutrition or diabetes, blood ketone levels, such as acetoacetate and D-3-hydroxybutyrate in particular, are extremely high, and can be used by the brain as metabolic substrates.
Besides being the brain’s primary energy source, glucose plays a major role in many other processes essential for cerebral cellular activity, including:
Stay updated, free articles. Join our Telegram channel

Full access? Get Clinical Tree


