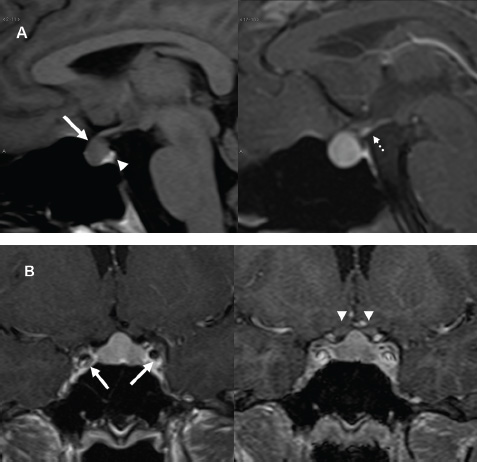
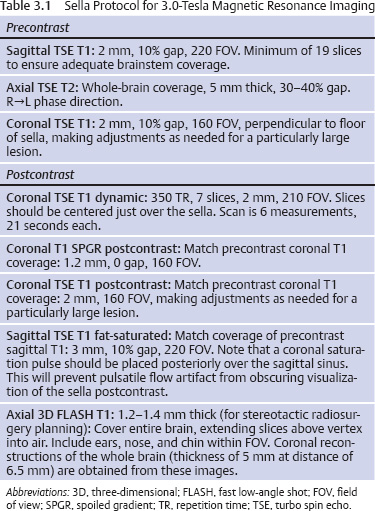
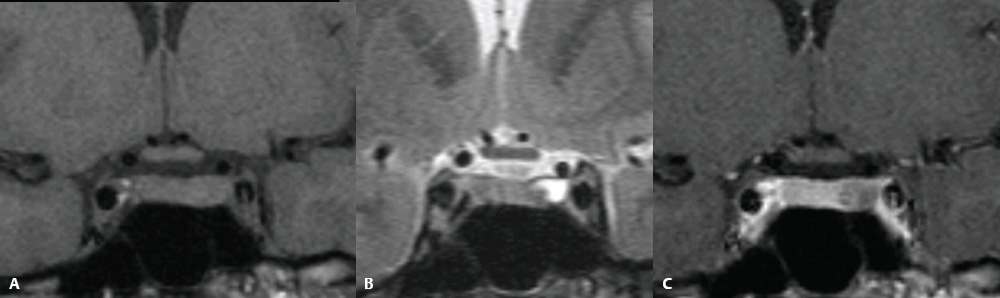
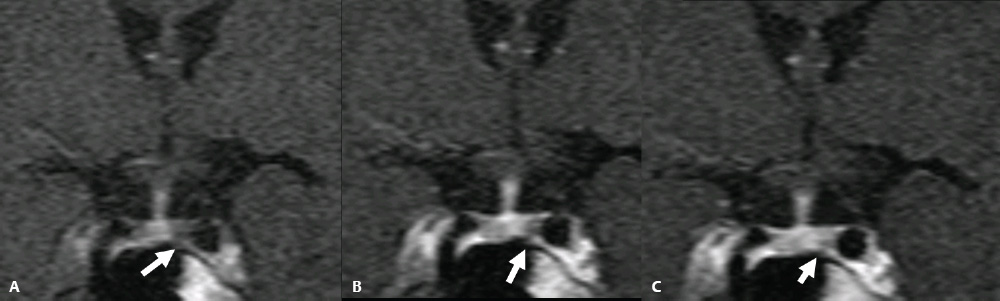
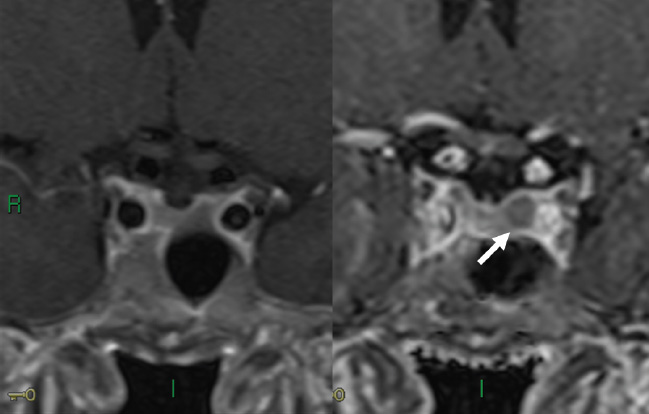
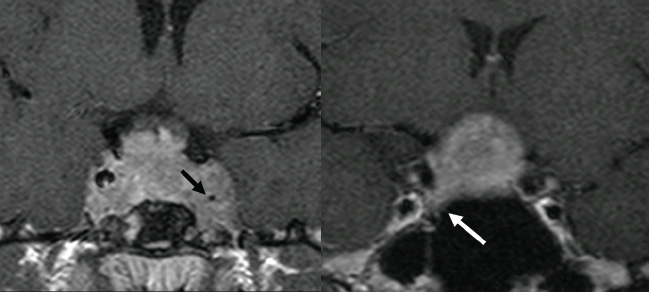
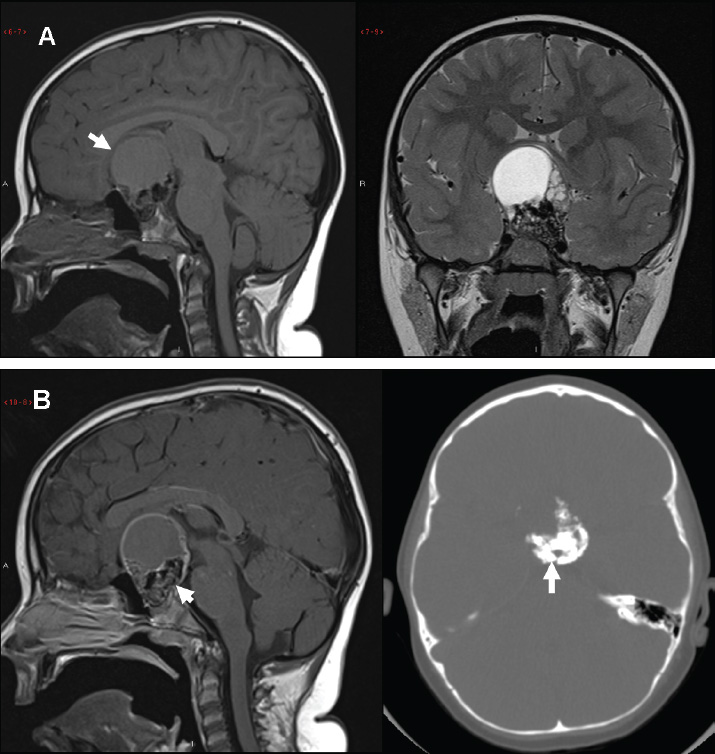
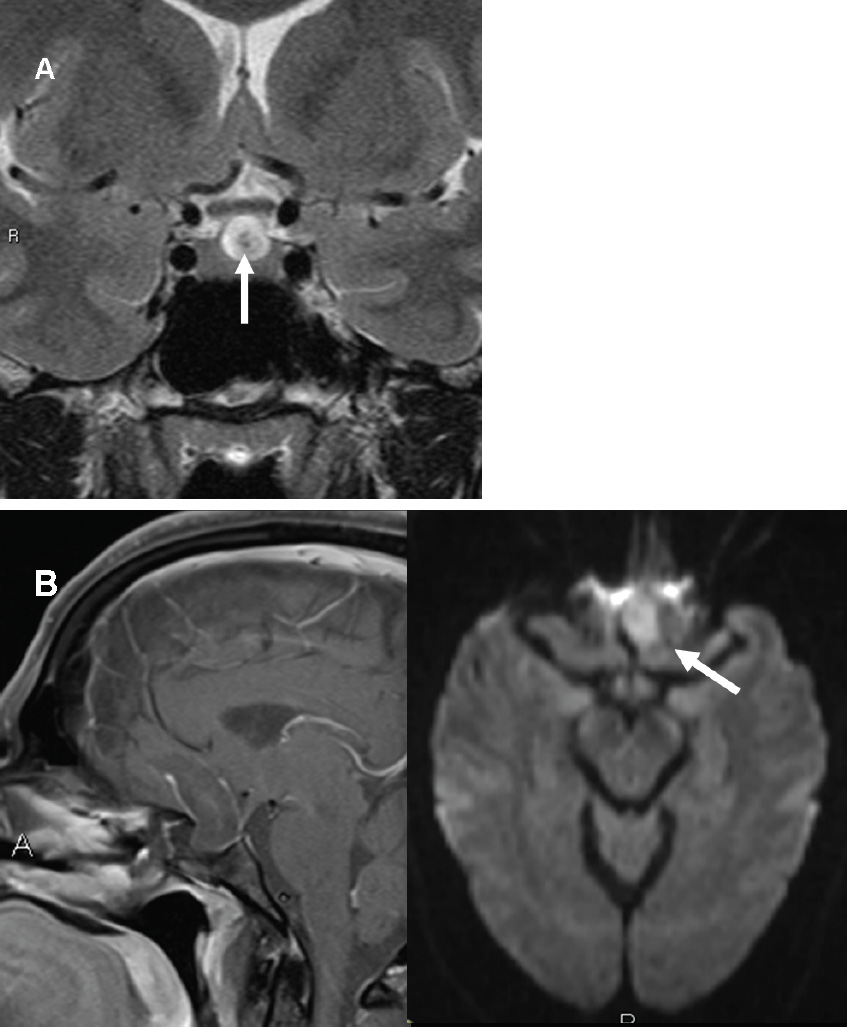
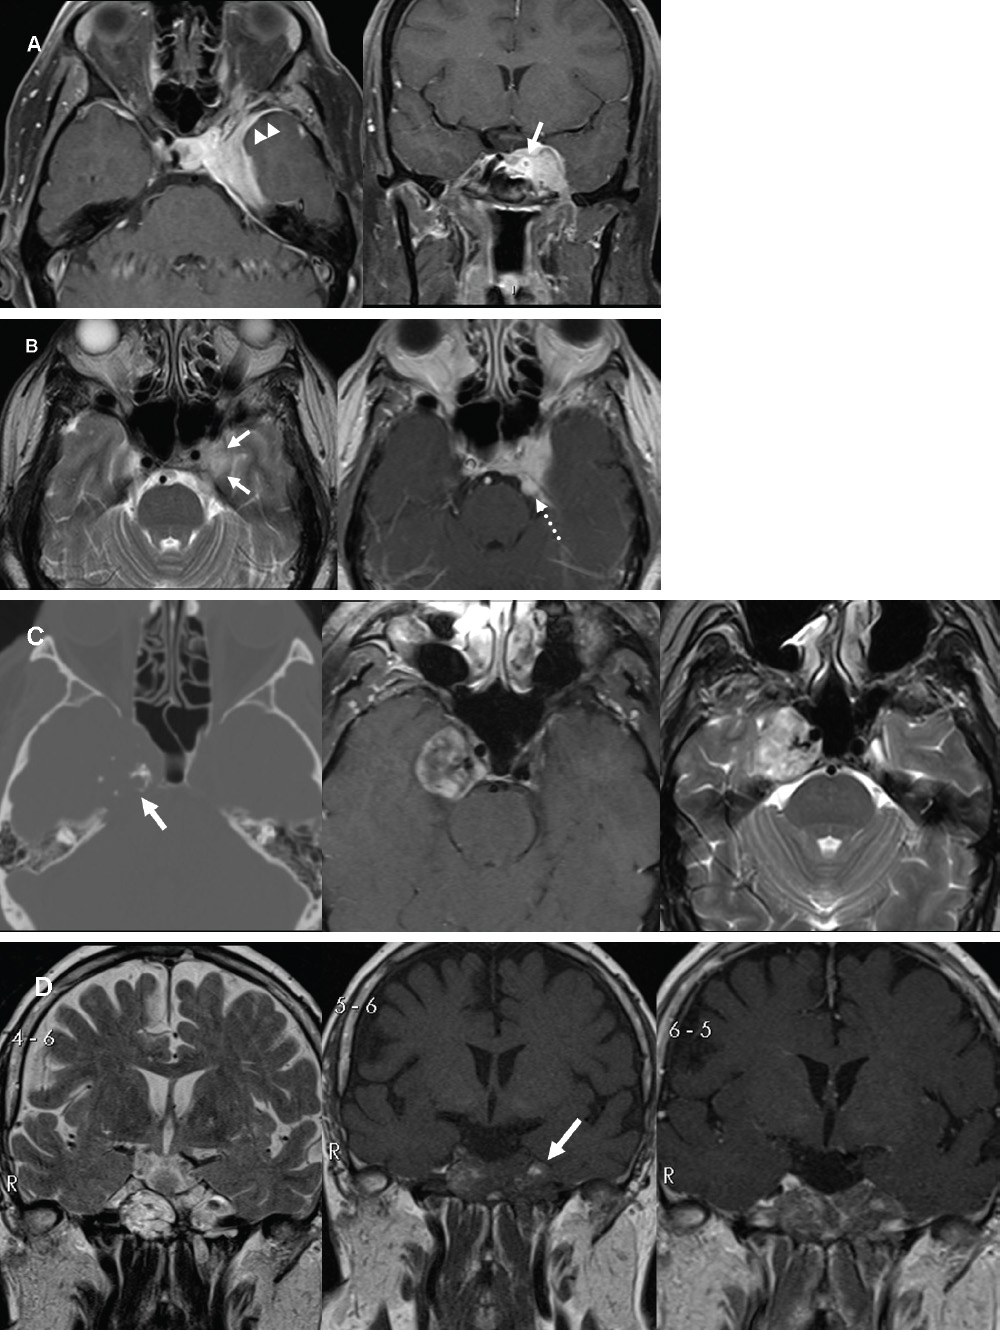
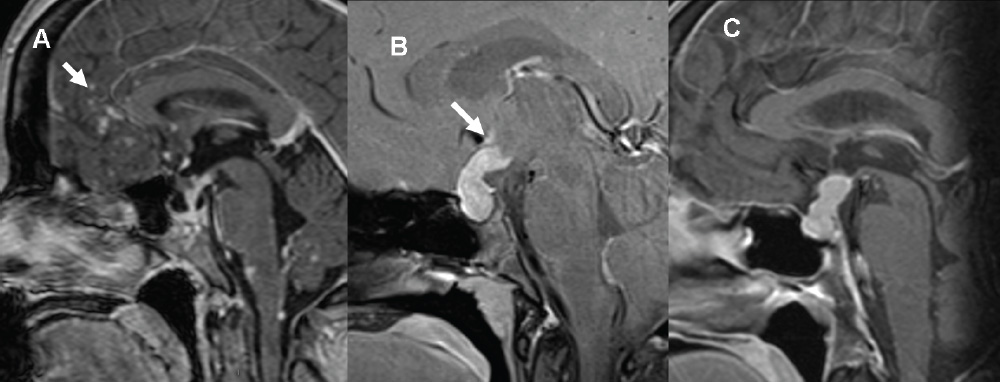
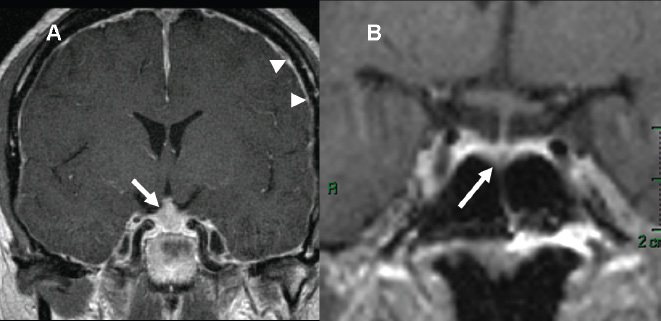
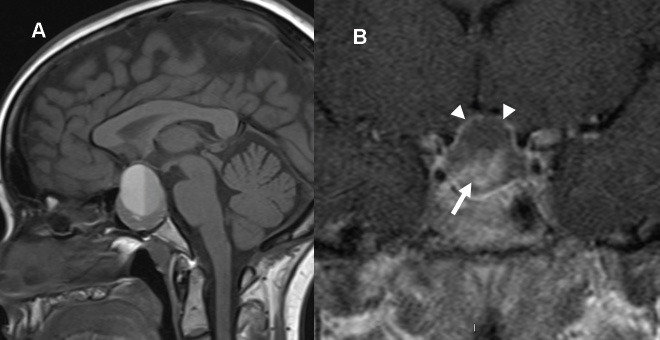
3 Radiologic Evaluation and Diagnosis for Pathology in the Sellar and Parasellar Region The complex anatomy of the sella turcica and parasellar skull base lends itself to the occurrence of a diverse array of pathologic processes. Imaging plays a key role in the diagnosis and mapping of the anatomic extent of these lesions. This chapter focuses primarily on the imaging of pituitary glandular neoplasms and nonvascular parasellar processes that are amenable to surgical or radiation treatment Modern imaging of central skull base pathology is almost entirely performed with magnetic resonance imaging (MRI). Computed tomography (CT) may be useful in conjunction with MRI when evaluation of the osseous anatomy is of importance. CT is performed at our institution only when a contraindication to MRI exists. When information about the integrity of the sellar floor or the presence of intralesional calcification is desired, CT offers excellent visualization of such detail.1 CT images acquired at a thickness of 0.625 mm after the administration of intravenous (i.v.) contrast enable the depiction of most macroadenomas; however, MR remains superior to CT in characterizing lesional morphology and establishing its extent.2 All MR examinations of the skull base at our institution are performed after the administration of i.v. contrast unless there are contraindications to the use of gadolinium-based agents, such as significant renal impairment or pregnancy.3 It is possible, however, to detect microadenomas on unenhanced images, especially when narrow window settings are used (Fig. 3.1). Such a strategy may be useful in those situations in which contrast cannot be administered. Most microadenomas are best revealed on postcontrast images when thin (3-mm) coronal and sagittal T1-weighted sections are employed. The addition of fat saturation pulses and use of a volumetric spoiled gradient (SPGR) acquisition may also be beneficial.4 We have found the latter sequence to be especially useful in a setting of Cushing disease. When conventional contrast-enhanced MRI fails to depict a microadenoma and clinical suspicion is strong, a dynamic study with rapid acquisition of a set of coronal T1-weighted images (T1WIs) after administration of a bolus of contrast may be helpful. Typical scanning times for a set of such images through the sella on most modern scanners are on the order of 10 to 12 seconds. On such sequences, the gland is seen to exhibit a characteristic pattern of centrifugal enhancement, with the stalk and the site of its insertion enhancing first. Kucharczyk et al,5 using a dynamic keyhole MR technique, reported an increased sensitivity for adenoma detection compared with conventional MRI. Tabarin et al,6 however, warn of the false-positive interpretations that may occur with this technique if the pattern of glandular enhancement is not well understood. Other novel MR techniques that may be used to study the pituitary gland include diffusion-weighted imaging (DWI) and MR spectroscopy. Pierallini et al7 suggested that adenomas may be classified into soft and hard groups based on their apparent diffusion coefficient values obtained by DWI. This information may be of surgical importance and help determine if suction or fragmentation and curettage are required for an adenoma to be removed. Stadlbauer et al8 in a study of 37 patients with pituitary adenomas concluded that MR spectroscopy may provide insights that can help predict proliferative potential and detect the presence of intratumoral hemorrhage. These techniques, however, are difficult to implement in routine practice and may be limited by artifacts that arise from the osseous skull base and air in the sinus cavities. Heavily T2-weighted volumetric sequences are often used in skull base imaging and provide exquisite depiction of cranial nerve anatomy. When radiosurgery is considered, MR scans at our institution are performed with a contrast-enhanced volumetric T1-weighted sequence to enable accurate registration. The addition of fat saturation, we have observed, greatly increases target conspicuity. A typical MRI protocol for the sella/skull base at our institution is presented in Table 3.1. Inferior petrosal sinus sampling (IPSS) is performed when noninvasive studies fail to depict an adenoma whose presence is strongly suspected clinically. Complication rates are less than 1% with this procedure. It is a sensitive and specific test for accurately diagnosing Cushing disease and differentiating it from ectopic ACTH (adrenocorticotropic hormone) syndrome.9 It is important to be aware of the age-dependent variability in the contour and size of the pituitary gland when MR examinations are interpreted. Elster’s rule that the pituitary gland measures 6 mm in height in infants and children, 8 mm in men and postmenopausal women, 10 mm in women of childbearing age, and 12 mm in pregnant and postpartum women is useful to keep in mind.10 The adenohypophysis is isointense to brain parenchyma on all sequences, whereas the neurohypophysis demonstrates a characteristic hyperintensity on T1-weighted imaging (Fig. 3.1). The neonatal adenohypophysis, possibly because of lactotrope hyperplasia, can be hyperintense on T1WI. The precise reason for the neurohypophyseal hyperintensity is unknown, but it is possibly due to the presence of neurophysin, a vasopressin-associated carrier protein. Absence of this bright spot may be seen with central diabetes insipidus but is a normal finding in a small percentage of the population. Any cause of stalk interruption may result in the bright spot occupying an “ectopic” position proximally in the stalk or in the hypothalamus.11 The normal pituitary stalk does not exceed 4 mm in thickness and demonstrates a smoothly tapered insertion into the gland. It enhances fairly homogeneously. The optic chiasm, which is isointense to white matter on all sequences, is best evaluated on the coronal images. The cavernous sinuses are visualized as paired parasellar structures that enhance heterogeneously. Their lateral, thicker dural walls are consistently seen, whereas depiction of the more gracile medial wall is more problematic. The cavernous internal carotid arteries are more easily visible as paired flow voids on spin-echo images and demonstrate flow-related enhancement on SPGR images. The cranial nerves in the lateral walls of the cavernous sinuses are inconstantly seen. The demonstration of the cisternal segments of these nerves is easily achieved by using volumetric, heavily T2-weighted sequences. The skull base foramina in the middle cranial fossa are best seen on thin-section CT, ideally when bone reconstruction algorithms are used. Close scrutiny of unenhanced coronal images may reveal the presence of an adenoma, especially if narrow window settings are used. The majority of microadenomas are isointense to hypointense with respect to the remainder of the gland on T1WI. The presence of T1 hyperintensity may indicate hemorrhage. The signal intensity on T2WI is more variable. No definite characteristics exist that enable one to differentiate between the different types of adenoma. It has been suggested that adenomas producing ACTH, thyroid-stimulating hormone (TSH), or follicle-stimulating hormone/luteinizing hormone (FSH/LH) have a tendency to occur in the central gland, whereas prolactinomas and gonadotropic hormone (GH)–producing adenomas prefer the glandular periphery. It has also been proposed that densely granulated GH adenomas have a propensity for infrasellar extension, possibly owing to a tendency to thicken the diaphragma and cause osteopenia of the sellar floor, and perhaps owing to a sellaenlarging effect of growth hormone itself.12 The presence of a microadenoma may be inferred on the basis of a glandular contour deformity, focal remodeling of the sellar floor, or stalk deviation. The latter is an overrated sign and may be encountered in the normal population. The stalk may even be deviated toward an adenoma.13 It must also be remembered that a convex superior glandular contour may be normal in women of reproductive age and in the peripartum period. Most microadenomas enhance to a lesser degree than normal gland (Fig. 3.2). They are best identified on coronal postcontrast T1WIs and SPGR images. The latter are often useful in detecting small ACTH-producing adenomas4 (Fig. 3.3), but one must be aware of the slightly higher false-positive rate with this sequence because the gland tends to enhance more inhomogeneously than with conventional T1WI. Small foci of normal glandular inhomogeneity may be misinterpreted as microadenomas. A dynamic technique as described above may be employed as a problemsolving technique, but its routine use is unnecessary (Fig. 3.4). The overall sensitivity for MRI in the detection of adenomas is in excess of 90%. False-positive results may arise from artifacts (Fig. 3.10B), volume averaging with prominent clinoid processes, or mistaking cysts for adenomas. The site of insertion of the sphenoid sinus septum in the sellar floor may produce a small susceptibility artifact that can mimic a microadenoma. The diagnosis of pituitary microadenomas is reliant on two important findings—a determination that the lesion in question arises from the gland and, when present, a smooth expansion of the sella. Sellar expansion enables differentiation from other aggressive processes—such as infection, inflammation, and malignancy—that either do not expand the sella or, when they do, are associated with bone destruction. Macroadenomas demonstrate a wide range of signal intensities on MRI. A high T2 signal may indicate liquefactive change. T1 hyperintensity may indicate the presence of hemorrhage. Apoplectic adenomas may contain blood-fluid levels. Gradient-echo sequences are highly sensitive to intratumoral hemorrhage. Blood products of any age appear profoundly hypointense on such sequences.14 Perhaps the most important task of the radiologist evaluating macroadenomas is to determine the presence of cavernous sinus invasion (Fig. 3.5). The only reliable sign of cavernous sinus invasion on MRI is the presence of tumor on both sides of the cavernous and internal carotid artery.15 The medial wall of the cavernous sinus is not well seen on MRI. This wall may be displaced, or the tumor may lie embedded within it or may have invaded through it. None of these are confidently predicted with MRI except when, as mentioned above, tumor is evident encasing the internal carotid artery, a finding that is 100% specific for invasion. Several authors have proposed numerous criteria for cavernous sinus invasion, with varying degrees of specificity and sensitivity. Of these, perhaps the most helpful are the presence of tumor beyond a line drawn tangential to the lateral walls of the supraclinoid and cavernous internal carotid arteries and the presence of tumor in the medial compartment of the cavernous sinus inferomedial to the internal carotid artery, which have reported positive predictive values of 95% and 85%, respectively. If the degree of circumferential encasement of the internal carotid artery was greater than 67%, invasion was found to be certain, whereas if it was less than 25%, the negative predictive value was 100%. It must, however, be noted that constriction of the internal carotid artery is uncommon, even with large macroadenomas, and is more likely to be a feature of meningiomas in the cavernous sinus, although exceptions to this certainly exist. The optic chiasm and its relationship to the tumor are best seen on coronal images. The presence of abnormal optic nerve T2 signal intensity due to tumor compression has been shown to correlate with the degree of visual acuity impairment.16 A case of optic tract hemorrhage following pituitary apoplexy has also been reported.17 Fig. 3.3 Dynamic MRI. Three images from a dynamic MR set obtained at the level of the infundibulum. The subtle focus of decreased enhancement in the extreme periphery of the gland corresponded to a tiny microadenoma found at surgery. Note the centrifugal pattern of glandular enhancement. Uncommon neoplasms of the pituitary gland include pituicytomas and granular cell tumors. These are usually indistinguishable from macroadenomas, but a tendency to affect the posterior gland and stalk (as a consequence of which the bright spot may be ectopic) and intense enhancement may provide clues to the diagnosis. True astrocytomas may rarely arise from the pituitary gland.18,19Metastatic deposits may occasionally be seen in the gland, usually from breast and lung primaries. About 1 to 5% of patients with these cancers harbor pituitary metastaticdeposits. Symptomatic metastatic disease usually presents with diabetes insipidus due to stalk involvement. Imaging, however, cannot distinguish between metastases and adenomas reliably.20 Primary lymphoma of the pituitary gland is exceedingly rare, and lymphoma is more likely to be seen as a secondary phenomenon. The presence of low T2 signal intensity due to the dense cellularity of lymphoma may indicate the diagnosis.21 About 1.4% of patients with systemic leukemia have pituitary involvement. Langerhans cell histiocytosis involves the infundibulum in ~50% of cases. The stalk thickening and enhancement seen in histiocytosis are not specific for this entity. Similar findings may be seen with sarcoidosis and tuberculosis (Fig. 3.9A). The diagnosis can, however, be made if lytic bone lesions and pineal, white matter, choroid plexus, or dentate nucleus involvement are simultaneously seen.11 Craniopharyngiomas present on imaging as complex suprasellar/sellar solid-cystic masses. The two histologic subtypes—the papillary and adamantinomatous varieties—may sometimes be distinguished on imaging. The adamantinomatous subtype seen in children and younger adults usually manifests as a mixed solid-cystic or mainly cystic lobulated suprasellar/intrasellar tumor with large, nonenhancing, T1-hyperintense cysts (Fig. 3.6). The papillary variety is more likely to present in older individuals as a solid enhancing tumor, although a mixed solid-cystic pattern with T1-hypointense cysts may be seen.22 The dense calcific component of these lesions is better defined on CT scans. However, the true extent of these lesions, the nature of the cystic contents, the presence of vascular encasement, and the status of the optic apparatus are all better demonstrated on MRI. Rathke cleft cysts present as sellar/suprasellar discrete nonenhancing lesions on MRI. The signal intensities of the contents of these cysts are largely a function of protein concentration. Cysts with watery content are T1-hypointense and T2-hyperintense on MRI. The T1 signal intensity increases as protein concentration increases, whereas T2 signal intensity usually decreases. The presence of a mural nodule representing inspissated desquamated debris has been described as highly specific for these cysts23 (Fig. 3.7A). Rathke cleft cysts may coexist with adenomas. Pars intermedia cysts are located between the adenohypophysis and neurohypophysis and are often incidental findings. They usually demonstrate T1 hypointensity and T2 hyperintensity on MRI and do not enhance. Arachnoid cysts of the suprasellar cistern arise from incomplete perforation of the membrane of Liliequist. Unless hemorrhage has occurred, they demonstrate signal intensity identical to that of cerebrospinal fluid (CSF) on all imaging sequences. These developmental lesions may occur in the suprasellar cistern or parasellar region and can be recognized based on their characteristic MR signal intensities. Epidermoid tumors are hyperintense on T2-weighted and FLAIR (fluid-attenuated inversion recovery) images and demonstrate characteristic hyperintensity on DWI. This latter finding enables distinction from an arachnoid cyst (Fig. 3.7B). Dermoid cysts, owing to their fat content, are hyperintense on T1WI and occur usually in the suprasellar cistern. Fat-suppressed sequence, by eliminating this hyperintense signal, may be of value in the diagnosis. Rupture of a dermoid cyst can result in chemical meningitis, best seen on unenhanced MRI as foci of high T1 signal intensity, representing fat droplets in the subarachnoid spaces.24 Approximately 10% of intracranial meningiomas occur in the parasellar region. They arise from the dura overlying the planum sphenoidale, diaphragma sellae, lesser and greater sphenoid wings, cavernous sinus, and optic nerve sheaths. They may extend into the sella and displace or engulf the pituitary gland. They are best recognized on contrast-enhanced MRI as intensely enhancing extra-axial masses with a broad dural attachment, a dural tail, and a cleft of CSF separating them from adjacent brain parenchyma (Fig. 3.8A). Densely calcified meningiomas are markedly hypointense on T2WI and may not enhance substantially. When a significant intrasellar component is present, differentiation from an adenoma can be made by the frequent absence of sellar expansion in the former. When meningiomas involve the cavernous sinus and encircle the cavernous internal carotid artery, they tend to constrict it, as opposed to macroadenomas, in which constriction is not usually a feature. Meningiomas confined to the cavernous sinus may mimic schwannomas, most often of the trigeminal nerve. Schwannomas usually enhance uniformly with gadolinium but can demonstrate foci of cystic change or hemorrhage. They often demonstrate a tubular shape, conforming to the nerve of origin (Fig. 3.8B).11,25 Occasionally, perineural tumor spread from oropharyngeal or sinonasal cancers may result in enhancing masses in the cavernous sinus that mimic meningiomas or schwannomas. Approximately 20% of intracranial germ cell tumors occur in the suprasellar cistern. They may arise as primary tumors in these regions or may arise from leptomeningeal metastatic dissemination from a pineal primary. A midline enhancing solid suprasellar lesion in a young person, especially with a coexistent pineal lesion, is almost certainly a germinoma (Fig. 3.9B). One must also be wary of the so-called occult neurohypophyseal germinoma, a germ cell tumor in a young patient with diabetes insipidus that may be inapparent on initial imaging. A follow-up MRI may reveal its presence and is therefore warranted.26 These tumors arise from the clivus and petrous temporal bones and may present as parasellar masses or secondarily invade the sella. Chondrosarcomas have a tendency to be centered at the petroclival fissure. CT is useful in demonstrating the arcs and whorls of calcification that are typical of chondroid tumors. On MRI, they are significantly hyperintense on T2WI and tend to enhance variably. Chordomas are more midline in location. The bone destruction and tumoral calcifications of chordomas are best seen on CT. On MRI, heterogeneous signal intensity due to the presence of hemorrhage, calcification, and proteinaceous material is visible.27 On T2WI, these, like chondrosarcomas, are hyperintense. Distinguishing between these may be difficult, but a more lateral location favors a chondrosarcoma (Fig. 3.8C,D). Infection of the pituitary gland is a rare phenomenon. Bacterial pituitary abscess due to Gram-positive cocci may be caused by hematogenous seeding, extension from sphenoid sinusitis, cavernous sinus thrombophlebitis, or meningitis. Prior transsphenoidal surgery, an underlying pituitary lesion, and an immunosuppressed state are known preexisting factors. The presence of a ring-enhancing lesion in a setting of meningitis and sphenoid sinusitis, especially when gas is present, must point to the diagnosis.28 Lymphocytic adenohypophysitis (LAH), with or without infundibular involvement (Fig. 3.9C), and lymphocytic infundibuloneurohypophysitis (LIN) are autoimmune diseases with distinct clinical presentations. LAH is seen most often in the postpartum state and presents with pituitary insufficiency, whereas LIN presents as diabetes insipidus. LAH manifests on MRI as diffuse enlargement and enhancement of the gland with or without stalk thickening and enhancement. The latter, when present, enables distinction from an adenoma. Also, the sella in LAH is of normal size. Local meningeal enhancement and extension into the cavernous sinus have been reported. LIN presents as thickening and enhancement of the stalk and loss of the normal posterior pituitary bright spot, findings that are entirely nonspecific.29 A prominent pituitary gland with a convex superior surface has been described as an imaging finding in the syndrome of intracranial hypotension. This is known to occur owing to venous hyperemia in an attempt to maintain intracranial volume in compliance with the Monro-Kellie hypothesis. This finding is often mistaken for an adenoma or hyperplasia. The coexistence of tonsillar descent, an effaced suprasellar cistern, and smooth dural enhancement over the cerebral convexities with or without subdural effusions should point to the correct diagnosis30 (Fig. 3.10A). Pituitary apoplexy may occur spontaneously or less commonly be associated with precipitating factors such as bromocriptine therapy, recent surgery, pregnancy, gamma knife radiation, or coagulopathy. On histopathology, hemorrhage or hemorrhagic infarction is observed. The signal intensity of an apoplectic adenoma depends on the degree and duration of the hemorrhage. Adenomas that have undergone infarction demonstrate only a thin rim of peripheral enhancement. An acutely infarcted adenoma may appear hyperintense on DWI.. Predominantly hemorrhagic adenomas demonstrate complex signal intensities. T1 hyperintensity due to the presence of methemoglobin and, less commonly, a hematocrit effect with blood-fluid levels may be seen (Fig. 3.11). As mentioned earlier, gradient-echo imaging may be able to demonstrate subtle foci of hemorrhage as areas of profound hypointensity.31,32 A profoundly gradient- and T2-hypointense gland may also be seen with hemochromatosis. Fig. 3.8 Parasellar masses. (A) Typical parasellar meningioma. Note the dural tail (arrowheads) and the constriction of the left cavernous internal carotid artery (arrow). (B) Trigeminal schwannoma. The mass is hyperintense on T2WI. Extension into the cisternal segment of the trigeminal nerve (dashed arrows) indicates the diagnosis. (C) Chondrosarcoma. These tumors are typically centered at the petroclival fissure. The CT scan to the left shows the arcs and whorls of calcification. The lesion enhances heterogeneously (center) and demonstrates characteristic T2 hyperintensity. (D) Chordoma. The central location within the clivus is typical. On the unenhanced T1WI, the foci of hyperintensity (arrow) correspond to hemorrhage or proteinaceous material. The lesion enhances inhomogeneously (left). Fig. 3.9 Pituitary stalk lesions. (A) Neurosarcoid. Note the thickening and enhancement of the stalk and hypothalamus. Nodular and linear leptomeningeal enhancement (arrow) is evident. (B) Germ cell tumor. The gland and stalk demonstrate diffuse thickening and enhancement. The lack of sellar expansion argues against a macroadenoma. The enhancement of the hypothalamus and in the supraoptic recess are worrisome for an aggressive process (arrow). (C) Lymphocytic adenohypophysitis with stalk involvement. Again, note the lack of sellar expansion. An “empty” sella is usually the consequence of a developmental defect in the diaphragma sellae that has resulted in the herniation of arachnoid and CSF into the sella. It may be encountered incidentally but may also be a consequence of chronically raised intracranial pressure, as in pseudotumor cerebri. The presence of flat optic discs and distended optic nerve sheaths in conjunction with an empty sella enables a diagnosis of pseudotumor cerebri to be made in the appropriate clinical setting. In this setting, it has been observed to reverse with treatment.33 An intrasellar arachnoid cyst can mimic an empty sella but is more likely to deform the pituitary stalk. The interpretation of CT or MR studies of the post-treatment sella is often a challenging process. A postoperative sella may contain any combination of residual/recurrent tumor, fat packing, fluid, hemorrhage, Gelfoam, and native gland. Fat packing, which tends to involute with time, is easily recognizable as foci of T1 hyperintensity that disappear on fat-suppressed imaging. Gelfoam is more variable in appearance but most often contains a T1- and T2-hypointense core. Methylmethacrylate can also be used to pack the sella and is dark on all sequences. Following the stalk to its insertion enables identification of the native gland (Fig. 3.12). Residual/recurrent tumor and granulation tissue may be indistinguishable. The only true sign of tumor is its growth as observed on serial scans.11 MRI is also useful to monitor complications arising from stereotactic radiosurgery to the sella and parasellar regions, such as temporal lobe necrosis and optic neuropathy. Fig. 3.11 Apoplectic adenomas. (A) Hemorrhagic pituitary macroadenoma. Note the blood-fluid level. (B) Predominantly infarcted adenoma. Note the faint peripheral enhancement (arrowheads). A few small areas of hemorrhage are also present (arrow). Modern sellar imaging is highly reliant on MRI. CT has a useful supplementary role. A vast number of disease processes involve the sellar and parasellar region. Knowledge of key imaging findings analyzed in conjunction with the underlying clinical picture enables a specific diagnosis in most cases.
 Imaging Strategies
 Imaging Anatomy
 Tumors
Pituitary Neoplasms
Adenomas
Other Pituitary Tumors
Cystic Sellar/Suprasellar Lesions
Craniopharyngiomas
Rathke Cleft, Arachnoid, and Pars Intermedia Cysts
Epidermoid and Dermoid Cysts
Meningiomas and Schwannomas
Germ Cell Tumors
Chordomas and Chondrosarcomas
 Infectious/Inflammatory Disorders of the Pituitary Gland
 Miscellaneous Disorders of the Pituitary Gland
Intracranial Hypotension
Pituitary Apoplexy
The “Empty” Sella
The Post-treatment Sella
 Conclusion
References
Related posts:

Stay updated, free articles. Join our Telegram channel

Full access? Get Clinical Tree


