Visual acuity is a measure of the fidelity with which the visual system can transmit fine details of the visual world: it is the equivalent of the ability of a camera to produce sharp pictures. In a camera there are essentially two stages at which sharpness may be lost: either through optical defects that blur the patterns of light in the image, or subsequent factors – a lack of pixels – that limit the density of detail. These correspond in the eye to the quality of the optics, and to the density of the retinal receptors. But in the case of the eye there is a third factor: the possible degradation of the image that may occur in the course of the neural processing that takes place in the retina.
The pointspread function
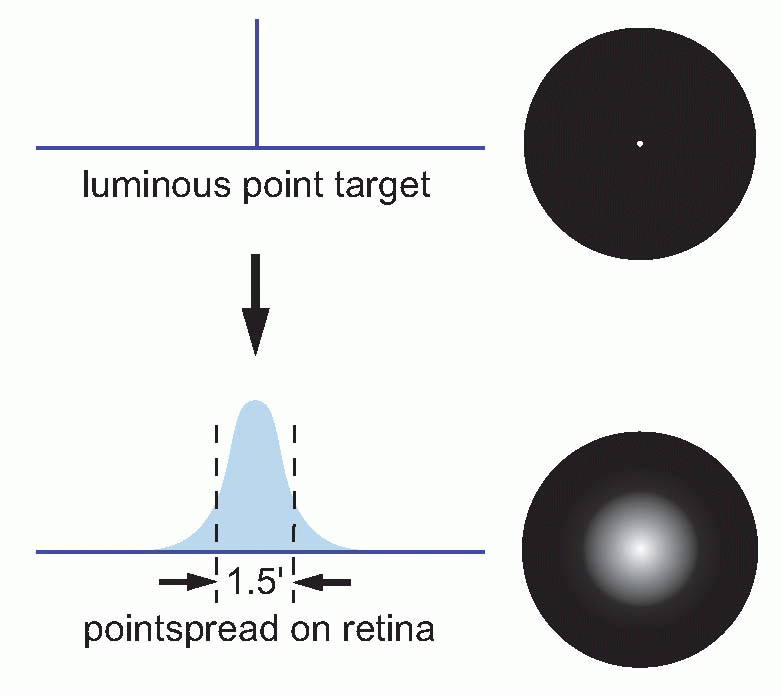
The effect of optical blur is relatively straightforward. Consider for instance the simplest of all visual objects, a star. Stars are so far away that they can in effect be regarded as infinitely small point sources. But the retinal image of the star will certainly
not be a point, because the optics will spread the light out into a sort of heap on the retina. This distribution of light is called the
pointspread function, and its size is a useful measure of how good or bad the optics are. In the human eye, under the best possible conditions,
the pointspread function has a diameter of about 1.5 arc min (measured half-way up); the worse your optics, the bigger this becomes.

 |
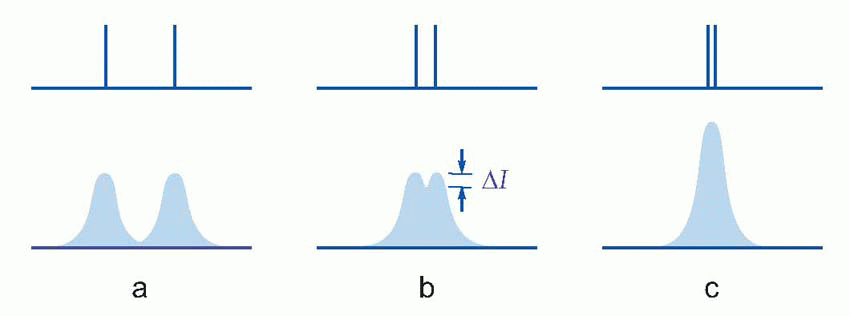
This pointspread function is of fundamental importance, since it absolutely determines what sort of patterns we can see and what we can’t. For instance, if we have two stars rather than one, each with its own pointspread, then if they are far apart, they will be seen correctly as two separate stars; if closer, eventually there will be no little dip in between them, and the brain will have no way of knowing that there are two stars and not one. For normal observers, the angle of separation for which this kind of resolution can just be performed provides a quantitative measure of visual acuity. Its value – around 30-45 arc sec – is an order of magnitude greater than the width of a black line that can just be seen. This figure, that is found to apply in many similar tasks of resolution, can be taken as a measure of the visual acuity or resolving power of the eye.
Resolution
We need to pause at this point to consider exactly what is meant by ‘seeing’ something. Seeing can mean detection, or resolution, or recognition. An ornithological friend points up in the sky and says ‘Can you see the crested willow-warbler?’ If you can’t, it may be either because it’s so far away you can’t detect it, or because although you can see a formless speck you can’t resolve the pattern of its markings, or finally because – although you can perceive every aspect of it – you haven’t the least idea what a crested willow- warbler is meant to look like. In each case, there is a failure to ‘see’, but for completely different reasons.
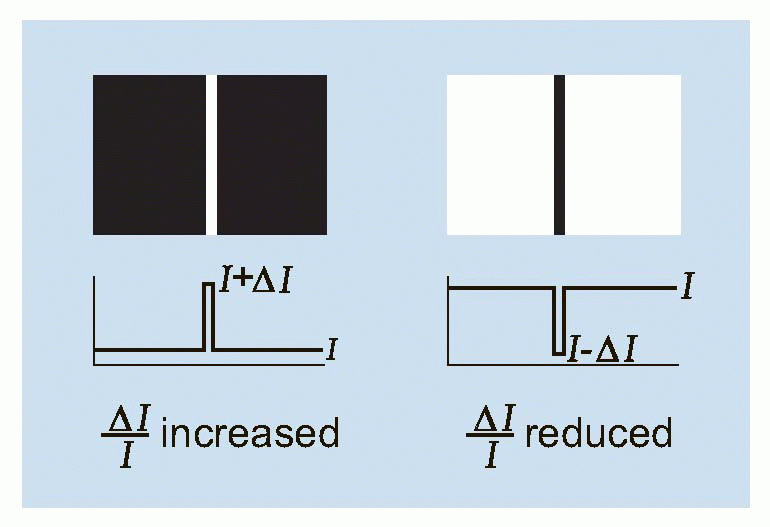
The existence of spatial spread has implications for detection as well as resolution. Since the incident energy from the point source is spread out over a larger area, the maximum intensity at the central peak is necessarily reduced, leading to a decrease in the
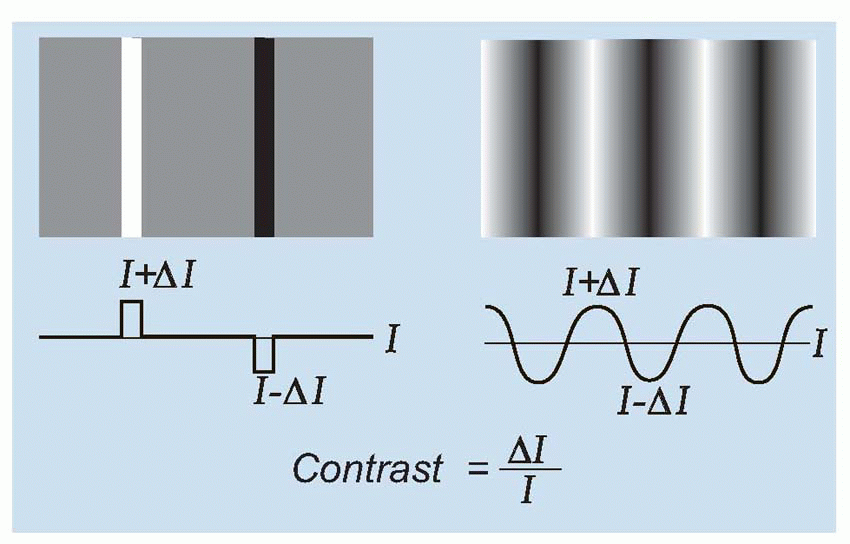
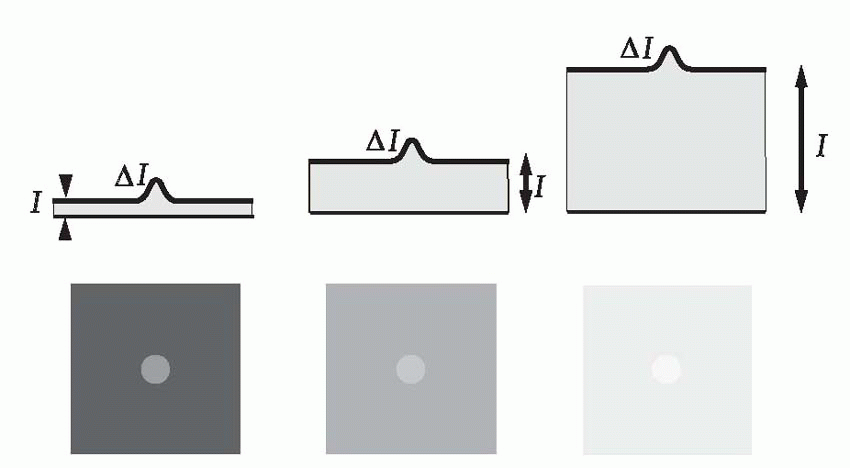
contrast, Δ
I/
I, which determines whether it will be seen against its background (see
p. 128). For objects of intrinsically high contrast, such as stars seen against the void of space, this will not matter much, and subjects with poor visual acuity as measured conventionally (see below) are not as bad at seeing stars as one might expect, bearing in mind the fact that such objects subtend an almost infinitely small angle. In the dark, whether one sees a star or not is almost entirely a matter of whether a sufficient number of photons from it fall upon a rod summation pool; as the sun rises its visibility depends on whether Δ
I/
I exceeds the threshold contrast. Thus – rather as in the case of the skin, discussed on
p. 90 – we may find that we can localize a visual object to a much higher degree than our ability to tell whether there is one object or two.
While the main effect of contrast is on detection, it also has some effect on resolution. With the two stars, in a case like that of (c), it is clear that we cannot improve resolution simply by increasing the contrast, and such a stimulus may be described as absolutely unresolvable. But in an intermediate case like (b), whether resolution is possible or not will depend on the contrast of the original object as well as on the width of the pointspread function. This interaction between resolution and contrast can best be investigated by using
grating patterns as test targets. A grating is simply a regular pattern of stripes; if the stripes are uniformly black and white, it is called a square-wave grating, because a plot of intensity as a function of distance across the grating would have a square-wave profile. In the same way, sinusoidal gratings have an intensity profile that is sinusoidal: there was an example on
p. 128. In each case, one can describe the grating in terms of its
spatial frequency (i.e. the number of cycles per degree) and its
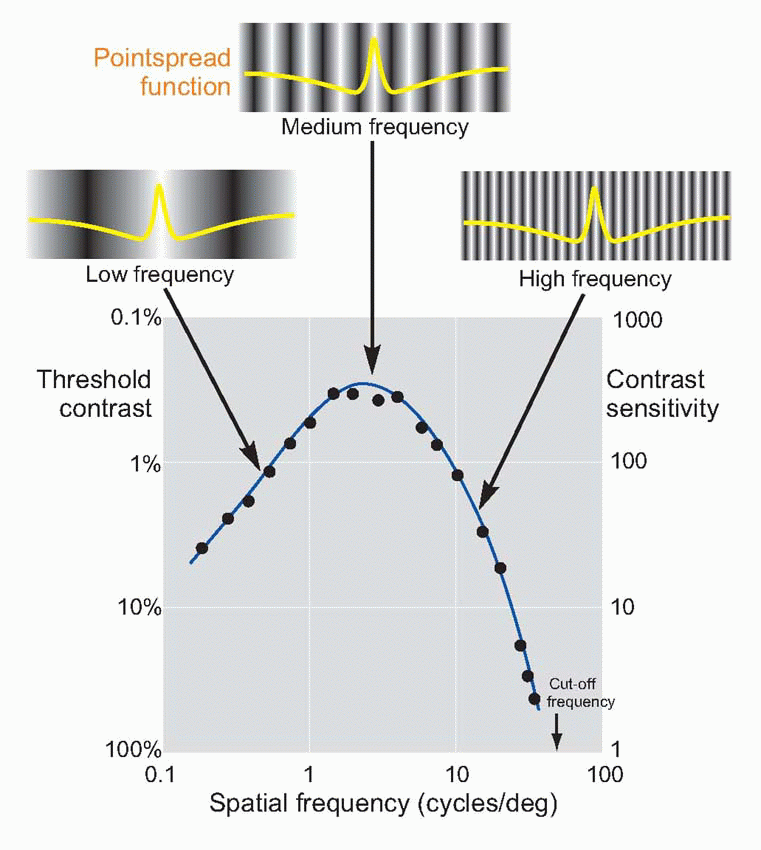
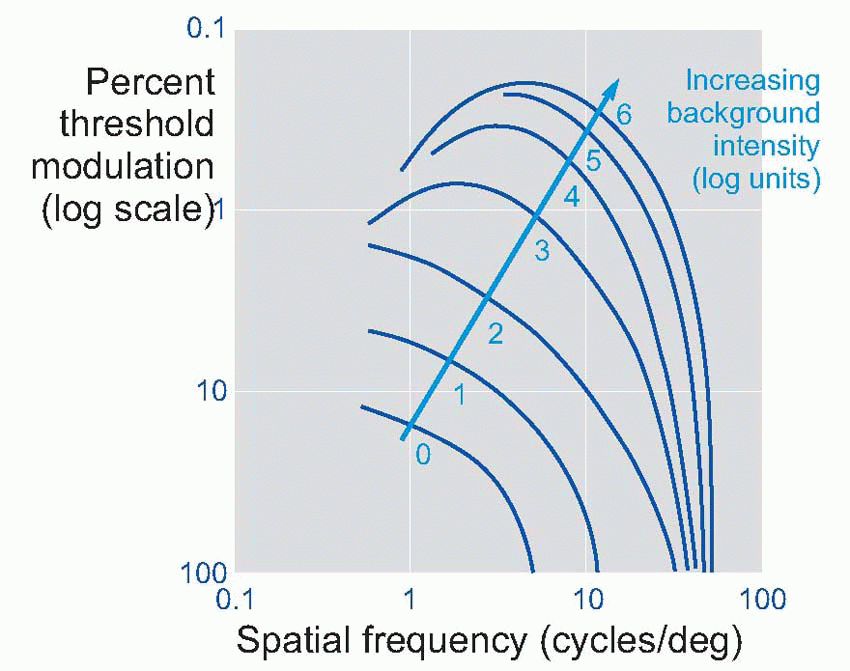
contrast (defined as the difference in intensity between peak and mean intensity divided by the mean intensity). Thus a pattern of alternate pure black and pure white strips, each 1° across, could be described as a square-wave grating of 100 per cent contrast and spatial frequency 0.5 cycles per degree. A simple experiment is to ask a subject to view a sinusoidal grating of a particular spatial frequency, and then reduce its contrast until he reports that he can no longer see it. If we plot this threshold contrast as a function of spatial frequency, we typically obtain a curve such as the one below. Because a blurred pointspread function affects high spatial frequencies much more than low ones, the contrast required to see the grating increases sharply as its frequency is increased, until at about 40-50 cycles per degree (the cut-off frequency), the subject cannot even see a grating of 100 per cent contrast. Because of the steepness of this cut-off, a small amount of extra blur causes a large increase in the
contrast needed, and so the method provides a sensitive measure of acuity. The reason for the fall-off in contrast sensitivity at
low frequencies is discussed later (
p. 152).
 |
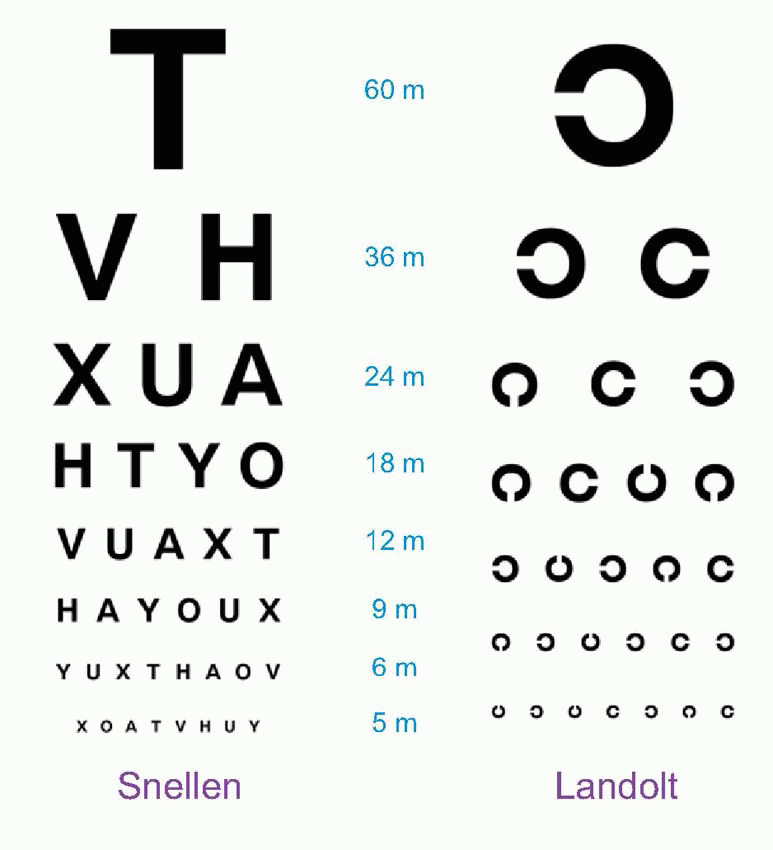
Of course, dispensing opticians don’t bother with all that. A rough-and-ready measure of visual acuity is to make up charts of letters of standardized shape and graded in size, and see at what point the patient is unable to read them. A common chart of this kind is the Snellen chart, in which rows of letters of diminishing size are to be read: by discovering the row at which the subject finally stops. Knowing the size of letters and the subject’s viewing distance, one can estimate his minimum resolvable angle. You can see that a letter E, for instance, is a bit like a miniature grating, and you need to be able to resolve it in order to read it. Each line of text is marked with distance in feet at which you should just be able to read it. If at 6 m you can only read the line for 12 m, then your acuity can be described as 6/12; a normal person is in theory therefore 6/6.

But Snellen charts are very conservative, since they are calculated not on the basis of 45 but of 60 arc sec, or one minute. So at 6 m away, with very good vision you should in fact be able to read the line marked 5, in which case your vision is described as 6/5. The idea is no doubt to make the glasses the optician has just sold you seem better than they are.
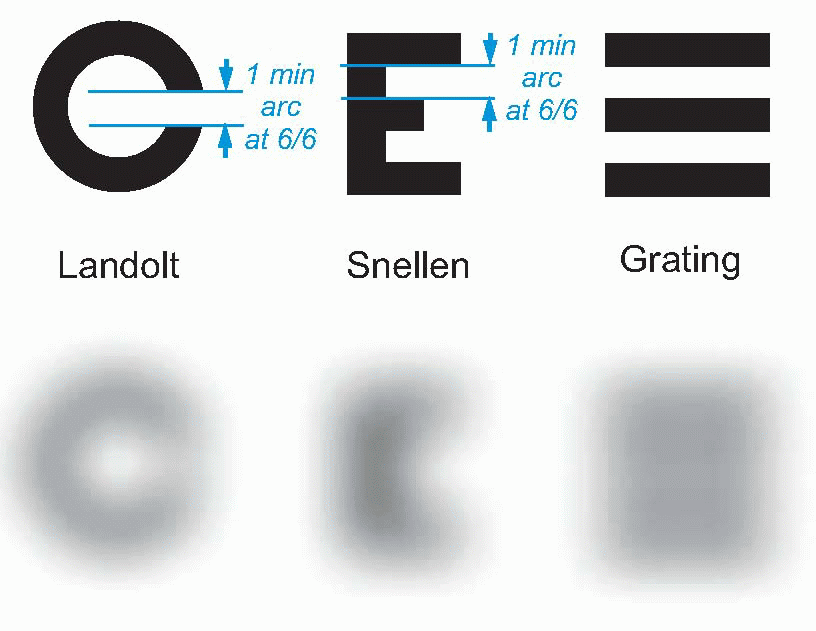
The difficulty of the Snellen chart for scientific work is that the test is only partly one of resolution. Apart from the assumption that you are literate, it is also clear that some letters are recognized more easily than others because of their overall shape; and for some purposes the Landolt C chart, used in the same way, is preferable because it provides no extraneous clues to the subject. Even this is not ideal, since it is still possible to detect the overall orientation of the C even though it is not really resolved: for this purpose, simple barred patterns are better, since when blurred it is completely impossible to guess the original pattern, which is not true either of Snellen letters, or even Landolt Cs. Another kind of chart in which all the letters are the same size but are graded in contrast can be used to test for certain kinds of defects in the visual system in which sensitivity to contrast is specifically impaired.
 |
 |
The tests described so far are all genuine tests of acuity in that they require that detail of some kind be resolved. Other tests, that at first sight might also appear to be acuity tests, are really tests of detection or localization, and give apparent acuities far better than 30-45 arc sec. A well-known example is
vernier acuity, where a subject is required to move two lines into alignment, as for instance in the scale of vernier callipers. Here one does incredibly well, typically of the order of a few seconds of arc. But the task is not resolution but
localization: even if
the retinal image is blurred, one can still estimate where the peak is quite accurately. One can show that the
longer the line the better one is, showing that accuracy is also being improved by averaging information over the whole line. Another pseudo-acuity task is the detection of stars, which may subtend extremely small angles at the eye. For instance, the bright star in Orion called Betelgeuse subtends only some 1/20 arc sec. But in a sense that figure is quite irrelevant: because of the pointspread, its image
still has a width of 45 arc sec, and whether you detect it or not depends simply on how whether its luminance exceeds the absolute threshold, Δ
I0.

 |
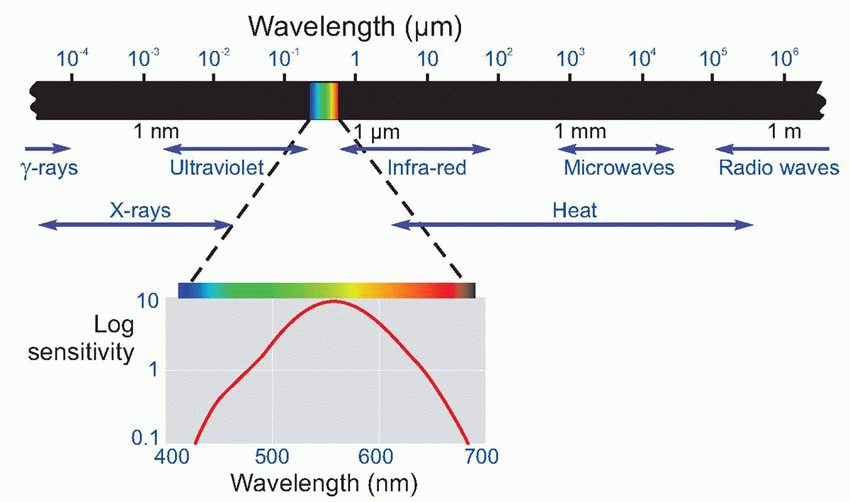


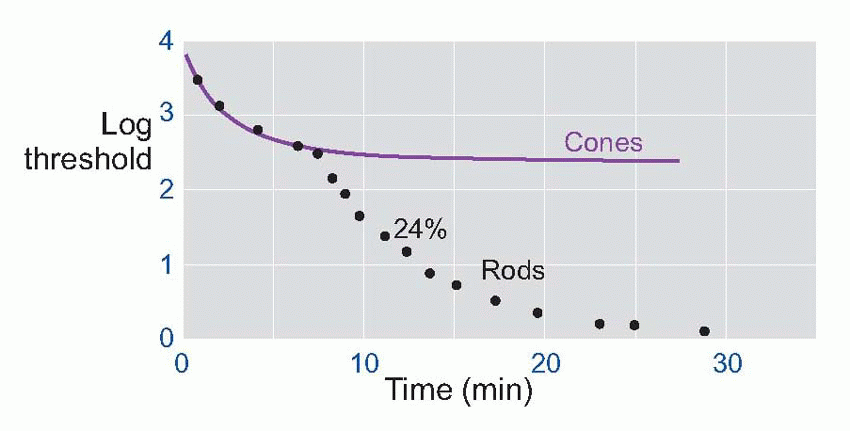
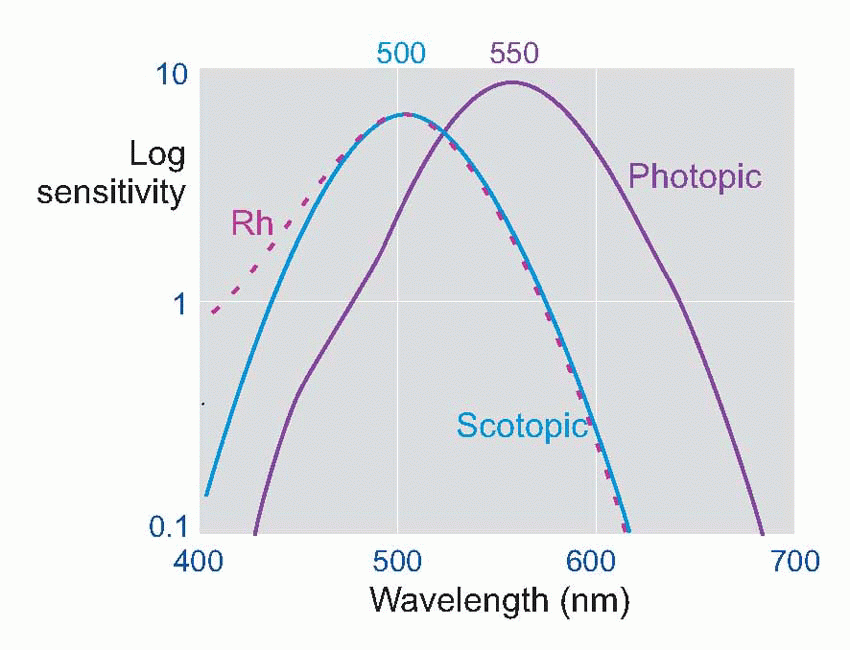
 The difference in the spectral sensitivity curves relates to the degree to which rods and cones absorb light of different wavelengths: the dashed green line shows how the absorption spectrum for the pigment in the rods, rhodopsin, has a very similar shape to the scotopic sensitivity.
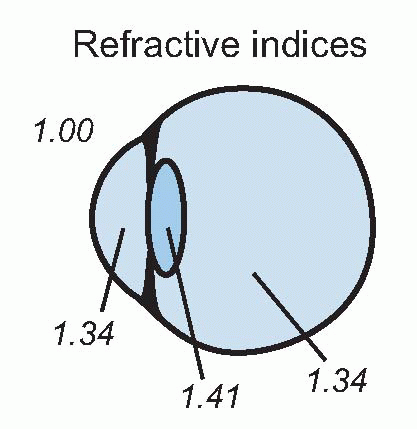
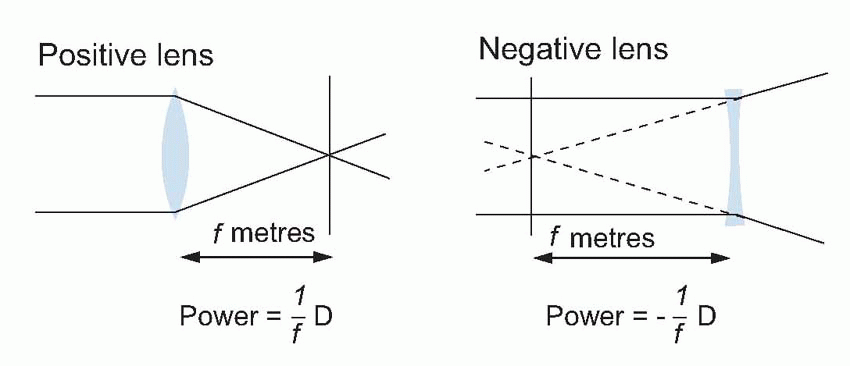
 So, contrary to popular belief, the focusing power of the eye is not mainly due to the lens: the reason is that its refractive index is not very different from that of the aqueous humour and vitreous humour on each side, so it doesn’t contribute much. The cornea is powerful because its interface is with air, whose refractive index is much smaller (1.0008 to be exact).
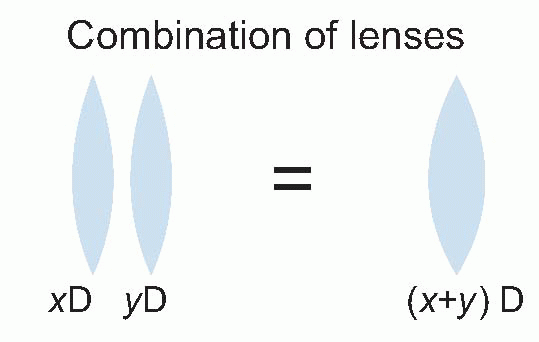
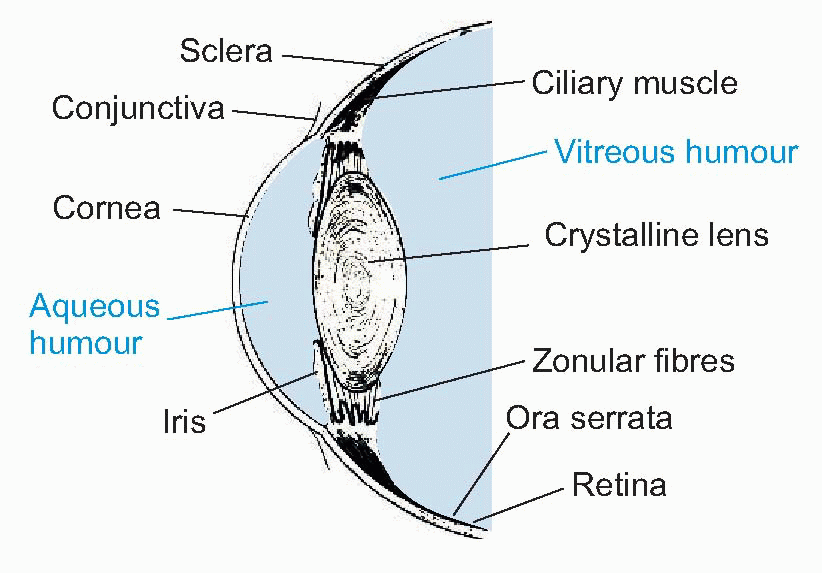
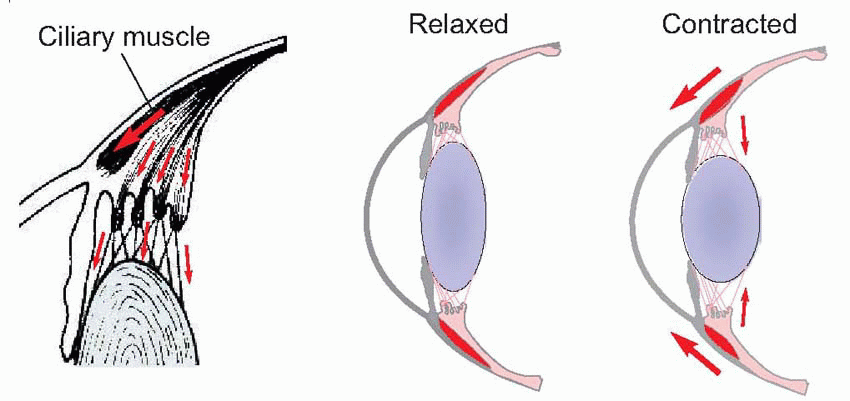

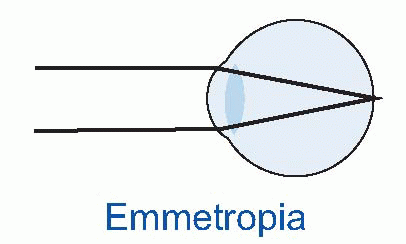
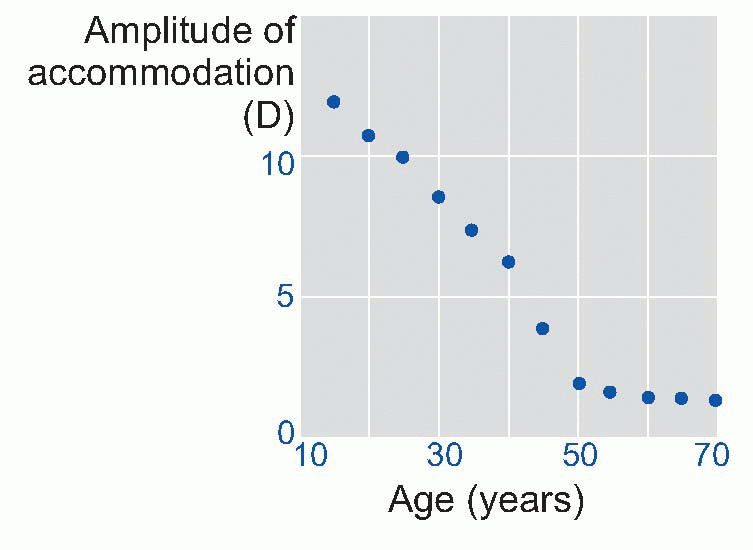
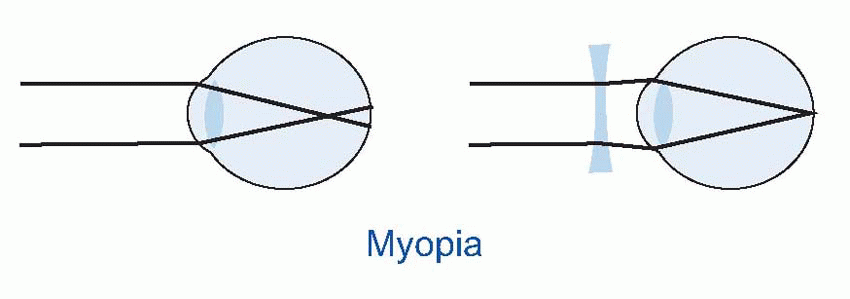
 Few people are exactly emmetropic; for most, one finds that when the accommodation is fully relaxed the total refractive power is either too strong or too weak in relation to the distance from the cornea to the retina: they suffer from refractive error. If it is too strong, the image of a distant object lies inside the vitreous instead of on the retina and we have the condition called myopia.
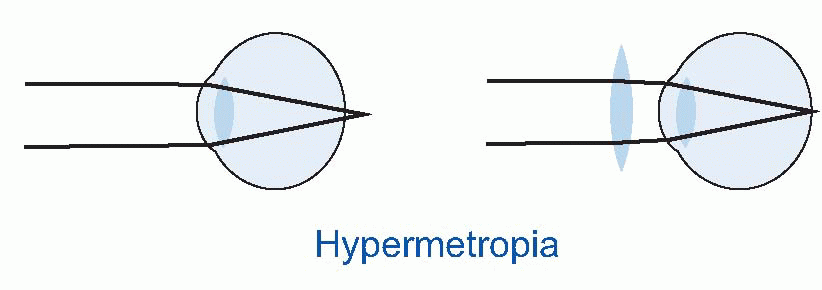
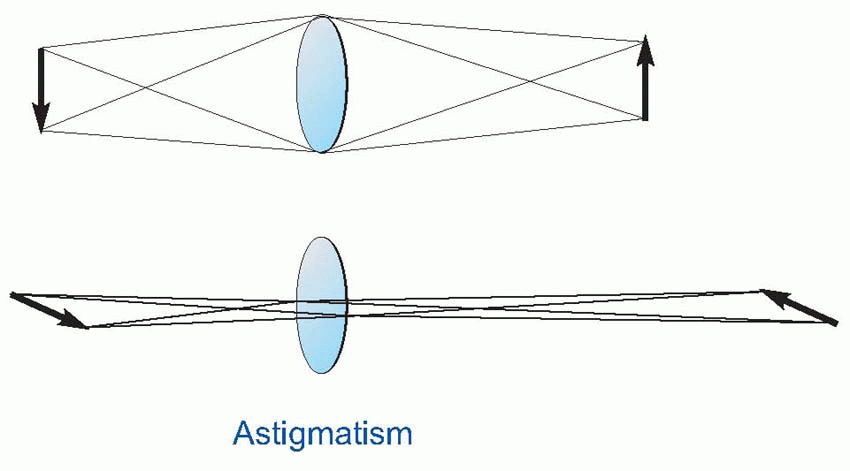
  An optician corrects myopia by using a negative or concave spherical lens. For example, if your far point is 1 m away, then that means your eye has 1 D too much power, and you need a -1 D lens to make it up. If you’re long-sighted or hypermetropic, the eye is too weak and needs an additional positive lens to correct it. In either case, you can describe the degree of disability by the power and sign of the lens needed to bring the eye back to emmetropia: thus a mildly short-sighted patient might require a correction of -1.75 D. This is called the spherical correction, part of an optician’s prescription, and in general is not the same in both eyes.






 But Snellen charts are very conservative, since they are calculated not on the basis of 45 but of 60 arc sec, or one minute. So at 6 m away, with very good vision you should in fact be able to read the line marked 5, in which case your vision is described as 6/5. The idea is no doubt to make the glasses the optician has just sold you seem better than they are.


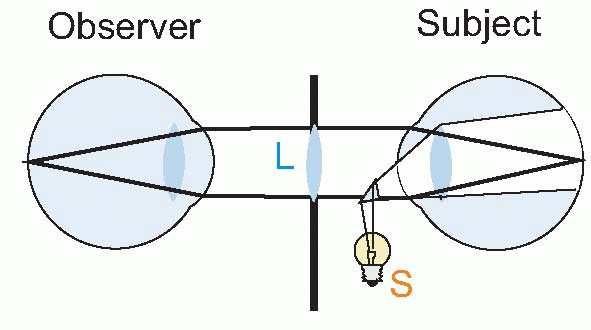

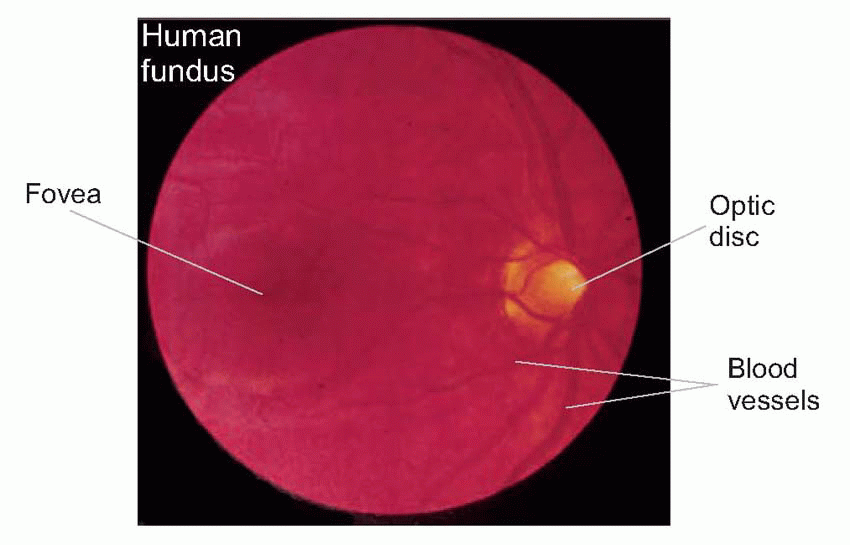

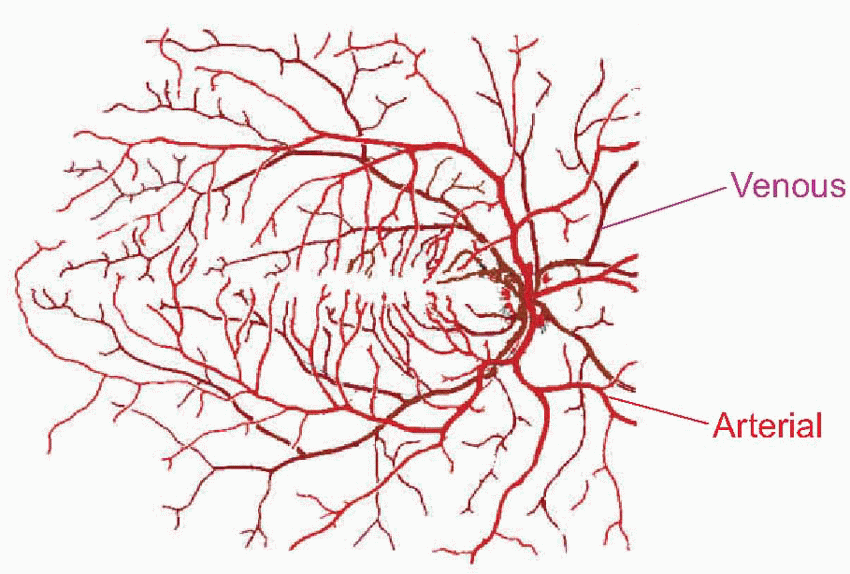
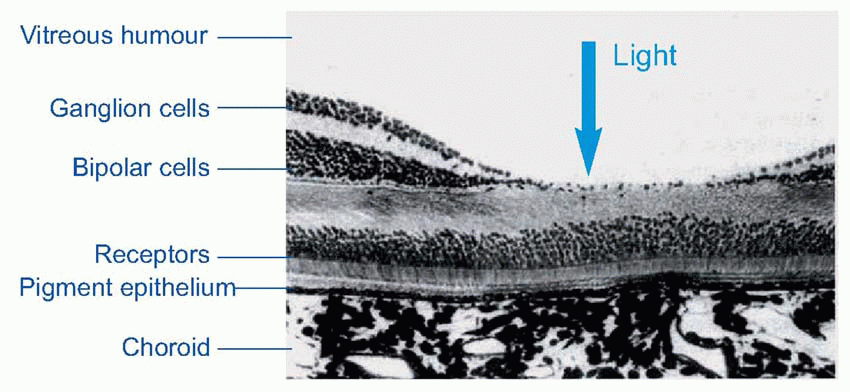

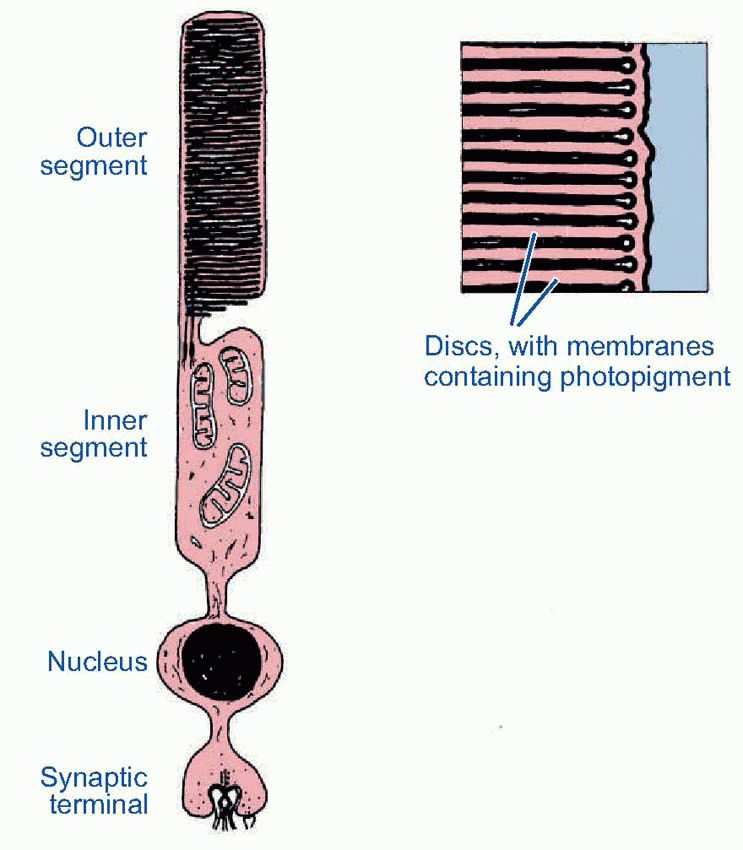
 Much more is known about rhodopsin than other pigments, but there is no reason to believe they are essentially different. Rhodopsin absorbs over nearly all the visible spectrum, peaking in the green region, at around 500 nm. We can compare this with the spectral sensitivity of vision itself, by measuring the absolute threshold for lights of different wavelength, in the dark-adapted state when only the rods are operating. We saw earlier (p. 129) that this curve, the scotopic sensitivity curve, corresponds very closely to the absorption spectrum for rhodopsin, implying that absorption by the pigment is indeed the first step in the transduction process.

