Chapter 18 What Brain Imaging Reveals about Sleep Generation and Maintenance
Abstract
Functional Segregation and Integration During Normal Human Sleep
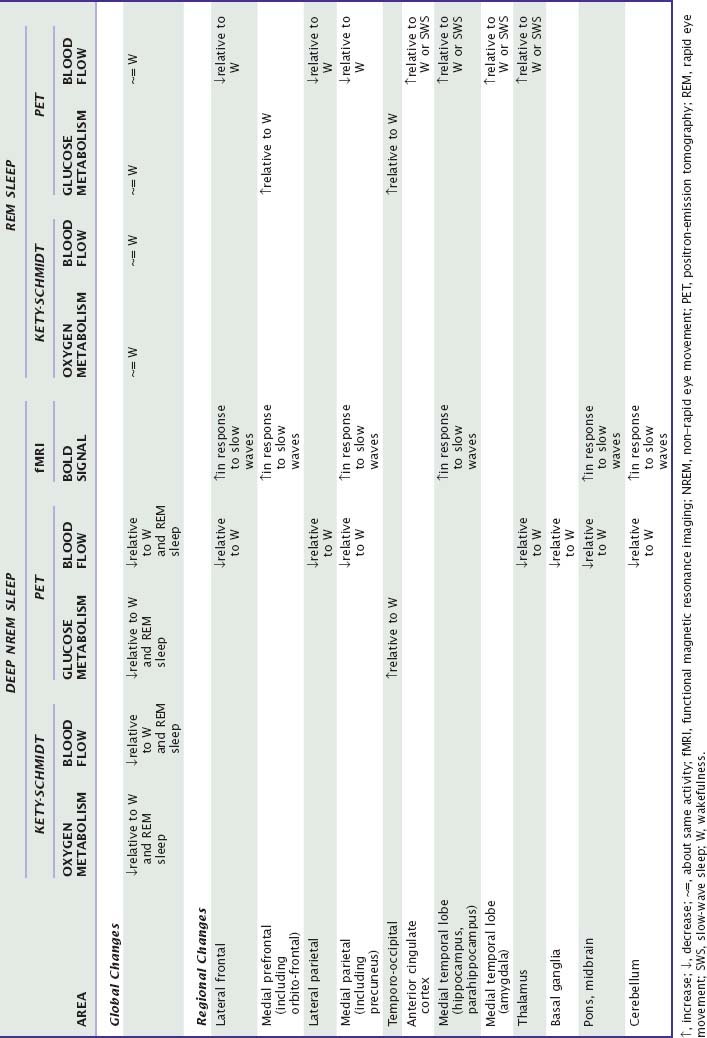
Research attention has focused on the hypothalamus playing a significant role in arousal and in regulating transitions between sleep and waking states. Specifically, the tuberomamillary histaminergic neurons and the perifornical hypocretin neurons in the posterior hypothalamus have extensive interconnections and interactions with the basic arousal systems (for more information see Chapters 7, 8, 21, and 33). Activity changes in these primary regulating areas result in profound modifications in activity patterns in thalamocortical circuits and associated structures, such as basal ganglia or cerebellum. A primary aim of functional imaging studies has been to characterize this reorganization of regional brain function during normal human sleep as well as the responses to external stimuli and the influence of previous waking experience on regional brain activity during sleep. The results detailed below are summarized in Table 18-1 (Fig. 18-1).
Table 18-1 Summary of the Modifications in Global and Regional Hemodynamic or Metabolic Parameters during NREM and REM Sleep
Non–Rapid Eye Movement Sleep
Neurophysiologic recordings in sleeping animals indicate that during non–rapid eye movement (NREM) sleep, the neural activity of the brain is shaped by a slow rhythm (<1 Hz), characterized by a fundamental oscillation of membrane potential made up of a depolarizing phase, associated with important neuronal firing (up state), followed by a hyperpolarizing phase, during which cortical neurons remain silent for a few hundred milliseconds (down state).1,2 The slow oscillation occurs synchronously in large neuronal populations in such a way that it can be reflected on EEG recordings as high-amplitude low-frequency waves.1,3–5 The slow rhythm entrains other sleep oscillations in a coalescence of multiple rhythms.6 Among the latter, spindles are associated with burst firing in thalamocortical populations. They arise from a cyclic inhibition of thalamocortical (TC) neurons by reticular thalamic (RT) neurons, which elicits postinhibitory rebound spike bursts in TC cells, which in turn entrain cortical populations in spindle oscillations.7
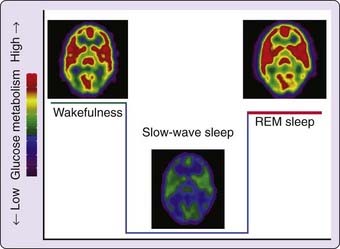
At the macroscopic systems level, the measure of brain metabolism or hemodynamics by PET usually requires the integration of the brain activity over extended time periods (from tens of seconds for H215O-PET to 45 minutes for fluorodeoxyglucose F-18 (18F-FDG) PET, resulting in the averaging of brain activity over the up and down states described earlier. Consequently, NREM sleep has systematically been associated with lower brain energy metabolism than has wakefulness.8 Relative to wakefulness, cerebral glucose and oxygen metabolisms, as well as cerebral blood flow, are decreased by 5% to 10% during stage 2 sleep9,10 and by 25% to 40% during slow-wave sleep (SWS, i.e., stage 3 to 4 NREM sleep).11–13
These decreases are not homogeneous but show a reproducible regional distribution. It is thought that brain areas with a high proportion of neurons committed in synchronous sleep oscillations are likely to have the lowest regional activity.8 During light NREM sleep, cerebral blood flow decreases in the pons and thalamic nuclei, as well as in frontal and parietal areas, but is maintained in the midbrain.14 Consistent with the implication of thalamic nuclei in the generation of spindles, thalamic blood flow during stage 2 sleep decreases in proportion to the power density within the sigma frequency range (12-15 Hz).15 During SWS, the most consistent decreases were observed in areas playing a permissive or active role in generating NREM sleep and its characteristic oscillations: These areas are the dorsal pons and mesencephalon, thalami, basal forebrain, and hypothalamus. The topography of the decreases in cortical blood flow during NREM sleep is also very reproducible and encompasses the prefrontal cortex, anterior cingulate cortex, the precuneus, and the mesial aspect of the temporal lobe.
The mechanisms that produce these diminutions in regional blood flow are not completely understood. The frontal and parietal polymodal associative cortices are among the most active brain structures during wakefulness.8 Consequently, it is usually believed that homeostatic sleep pressure locally accrued during a normal waking day is particularly important in these cortical areas, resulting during NREM sleep in a considerable amount of local slow waves and consequently a substantial decrease in local energy metabolism.8 Significant decreases in blood flow were also unexpectedly observed in the cerebellum and basal ganglia. It is currently not known whether these changes in blood flow indicate that these two areas have a role in generating and maintaining cortical oscillations or if they are merely entrained by the cortical slow rhythm.
Advances in event-related EEG and fMRI have allowed a finer-grained characterization of brain activities associated with transient events, such as spindles16 or slow waves. In humans, some evidence suggests that there are two different types of spindles during sleep, slow and fast EEG spindles, which differ by their scalp topography and some aspects of their regulation.17 Both spindle types trigger significant activity in the thalami, the anterior cingulate and insular cortices, and superior temporal gyri. Beyond the common activation pattern, slow spindles (11-13 Hz) are associated with increased activity in the superior frontal gyrus. In contrast, fast spindles (13-15 Hz) recruit a set of cortical regions involved in sensorimotor processing and recruit the mesial frontal cortex and hippocampus.
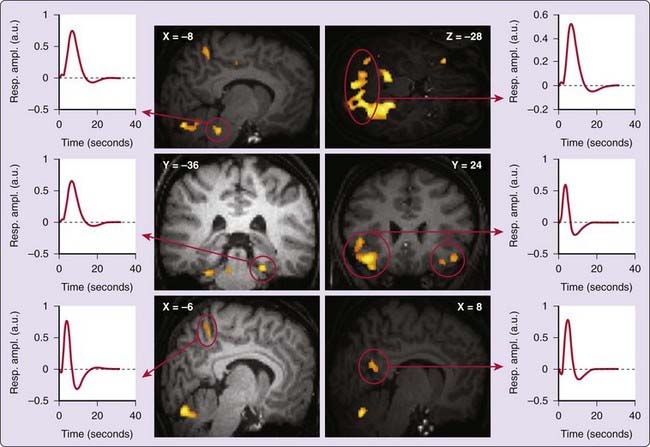
During SWS, human EEG recordings are characterized by high-voltage low-frequency oscillations whose the classification is not always clear. The power density in the 0.75- to 4-Hz frequency band, usually referred to as slow-wave activity (SWA), has proved a very useful and popular parameter because it quantifies the dissipation of homeostatic sleep pressure during NREM sleep.18 However, its frequency bounds do not respect the dichotomy between slow (<1 Hz) and delta rhythms (1-4 Hz), which is based on differences in the respective cellular correlates of these oscillations in animals.6 In the temporal domain, the amplitude of SWS waves is classically larger than 75 µV.19 However, the largest waves (>140 µV) have been taken as realizations of the slow oscillation (<1 Hz).20,21 Transient increases in brain activity associated with slow (>140 µV) and delta EEG waves (75-140 µV) can be detected in the pontine tegmentum (in an area encompassing the locus coeruleus), midbrain, and cerebellum in several cortical areas including inferior frontal, medial prefrontal, precuneus, and posterior cingulate parahippocampal gyrus,22 areas that have been shown to be current sources underpinning human slow waves.23
As compared to baseline activity, slow waves are associated with significant activity in the parahippocampal gyrus, cerebellum, and brainstem, whereas delta waves are related to frontal responses. These findings show that NREM sleep is not a state of brain quiescence but is an active state during which neural activity is consistently synchronized by sleep oscillations (spindles, slow rhythm) in specific cerebral regions. Electrophysiologic and computational evidence from the cortex and thalamus indicates that the tonic firing pattern and fluctuations of the membrane potential during slow-oscillation up states are similar to those that occur during the waking state, suggesting that the up state is a ubiquitous feature of neuronal dynamics in corticothalamic networks reproducing a micro-wakelike state that facilitate neuronal interactions.24 The partial overlap between the regional activity pattern related to SWS waves and the waking default mode network is consistent with the hypothesis that the brain responses synchronized by the slow oscillation restore micro-wakelike activity patterns (Fig. 18-2).22
Processing of External Stimuli During Nrem Sleep
At present, only a few neuroimaging studies have investigated how the human brain processes external stimuli during sleep, and their results are controversial. In sedated young children, examined with fMRI, visual stimulation elicited a paradoxical decrease in response in the anterior aspect of the medial occipital cortex.25 Although the neurobiological significance of this enigmatic finding remains elusive, it has been replicated in naturally sleeping adults during SWS, using fMRI and PET.26 This response pattern does not seem specific to visual stimulations because it is also observed when auditory stimuli are delivered during NREM sleep.27
In sharp contrast with these results, other data suggest that the brain still processes auditory stimuli up to cortical areas during NREM sleep.28 Significant responses to auditory stimuli were detected in bilateral auditory cortex, thalamus, and caudate nuclei during wakefulness and light NREM sleep. In addition, the left amygdala and the left prefrontal cortex are recruited by stimuli having particular affective significance for the individual subject. (More information on how the brain process sensory input during sleep is found in Chapter 30).
Rapid Eye Movement Sleep
Reorganization of Regional Brain Function during REM Sleep: Relation with Dream Characteristics
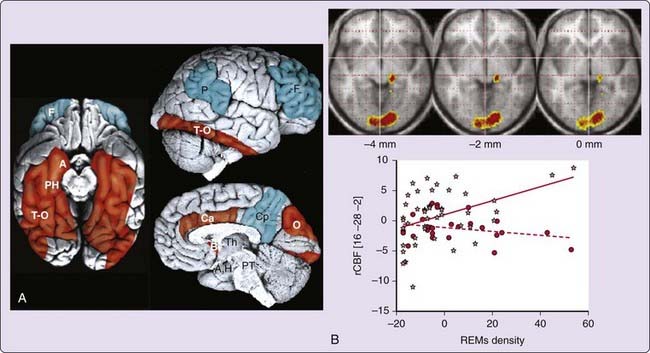
The level of energy metabolism recorded during rapid eye movement (REM) sleep is similar to waking levels.12,13 However, the distribution of regional brain activity significantly differs from wakefulness. In addition to areas known to participate in generation and maintenance of REM sleep (e.g., pontine tegmentum, thalamic nuclei), significant activations of limbic and paralimbic areas (e.g., amygdaloid complexes, hippocampal formation, anterior cingulate cortex, and orbitofrontal cortex) are reported during REM sleep (Fig. 18-3).11,29,30
Although not reported in all studies, posterior cortices in temporooccipital areas are typically activated during REM sleep.11 In contrast, the dorsolateral prefrontal cortex, parietal cortex, posterior cingulate cortex, and precuneus are the least active brain regions.11,29 Although early animal studies had already mentioned the high limbic activity during REM sleep, functional neuroimaging in humans highlighted the contrast between the activation of limbic, paralimbic, and posterior cortical areas on the one hand and the relative quiescence of the associative frontal and parietal cortices on the other hand.
Regional functional integration is also modified during REM sleep, relative to wakefulness. For instance, the functional interactions between striate and extrastriate cortices, which are positive during wakefulness, become negative during REM sleep.31 Likewise, the functional connectivity between the amygdala and temporooccipital areas is tighter during REM sleep than during resting wakefulness.32
The organization of human brain function during REM sleep somehow relates to some of the characteristics of dreaming activity.29,33,34 The perceptual aspects of dreams would be related to the activation of posterior (occipital and temporal) cortices, whereas emotional features in dreams would be related to the activation of amygdalar complexes, orbitofrontal cortex, and anterior cingulate cortex. The recruitment of mesiotemporal areas would account for the memory content commonly observed in dreams. The relative hypoactivation of the prefrontal cortex might help to explain the alteration in logical reasoning, working memory, episodic memory, and executive functions characterizing dream reports collected from experimentally induced REM sleep awakenings. Activation of the anterior cingulate cortex and surrounding mesial prefrontal cortex has been described, in studies on waking cognitive neuroscience, to be related to self-referential cognition and to the monitoring of performance. Activation of these structures within REM sleep might represent a role for REM sleep in the internal monitoring of aspects of the self, especially those having emotional significance given the activation of other related limbic and paralimbic structures.33
Brain Imaging and Other Characteristic Features of REM Sleep
Rapid eye movements constitute a prominent feature of REM sleep. Cerebral mechanisms underpinning the generation of spontaneous ocular movements differ between REM sleep and wakefulness in humans. Regional cerebral blood flow changes in the lateral geniculate bodies and in the striate cortex are significantly more correlated to ocular movement density during REM sleep than during wakefulness,35 a pattern later confirmed using fMRI.36 This pattern of activity is reminiscent of ponto-geniculo-occipital (PGO) waves, prominent phasic bioelectrical potentials associated with eye movements, which occur in isolation or in bursts just before and during REM sleep and are most easily recorded in cats and rats in the mesopontine tegmentum, the lateral geniculate bodies, and the occipital cortex.37
Another important feature in REM sleep is the instability in autonomic regulation and especially in cardiovascular regulation. During wake, the right insula is involved in cardiovascular regulation38 but during REM sleep, the variability in heart rate is related to the activity in the right amygdaloid complex.39 The functional connectivity between the amygdala and the insular cortex, two brain areas involved in cardiovascular regulation, differ significantly in REM sleep as compared to wake.39 These results suggest a functional reorganization of central cardiovascular regulation during REM sleep.
Experience-Dependent Modifications of Regional Brain Function during NREM and REM Sleep
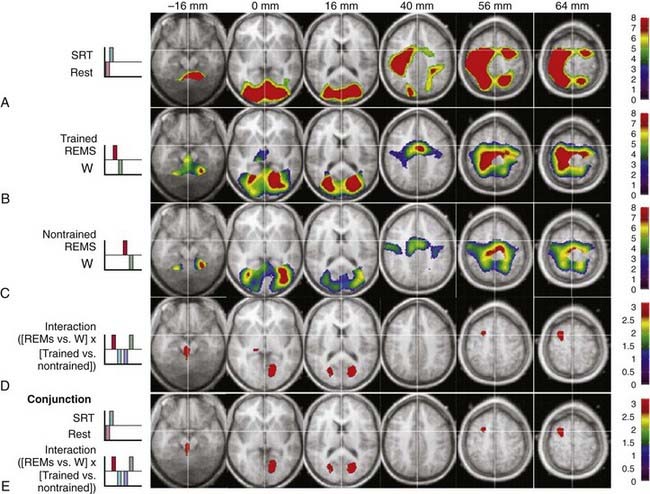
Waking experience substantially influences regional brain activity during subsequent sleep. For instance, the blood flow of the hippocampus and parahippocampal gyrus during NREM sleep is increased in subjects who were navigating in a virtual town during the previous waking period, as compared to naive participants.40 The level of hippocampal activity expressed during SWS positively correlates with the improvement of performance in route retrieval on the next day, suggesting that hippocampal activity during NREM sleep is related to offline processing of spatial memory.40 Similarly, several brain areas activated during the execution of a serial reaction time task during wake (brainstem, thalamus, and occipital, parietal and premotor areas) are significantly more active during REM sleep in subjects previously trained on the task in comparison to nontrained subjects.41 This enhancement of regional brain activity during posttraining REM sleep is observed only when the material to learn is presented in a structured manner as compared to random presentation.42 It is then suggested to be associated with significant changes in brain functional connectivity.43 Collectively, these results support the hypothesis that the memory of a motor sequence is further processed during REM sleep in humans (Fig. 18-4). (For more information on memory processing in relation to sleep, see Chapter 29.)
Related posts:
Stay updated, free articles. Join our Telegram channel

Full access? Get Clinical Tree


