Activation Methods
Takeo Takahashi
Keith H. Chiappa
Various activation procedures—such as hyperventilation, intermittent photic stimulation, or sleep—may be used to enhance preexisting abnormalities and induce abnormal findings in an otherwise normal electroencephalogram (EEG). This chapter discusses common activation methods as well as methods that are less frequently carried out in EEG laboratories. Sleepinduced, sleep-deprived, and especially psychotropic drug-induced effects are not discussed here; they are covered in other chapters.
HYPERVENTILATION
Precipitation of seizures by hyperventilation (HV) (1) was known prior to the discovery of the human EEG. Therefore, EEG activation by HV has been widely used in almost all clinical EEG laboratories since its introduction, and Nims et al. (2) showed the provocative efficacy of generalized synchronous paroxysmal discharges and of absence seizures produced by this test. This method consists of deep and regular respiration at a rate of about 20/min for a period of 2 to 4 minutes. In adults, such HV will cause air exchange of 20 to 50 L/min and a drop in partial pressure of carbon dioxide (PCO2) in the range of 4 to 7 mm Hg (3).
An understanding of the time course and magnitude of the systematic changes in blood gases produced by routine HV in adults is important for clinical interpretations of EEGs. Achenbach-Ng et al. (4) studied these changes in adults and children and found that during 3 minutes of HV, the PCO2 fell a mean of 18 mm Hg and the partial pressure of oxygen (PO2) rose 7 mm Hg, the former with a near-linear response curve (see Fig. 12.1). Note that PCO2 reached its nadir 30 seconds after the end of the 3 minutes of HV. From this point, after the command to “breathe normally,” PCO2 rose linearly to return to resting levels in about 5.5 minutes, more slowly for children. As PCO2 rose during this post-HV period, PO2 fell to 25 mm Hg below resting values at 5.2 minutes after cessation of HV, and then rose to resting levels over the following 11.6 minutes (Fig. 12.1). Any perturbation of ventilation in the post-HV period (e.g., talking) prolonged these steps. These findings minimize the clinical importance of slowing in the EEG that out-lasts the HV period, and correlate with the “rebuildup” of post-HV slowing seen in moyamoya disease (see below).
The characteristic EEG response to HV, most prominent in children, consists of a fluctuating increase of bilaterally synchronous slow activity and slowing of alpha and beta rhythms. In normal adults, although the slowing is generally not marked, there are wide differences among individuals.
With regard to the underlying mechanism of HV’s provocation of slowing and seizure discharges, Gibbs et al. (5) suggested that diffuse slowing is caused by inadequate compensatory vasoconstriction of the cerebrum in response to systemic hypocapnia. According to Gotoh et al. (6), diffuse slowing is considered to be the direct result of cerebral ischemic anoxia resulting from hypocapnic cerebral vasoconstriction. Yamatani et al. (7), measuring cerebral blood flow in the right carotid artery during HV, reported that decreased PCO2 and cerebral blood flow were the fundamental factors causing EEG slowing. Fisch and So (8) summarized the physiologic basis of the EEG response to HV as the following: alteration of PCO2, rather than pH or PO2, is the most important factor in producing the EEG response to HV, whereas the most obvious and dramatic physiologic effect of HV is decreased cerebral blood flow. Sherwin (9) attributed the diffuse slowing to synchronous activity in the nonspecific thalamocortical projecting systems, which become more active in hypocapnia. Patel and Maulsby (10) raised the possibility that hypocapnia induced by HV decreased activity in mesencephalic reticular formation, which then caused EEG slowing, just as drowsiness and sleep produce EEG slowing. Similar mechanisms to those described above are considered to be important for provoking paroxysmal discharges (11); hyperexcitability of neurons may be induced by respiratory alkalosis (12). However, the change from the pure delta response to the appearance of intermixed spikes and clear-cut spike-wave discharges remains obscure. Interestingly, it has been reported that intravenous administration of diazepam prevented HV-induced spike patterns, though it failed to attenuate the delta response (13).
The magnitude of the HV response depends on a number of factors (14). First, vigorous exchange of air can enhance activation effects. For the purpose of routine examination with HV, however, it is suggested that the rate of breathing be as close as possible to that of the resting rhythm (15 to 20 breaths/min) (14). Second, age is an important factor. Slow waves appear much more abruptly, are more pronounced, and persist longer in children than in adults. The degree and abruptness of the response are related directly to age (15). The most dramatic EEG responses to HV usually occur between the ages of 8 and 12 years (16). According to Gibbs et al. (5), in children between 3 and 5 years of age, 97% of epilepsy patients and 70% of normal subjects showed diffuse slowing with HV; after 20 years of age, more than 40% of epilepsy patients showed diffuse slowing, whereas it was seen in less than 10% of normal subjects. The areas most affected by HV in children are occipitotemporal regions (17,18). Delta waves tend to appear initially in the posterior regions and spread
forward in the younger age group, whereas they tend to appear in the frontal regions and spread backward in the older age group (19). Third, blood glucose level is also important in determining the degree of HV response. In adults, a low blood glucose level (less than 80 mg/dL) tends to enhance appearance of slow waves; a high level (more than 120 mg/dL) tends to inhibit or prevent such an effect (20). Delta waves induced by HV can occasionally be the first indication of pathologic hypoglycemia secondary to an islet cell tumor in a patient referred for an EEG (19). Fourth, an erect position as compared to a reclining position enhances the effect of HV; EEG slowing occurs earlier and with greater intensity. This is thought to be a result of relative cerebral anoxia (21). Diffuse slowing induced by HV usually disappears rapidly after ceasing HV; it may persist for up to 30 seconds in normal adults, but even further persistence at any age, by itself, is not necessarily an abnormality.
forward in the younger age group, whereas they tend to appear in the frontal regions and spread backward in the older age group (19). Third, blood glucose level is also important in determining the degree of HV response. In adults, a low blood glucose level (less than 80 mg/dL) tends to enhance appearance of slow waves; a high level (more than 120 mg/dL) tends to inhibit or prevent such an effect (20). Delta waves induced by HV can occasionally be the first indication of pathologic hypoglycemia secondary to an islet cell tumor in a patient referred for an EEG (19). Fourth, an erect position as compared to a reclining position enhances the effect of HV; EEG slowing occurs earlier and with greater intensity. This is thought to be a result of relative cerebral anoxia (21). Diffuse slowing induced by HV usually disappears rapidly after ceasing HV; it may persist for up to 30 seconds in normal adults, but even further persistence at any age, by itself, is not necessarily an abnormality.
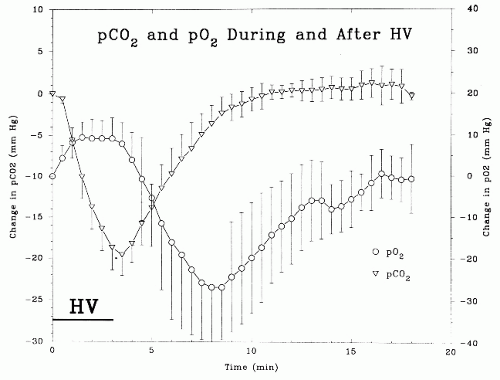 Figure 12.1 Time course and magnitude of absolute PCO2 and PO2 changes with 3 minutes of hyperventilation in nine normal adult subjects. The error bars are 1 standard deviation. A transcutaneous heated membrane technique was used for the blood gas measurements. |
Aside from diffuse slowing, HV may induce diffuse sharp waves or spike-wave discharges of epileptogenic significance; it is particularly effective in eliciting bilaterally synchronous spike-wave discharges in a patient with generalized epilepsies. Dalby (22) found that patients with absence seizures were more sensitive to HV than patients with nonabsence seizures, with the incidence of spike-wave paroxysms being 50% in the former and 25% in the latter. During HV, not only absence seizures but also complex partial seizures are induced in epilepsy patients. In general, latent abnormalities are likely to be activated by HV. Slow-wave foci associated with localized lesions may also be aggravated; abnormalities in temporal regions are more prone to accentuation than those elsewhere (23). Miley and Forster (24) reported that vigorous HV of longer duration induced abnormal discharges with or without clinical seizures in 11% of epilepsy patients with complex partial seizures. Arain et al. (25) have suggested that, because of the high incidence of significant clinical and EEG events provoked by HV, this activation procedure should be performed on a daily routine basis in patients in epilepsy monitoring units.
Unusually prolonged post-HV high-voltage slowing may be seen in patients with syncopal attacks of various etiologies (26). Buildup of slow waves after the end of HV (“re-buildup”) may be a diagnostic finding in children with moyamoya disease (27). In a study that addressed three cases of moyamoya disease, Kameyama et al. (28) reported that this EEG re-buildup was noted about 5 minutes after HV cessation; moreover, corresponding decreases in cerebral blood flow and PO2 were documented with it. Such a post-HV hypoxia 5 minutes after cessation of HV was also found in a study of nine normal adult subjects (4) (Fig 12.1). Note that it is suggested that HV should be avoided in patients with moyamoya disease (29).
The American EEG Society Guidelines (AEEGS) Committee (30) proposed the following minimum technical requirements: HV should be used routinely unless other medically justifiable reasons (e.g., a recent intracranial hemorrhage, significant car-diopulmonary disease, sickle cell disease or trait, or patient inability or unwillingness to cooperate) contraindicate it. It should be performed for a minimum of 3 minutes. At times, HV must be performed for a longer period in order to obtain adequate EEG activation. The guidelines suggest continued recording for at least 1 minute after cessation of overbreathing, but the slow time course of the recovery of PCO2 levels discussed above and the findings in the moyamoya patients indicate that at least 6 minutes of post-HV recording would be prudent.
Regarding the clinical interpretation of EEG changes seen during HV, a few simple principles should be kept as guidelines, and any clinical interpretation that exceeds these guidelines should have a firm, rational basis for the variance. These guidelines are: HV-induced slowing may be of any amplitude, location, rhythmicity, and time course and should still be considered to be within normal limits unless it is significantly asymmetrical or contains definite spikes.
As with most amplitude asymmetry considerations in clinical EEG interpretations, there are no precise values available for
normal limits in HV-induced slowing, but a 2:1 ratio is definitely abnormal and any asymmetry greater than 1.5:1 is probably abnormal. HV-induced slowing can persist for several minutes after the command to breathe normally, as discussed above, and this persistence or reappearance is only very rarely abnormal.
normal limits in HV-induced slowing, but a 2:1 ratio is definitely abnormal and any asymmetry greater than 1.5:1 is probably abnormal. HV-induced slowing can persist for several minutes after the command to breathe normally, as discussed above, and this persistence or reappearance is only very rarely abnormal.
Regarding a clinical interpretative declaration stating that there are HV-induced spikes in the EEG, a very conservative approach needs to be employed. As in most other sections of the EEG, the admixture and interaction of different, nonepileptiform frequencies can sum to produce a waveform with an epileptiform appearance that is not a true spike with the pathophysiologic significance of that cortical event. This is especially true with HV-induced slowing and its superimposed faster frequencies, and even more so in childhood since that age has the most complex mixture of frequencies and the highest amplitudes of all of those components, including the HV-induced slowing. In the pediatric age group both paroxysmal drowsy hypersynchrony and HV-induced bursts of slowing may contain admixed components with a spike-like appearance that are, despite their superficial appearance, normal variants. This differentiation constitutes the major challenge in the interpretation of pediatric EEGs.
In addition, the presence of altered responsiveness in association with high-amplitude rhythmic slowing (HIHARS) with HV is not abnormal (31). In the latter study, 8 of 12 healthy nonepileptic children (mean age 9.6 years) exhibited impaired verbal recall and failed to respond to repeated auditory clicks. Furthermore, Lum et al. (32) studied 77 episodes of HIHARS with loss of awareness from 22 children and 107 absence seizures during HV from another 22 children; eye opening and eyelid flutter were seen more frequently in absence seizures, whereas fidgeting, smiling, and yawning occurred more frequently during HIHARS episodes, and arrest of activity, staring, and oral and manual automatisms were observed in both groups, so that the EEG is the only reliable means of differentiating the two conditions, that is, epileptic versus nonepileptic.
INTERMITTENT PHOTIC STIMULATION
The effect of intermittent photic stimulation (IPS) on the human EEG was first studied by Adrian and Matthews (33). They used sinusoidal IPS derived from a constant light source in front of which a disc with cutout sectors was rotated. After this earliest report, similar instruments were used for more than a decade (34). Walter et al. (35) were the first to report activation of paroxysmal discharges by IPS with an electronic strobe light. After this pioneering work, the method of IPS using a strobe light became popular (36). The strobe lamp is placed at a distance of 20 to 30 cm in front of the subject’s eyes. IPS is commonly presented through closed eyelids, but it can be administered with the eyes open. Details of IPS use in routine examination vary greatly between EEG laboratories. The following protocol is suggested by Bickford (19): flashes at frequencies of 1, 3, 6, 9, 10, 15, 20, and 30 Hz each are given in trains of 5-second duration with eyes open and closed in a room with reduced illumination. It is sometimes advantageous to have patients open and close their eyes during the stimulation. In a standardization of screening methods for photosensitivity (37), the following IPS frequencies are used: 1, 2, 3, 4, 6, 8, 10, 12, 14, 16, 18, 20, 60, 50, 40, 30, and 25 Hz (8). The three main EEG changes induced by IPS are explained below.
With respect to the duration of photic stimulation in the clinical EEG laboratory, it should be noted that the technologist must be alert to stop stimulation immediately on identifying a photoparoxysmal response (PPR) since prolonged stimulation can trigger a generalized tonic-clonic seizure (GTCS) in a sensitive patient. Also, in these patients, once a PPR has been definitely identified, further stimulation should not be attempted as these patients may become more sensitive as stimulation continues or is repeated, and may launch into a seizure with little warning. The additional information gained from repeated stimulation is not worth the risk to the patient.
PHOTIC DRIVING RESPONSE
This is a physiologic response consisting of rhythmic activity elicited over the posterior regions of the head by IPS frequencies of about 5 to 30 Hz. The term photic driving response (PDR) should be limited to activity time-locked to the stimulus and of a frequency identical or harmonically related to the stimulus frequency (38).
As a rule, PDR is found over posterior regions. In infants, PDR can be elicited a few hours after birth (39), but PDR remains relatively small up to about 6 years of age (40). In older children, PDR becomes much larger, particularly at low frequencies (23). The amplitude of PDR is usually higher in children than in adults and again tends to increase in elderly people. Regardless of age, however, an exaggerated PDR to low flash frequencies (0.5 to 3 Hz) usually signifies acute or suba-cute neuronal dysfunction (41); examples include MELAS (mitochondrial myopathy, encephalopathy, lactic acidosis, and stroke-like episodes) (8) and the late infantile form of ceroid lipofuscinosis (42,43).
According to Fisch and So (8), large positive occipital sharp transients of sleep (POSTS) and lambda waves in response to scanning a complex pattern are predictive of a prominent PDR. Destructive cortical lesions may cause unilateral PDR depression, whereas irritative lesions, such as those associated with epileptic scars, may produce increased PDR on the side of the lesion (19). Interpretation suggesting abnormal PDR should be made carefully because a minor and inconsistent asymmetry of PDR is infrequently seen even in normal subjects; Coull and Pedley (44) claim that an asymmetry in amplitude only, in the absence of other EEG changes, should not be viewed as abnormal. Very low voltage or absence of PDR is of little diagnostic significance because some normal persons are not responsive to IPS (41). According to Chiba et al. (45), diffuse PDR could be observed in 25% of the patients who were receiving hemodialysis treatment.
It has been reported that PDR elicited by 5-Hz IPS with eyes closed is similar to that elicited by a red (saturated long-wavelength red) 5-Hz flicker stimulation, whereas PDR elicited by 5-Hz IPS with eyes open is similar to that elicited by a
5-Hz flickering dot pattern (46). In that case, decreased luminance, such as 20 candela (cd)/m2, was used. (This luminosity is very low compared to that of a stroboscopic IPS, for example, Grass photostimulator (intensity 8): 3939 cd/m2 (47).) Furthermore, using a 5-Hz red flicker stimulation and, to a greater extent, a 5-Hz flickering dot pattern provided by a visual stimulator (48), high-amplitude PDR over 50 µV was elicited more frequently. Such an excitatory effect of a dot pattern or other similar patterns on PDR (49) can be demonstrated easily by placing the pattern on the strobe light when IPS is given to the subject with eyes open (50).
5-Hz flickering dot pattern (46). In that case, decreased luminance, such as 20 candela (cd)/m2, was used. (This luminosity is very low compared to that of a stroboscopic IPS, for example, Grass photostimulator (intensity 8): 3939 cd/m2 (47).) Furthermore, using a 5-Hz red flicker stimulation and, to a greater extent, a 5-Hz flickering dot pattern provided by a visual stimulator (48), high-amplitude PDR over 50 µV was elicited more frequently. Such an excitatory effect of a dot pattern or other similar patterns on PDR (49) can be demonstrated easily by placing the pattern on the strobe light when IPS is given to the subject with eyes open (50).
Studies of PDR utilizing 5-Hz red flicker and 5-Hz flickering dot pattern (6 mm in diameter) stimuli by means of visual stimulators (47,51) yielded the following results (50). High-amplitude PDR is more frequently elicited using either a red flicker stimulation or a flickering dot pattern stimulation, irrespective of diagnostic group, than a white flicker stimulation with equal luminance, such as 20 cd/m2. High-amplitude PDRs elicited by flickering dot pattern and red flicker stimuli in adult patients suggest the presence of an occipital lobe disturbance. Incidence of high-amplitude PDR elicited by a flickering dot pattern stimulation in adult patients is 2.4 times higher in female patients than in male patients. A study of PDR in adult psychiatric outpatients showed that PDR amplitudes increased significantly with patient age (52). Figure 12.2 depicts EEG changes in response to 5-Hz flicker stimuli in a young patient with occipital lobe epilepsy: stimuli using white and red light elicited 5- and 10-Hz PDRs, whereas those by dot pattern (6 mm in diameter; 0.5 cycles/degree [c/deg]) elicited 5-Hz high-amplitude PDRs. Stimuli using dot patterns (0.5 mm: 4.9 c/deg; 1 mm: 2.1 c/deg; 2 mm: 1.5 c/deg; 4 mm: 0.8 c/deg) also showed a similar finding as that shown in Figure 12.2. As for high-amplitude PDRs observed in elderly individuals, they tend to be elicited by stimuli using moderate (2 mm in diameter) to large dot patterns (4 and 6 mm in diameter) as demonstrated in Figure 12.3. Namely, when dot patterns with lower spatial frequencies are employed, high-amplitude PDR tends to be elicited in elderly patients (53), whereas its incidence increases in younger patients by use of dot patterns with higher spatial frequencies.
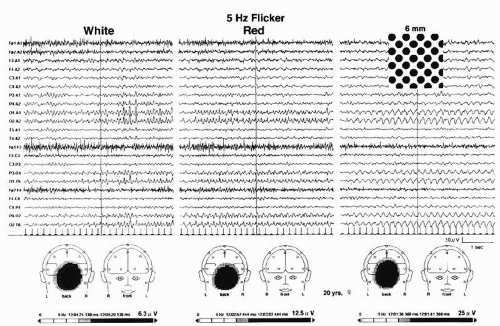 Figure 12.2 EEG changes in response to 5-Hz white flicker, red flicker, and flickering dot pattern (6 mm in diameter) stimuli to the full field (30° × 30°) in a 20-year-old woman with occipital lobe epilepsy. Stimulus was provided by use of a square-type strobe-filter method (92); luminance was maintained at 20 cd/m2. Lower tracings show mapping analysis of photic driving responses (PDRs) elicited by each flicker stimulation. |
Using pictures such as a Lily, the 5-Hz flickering picture stimulation also elicited a high-amplitude PDR similar to that evoked by a flickering dot pattern (54). These PDRs elicited by visual stimuli not only to the full field, but also to the center, periphery, and each hemifield (regional visual stimulation) provide us with useful clinical information (55). Figure 12.4 shows results of 5-Hz fundamental PDRs elicited by regional visual stimulation in a total of 54 adult psychiatric outpatients, from whom patients with epilepsy and cerebral vascular disorders were excluded. We made a power spectral analysis on
occipital PDRs elicited by a 5-Hz flickering dot pattern (6 mm in diameter: 0.5 c/deg) stimulation to the center (11° × 11°), periphery (11° × 11° to 57° × 57°), full field (57° × 57°), and each hemifield with luminance maintained at 10 cd/m2. The average PDR amplitude in response to regional flickering dotpattern stimuli in 28 patients aged over 45 years was higher than the average PDR amplitude in 26 patients aged 20 to 44 years. Amplitudes of PDRs elicited by stimuli to the periphery and lower hemifields were similar to those elicited by a stimulus to the full field. Regarding PDRs elicited by lateral hemifield stimuli, contralateral PDRs were slightly higher than ipsilateral ones, but their difference was not statistically significant. Particular efficiency in eliciting higher PDR by lower hemifield stimulation compared with other hemifield stimuli might be a result of its selective stimulus to the visual cortex, which is located closely beneath electrodes 01 and 02.
occipital PDRs elicited by a 5-Hz flickering dot pattern (6 mm in diameter: 0.5 c/deg) stimulation to the center (11° × 11°), periphery (11° × 11° to 57° × 57°), full field (57° × 57°), and each hemifield with luminance maintained at 10 cd/m2. The average PDR amplitude in response to regional flickering dotpattern stimuli in 28 patients aged over 45 years was higher than the average PDR amplitude in 26 patients aged 20 to 44 years. Amplitudes of PDRs elicited by stimuli to the periphery and lower hemifields were similar to those elicited by a stimulus to the full field. Regarding PDRs elicited by lateral hemifield stimuli, contralateral PDRs were slightly higher than ipsilateral ones, but their difference was not statistically significant. Particular efficiency in eliciting higher PDR by lower hemifield stimulation compared with other hemifield stimuli might be a result of its selective stimulus to the visual cortex, which is located closely beneath electrodes 01 and 02.
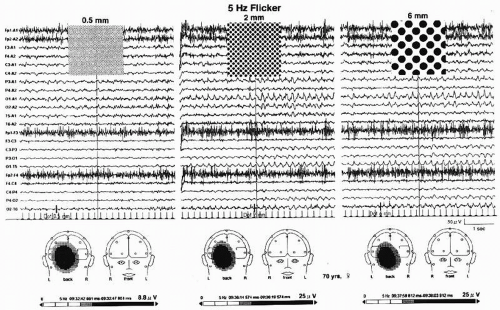 Figure 12.3 EEG changes in response to 5-Hz flickering dot pattern (0.5, 2, and 6 mm in diameter) stimuli to the full-field (30° × 30°) in a 70-year-old woman with benign paroxysmal positional vertigo. Stimulus was provided by use of a square-type strobe-filter method (92); luminance was maintained by 20 cd/m2. Lower tracings show mapping analysis of photic driving responses (PDRs) elicited by each flickering dot pattern. |
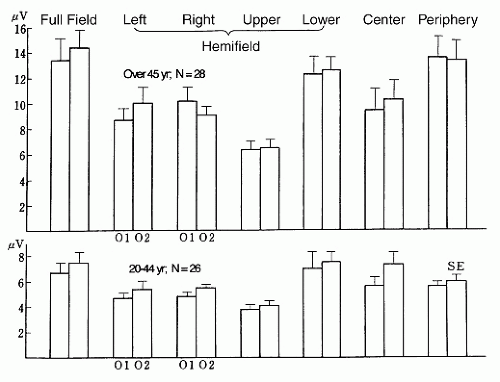 Figure 12.4 Photic driving response (PDR) elicited by regional visual stimuli in 54 adult psychiatric outpatients. We used an SLS-5100 visual stimulator (Nihon Kohden). Power spectral analysis was made on the record for 5 seconds after each 2-second stimulation. Power spectra are 5-, 10-, 15-, 20-, and 25-Hz PDRs; only that of 5-Hz fundamental PDR, which was the greatest, is shown in this figure. The root of each power is expressed for convenience to indicate amplitude. (Modified from Takahashi T. EEG activation by visual stimuli. In: Sato M, Matsuoka H, eds. The Newest Clinical Electroencephalography. Tokyo: Asakura Shoten; 1993:323-344, with permission.) |
A power spectral analysis of PDRs elicited by the above visual stimuli may be used as a new tool for evaluation of drugs influencing the brain (53). Other clinical usefulness of this EEG examination is reported in the following discussion. In a patient with amblyopia, a distinct difference of PDRs evoked by stimulation of 5-Hz flickering dot pattern to each eye was obtained (56); PDRs evoked by hemifield 5-Hz flickering dotpattern stimuli enabled EEG diagnosis of a parietal lobe metastatic brain tumor in a patient who had suffered from breast cancer (57).
PHOTOMYOCLONIC RESPONSE (PHOTOMYOGENIC RESPONSE)
This is a response to IPS characterized by appearance of brief repetitive muscle spikes over anterior regions of the head. These often increase gradually in amplitude as stimulation continues and cease promptly when the stimulus is withdrawn. The response is associated frequently with eyelid flutter, a vertical oscillation of the eyelids and eyeballs; sometimes it is associated with discrete jerking, mostly involving musculature of the face and head (38).
Principal features of this response were first described by Gastaut and Rémond (58) and Bickford et al. (59), who introduced the term photomyoclonic response (PMR), which differs from PPR. Occasionally, a PMR can be seen with a PPR. The most effective triggering IPS frequency lies between 12 and 18 Hz (60). The PMR tends to appear in conjunction with muscular tension. It occurs less often in children than in adults. Gastaut et al. (61) reported that PMR was found in 0.3% of normal subjects, 3% of patients with epilepsy, 13% of patients with brainstem lesions, and 17% of patients with psychiatric disorders. The incidence of PMR in other studies (62, 63, 64 and 65), how-ever, was lower than in that of Gastaut et al., ranging from 0.1% to 0.8%. The PMR is considered to be a nonspecific finding that is not significant for elimination diagnosis of a seizure disorder (66). It is enhanced in early stages of alcohol withdrawal in chronic alcoholics (67) or after sudden withdrawal from barbiturates and related sedatives (68). A symptomatic transient PMR secondary to a metabolic disorder (severe hypocalcemia) can occur (69).
PHOTOPAROXYSMAL RESPONSE (PHOTOCONVULSIVE RESPONSE)
This is a response to IPS characterized by spike-and-wave and multiple spike-and-wave complexes that are bilaterally synchronous, symmetrical, and generalized and that may outlast the stimulus by a few seconds. There may be associated impairment of consciousness and brisk jerks involving musculature of the whole body, most predominantly that of the upper extremities and head (38). Newmark and Penry (66) state that generalized slow activity and posterior spikes are not accepted universally as a PPR, but the significance of these discharges increases if they continue after stimulation is discontinued.
Although PPRs in photosensitive epilepsy patients are elicited by a broad range of IPS frequencies from 1 to 65 Hz (70), the most epileptogenic frequencies are within the range of 15 to 18 Hz (71). PPR is most frequently induced by 15-Hz IPS with eyes closed and 20-Hz IPS when the eyes are open (72). When IPS is given with eyes open, careful attention to eye movement and position is needed because a directional change from central to lateral gaze diminishes the effect of IPS in evoking PPR. This effect is greater than the diminution effect with monocular IPS stimulation as compared with binocular IPS stimulation in eliciting PPR (73). Regarding levels of ambient light, with high-intensity IPS, the effects of normal ambient lighting may be negligible (74). During IPS, the PPR may be induced by eye closure, especially immediately after eye closure (75). Patients with PPR are less sensitive to IPS when asleep (76,77). Generalized PPR may be most pronounced in the frontal, central, or occipital regions. Hishikawa et al. (76) classified generalized PPRs in photosensitive epilepsy patients into PPRs that appear first in the occipital area and PPRs that occur simultaneously over all areas or appear earlier over anterior regions. In the former group, an augmented visual evoked response could be obtained. Generalized PPRs in children are usually rhythmic and higher in amplitude than those seen in adults. Occipital spikes as a sole response to IPS may not be indicative of epilepsy (78). Unilateral occipital spikes are rarely induced by IPS. These patients, as opposed to patients with generalized PPR, often have a history of a local posterior lesion, mostly traumatic. Very rarely, frontal spikes can be provoked by IPS (79).
Jeavons (80) found a PPR in 2.8% of the patients referred for EEG examination, a figure similar to that of Gastaut et al. (61). The patients, whose seizures are induced by visual stimuli such as viewing a visual pattern, television (81), or eye closure, are particularly sensitive to IPS and tend to demonstrate PPR. Gastaut et al. reported that the PPR is almost entirely confined to patients with primary subcortical epilepsy and that it occurs in 40% of cases with absence seizures and in 20% of cases with GTCSs. According to Stevens (82), PPR occurred in 53% of that study’s patients with nonfocal seizures, but in only 3% of that study’s patients with focal seizures. A similar view has also been expressed by Niedermeyer (11), who states that generalized PPRs are more highly associated with primary generalized epilepsy than with incompletely generalized or focal spikes. However, Guerrini et al. (83) proposed a concept called idiopathic photosensitive occipital lobe epilepsy based on detailed analysis of 10 patients with recurrent episodes of visually induced occipital seizures; all seizures were stimulus (mostly television and computer screen) related and began with elementary visual symptoms, followed in most patients by a slow clustering of cephalic pain, epigastric discomfort, and vomiting, with either normal or only mildly impaired responsiveness: all of them showed PPR of types 1 to 4 (see below). The ictal events that may accompany PPR are predominantly absence seizures, GTCSs, and myoclonic jerks, especially of the eyelids or arms (84). Gambardella et al. (85) reported a 17-year-old girl with pure photosensitive epilepsy who showed photic-induced epileptic negative myoclonus (PPR was accompanied by loss of postural tone in both arms). They claim that negative myoclonus should be included among the ictal phenomena accompanying PPR.
Some studies have suggested that presence of PPR may be a familial trait (73,86,87). Doose et al. (86) reported that PPR may be regarded as a symptom of susceptibility to convulsions of the centrencephalic type. In a genetic study of photosensitive epilepsy, Waltz et al. (88) classified PPR into four types: type 1, spikes with occipital rhythm; type 2, parieto-occipital spikes with a biphasic slow wave; type 3, parieto-occipital spikes with a biphasic slow wave and spread to the frontal region; type 4, generalized spikes and waves or polyspikes and waves. They found that type 4 occurred more often in both probands with epilepsy and their siblings than the respective
controls, suggesting that coincidence of photosensitivity will appear as higher if only type 4 is considered to be indicative of photosensitivity. Photosensitivity is age dependent, being highest in late childhood and early adolescence; it is more common in females (86). According to a prospective nationwide study made in Great Britain (89), the annual incidence of cases of epilepsy with type 4 PPR on their first EEG was approximately 2% of all new cases of epilepsy. When restricted to the age range of 17 to 19 years, the annual incidence rose to approximately 10% of all new cases of epilepsy presented in this age range. Analyzing generalized PPRs found in 128 chronic epilepsy patients, De Graaf et al. (90) reported that there was a significantly higher occurrence in whites (2.7%, 72 of 2657) as compared with blacks (0.1%, 1 of 848) and subjects of mixed race (0.9%, 55 of 5958), concluding that genetic rather than environmental factors influence generalized PPR.
controls, suggesting that coincidence of photosensitivity will appear as higher if only type 4 is considered to be indicative of photosensitivity. Photosensitivity is age dependent, being highest in late childhood and early adolescence; it is more common in females (86). According to a prospective nationwide study made in Great Britain (89), the annual incidence of cases of epilepsy with type 4 PPR on their first EEG was approximately 2% of all new cases of epilepsy. When restricted to the age range of 17 to 19 years, the annual incidence rose to approximately 10% of all new cases of epilepsy presented in this age range. Analyzing generalized PPRs found in 128 chronic epilepsy patients, De Graaf et al. (90) reported that there was a significantly higher occurrence in whites (2.7%, 72 of 2657) as compared with blacks (0.1%, 1 of 848) and subjects of mixed race (0.9%, 55 of 5958), concluding that genetic rather than environmental factors influence generalized PPR.
For epileptic seizures triggered by television, photosensitivity remains the most common single mechanism (47). Since the first description of space invader epilepsy by Rushton (91), patients with seizures triggered by electronic screen games (ESGs) such as video, console, and computer games have been reported (92,93). A nationwide study made in Great Britain (94) during 6-month periods identified 118 patients who had a first seizure while playing ESGs when they were 7 to 19 years old. Of 118 patients, 46 and 25 had definite and probable causal relationships, respectively; 47 patients had no such relationship. Within that age group, the annual incidence of first seizure triggered by playing ESGs (71 patients altogether) was estimated to be 1.5/100,000, representing approximately 3% of all new patients with epilepsy in this age range. Of 71 patients, 46 showed type 4 PPR, whereas 25 showed types 1 to 3 PPR. Although photosensitivity is thought to play the most important role in engendering ESG-induced seizures, other circumstances, acting either singly or in combination, should be taken into consideration (95). Examples include (i) seizure precipitation by specific cognitive activities, decision making, hand movements, etc.; (ii) seizure precipitation by nonspecific emotional factors relating to the subjects’ engagement in games, such as anxiety or excitement; (iii) lowering of the seizure threshold by fatigue or sleep deprivation; and (iv) chance occurrence of a spontaneous seizure in a person with epilepsy while playing ESGs. Figure 12.5 illustrates generalized paroxysmal discharges elicited by a video game and generalized PPRs elicited by flickering visual stimuli in a 13-year-old boy who had an ESG-induced GTCSs.
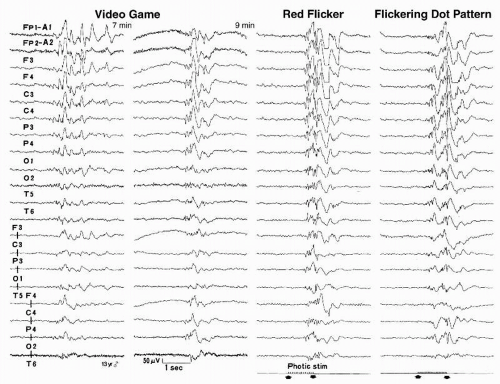 Figure 12.5 Generalized paroxysmal discharges elicited by a video game (Super Tetris 2 + Bombliss) and generalized photoparoxysmal response (PPRs) elicited by flickering stimuli in a 13-year-old photosensitive epilepsy patient. We used a 12-in. television placed 1 m in front of the patient. Full-field (30° × 30°) stimuli of a 15-Hz red flicker and a 25-Hz flickering 1.5 c/deg dot pattern provided by use of square-type strobe-filter method elicited type 4 PPR. Luminance maintained at 20 cd/m2. This EEG was recorded under drug-free conditions. |
Occurrence of a PPR in an otherwise seizure-free individual is uncommon; these patients tend to have attacks of headache or psychological problems, such as personality disorder with hysterical reactions or an anxiety state (60). Incidence of PPR in nonepileptic, apparently normal subjects is estimated at probably less than 2% (66).
Reilly and Peters (64) claim that the following criteria are useful for determining whether or not the patients are epileptic: prolonged PPR (outlasting the stimulus) suggests probable epilepsy (90%), whereas self-limited discharge is not diagnostic. Jayakar and Chiappa (96) studied 35 patients with PPR (1% of all patients seen in an EEG laboratory in a general hospital) and found that 77% had a definite history of epilepsy, 9% a questionable history, and 14% had had no seizures. PPRs were prolonged more than 100 msec beyond the stimulus in 11 patients and self-limited in 24, and the incidence of seizures was not different in the two groups. Furthermore, the PPR prolongation was related to the time at which the stimulus was stopped after the appearance of the PPR—shorter durations of stimulation tended to have longer prolongation.
With respect to the duration of photic stimulation in the clinical EEG laboratory, it should be noted that the technologist must be alert to stop stimulation immediately on identifying a PPR since prolonged stimulation can trigger a GTCS in a sensitive patient. Also, in these patients, once a PPR has been definitely identified, further stimulation should not be attempted as these patients may become more sensitive as stimulation continues or is repeated, and may launch into a seizure with little warning.
Especially in adults without previous seizures and without a family history of seizures, PPR usually suggests a toxic, metabolic, or drug withdrawal state (41,68,97,98). Symmetrical posterior high-amplitude spikes can be evoked at slow IPS rates in patients with diffuse encephalopathies, such as progressive myoclonic epilepsy or Creutzfeldt-Jakob disease (44,99,100).
Spontaneous epileptiform abnormalities (SEAs) are reported to occur in up to 65% of patients with a PPR. Gilliam and Chiappa (101) examined seizure classifications and SEAs in 115 consecutive patients who had a PPR. A PPR was the only epileptiform abnormality in 47 patients (41%), 27 (24%) had focal SEAs, and 41 (36%) had only generalized SEAs. Seventeen patients (15%) had partial seizures and 40 (35%) had only generalized seizures, and seizure classification was strongly associated with the type of SEA (P < 0.0001). Although the PPR is often presumed to signify primary generalized epilepsy, most patients with a PPR and focal SEAs have partial seizures. This is perhaps an indication that the presence of an underlying generalized hyperexcitability, possibly related to a channelopathy (for example), enhances the likelihood that a focal lesion will generate an electrophysiologic abnormality.
Several conditions are known to alter PPR. As described above, PPR is often associated with eye closure and is most likely to occur immediately after eye closure. This effect may also result from movement of the eyelids or of the eyes themselves. In addition, eye closure may produce activation by suddenly eliminating the visual pattern and by causing the field of vision to become red-hued (102,103). When stimuli are presented with the eyes open, a patterned field of vision (or flickering geometric pattern) has been found to be more effective than a homogeneous field (or white light flicker) in eliciting PPR (75,104,105). In addition, saturated long-wavelength red (red) facilitates induction of PPR (106,107). An EEG activation by use of red flicker and flickering geometric pattern stimuli, which were given only in “eyes-open” conditions, revealed a higher rate of PPR provocation than by ordinary stroboscopic IPS (51). (In the former method, an SLS-5100 visual stimulator (50) was employed and luminance maintained at 20 cd/m2.) Additional studies (108,109) have disclosed that elicited PPRs were found in 18% of epilepsy patients, suggesting that incidence of photosensitivity in epilepsy patients is 3.6 times higher than that of the commonly accepted 5% reported by Binnie and Jeavons (110). Figure 12.6 shows a circular-type strobe filter (93,111), which is a simple device that is capable of inducing similar activation effects to the SLS-5100 visual stimulator. Using strobe filters, visual stimuli (red flicker and flickering geometric pattern, luminance kept at 30 cd/m2) are easily presented to patients. Their stimulus luminance is far less intense than that of a stroboscopic IPS. In addition to examining photosensitivity with an ordinary strobe, such low-luminance visual stimuli may be required for precise examination of photosensitive epilepsy patients.
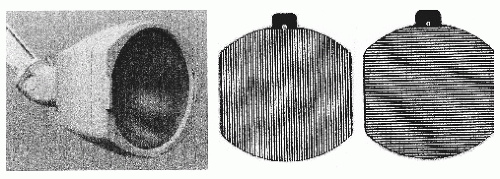 Figure 12.6 A flash lamp and circular-type strobe filter. Luminance of direct stroboscopic intermittent photic stimulation (IPS) by use of LS-706A (Nihon Kohden), as shown in the left tracing, is 3,939 20 cd/m2. Inserting a vertical grating pattern (middle tracing) along the filter holder on the front of the flash lamp as shown in the left tracing greatly reduces luminosity to 30 cd/m2 and spatial frequency of each pattern filter is 2 c/deg. Using this filter, the weakest possible stimuli of red flicker and pattern flicker ought to be used, taking great care not to induce clinical seizures in photosensitive individuals; one might, for example, start stimuli from lower flicker frequencies and terminate examinations when PPR appear (92). |
Chiappa et al. (112) and Hill et al. (113) used functional magnetic resonance imaging (fMRI) and magnetic resonance spectroscopy (MRS) to study metabolic and hemodynamic consequences of photic stimulation-triggered and spontaneous generalized epileptiform discharges in humans. EEG recordings were performed in the MR scanner during photic stimulation in normal subjects and patients with PPR. There were no fMRI-registered hemodynamic abnormalities found in relation to the brief PPR seen in the patients. However, irrespective of the presence of a PPR, these patients showed four unique findings compared with normal subjects: (i) slightly but significantly increased lactate levels in the occipital cortex in the resting state, (ii) an increased area of visual cortex activation with photic stimulation, (iii) noncontiguous areas of signal attenuation,
simultaneous with the occipital cortex stimulus-induced increased fMRI signal, most prominent in perirolandic regions, and (iv) a marked decrement (undershoot) of fMRI signal intensity immediately after the photic stimulation in the occipital cortex and in the region of the posterior cingulate gyrus. These findings suggest abnormal interictal metabolism and increased vascular reactivity in the photosensitive patients.
simultaneous with the occipital cortex stimulus-induced increased fMRI signal, most prominent in perirolandic regions, and (iv) a marked decrement (undershoot) of fMRI signal intensity immediately after the photic stimulation in the occipital cortex and in the region of the posterior cingulate gyrus. These findings suggest abnormal interictal metabolism and increased vascular reactivity in the photosensitive patients.
Along with PPR, another term in use is photoepileptiform response (PER). This response is elicited by photic stimulation. According to their topography, they are divided into the following three categories (8): (i) anterior dominant or generalized (bisynchronous and approximately symmetrical); (ii) occipital dominant (bisynchronous and approximately symmetrical); and (iii) occipital dominant and localized (unilateral or strongly lateralized). The category 1 PPR is one form of PER and is most closely associated with epilepsy.
OTHER FORMS OF SENSORY STIMULATION
Visual Stimulation
Various visual stimuli other than IPS may provoke PERs. The simple maneuver of eye closure induces posterior slow-wave transients, especially in children (114,115), and may also provoke paroxysmal discharges (116,117). Paroxysmal discharges similar to PPR seen in photosensitive epilepsy patients may even be induced by slow closure of the eyelids (118). In the act of eye closure carried out in a lighted room, lights off and homogeneous visual field (ganzfeld) (119, 120 and 121) are considered to play significant roles as visual stimuli in producing paroxysmal discharges. In fact, posterior sharp waves or spikes can be seen occasionally after or at the onset of IPS; these are called off-response and on-response, respectively (73,122). Spike-wave discharges associated with seizures can rarely be induced by a single-flash light stimulus (102). Paroxysmal discharges may be evoked by red light alone (93,119,123). Darkness may also induce paroxysmal discharges (124,125). Similar paroxysmal discharges produced by ganzfeld and total darkness have been reported by Panayiotopoulos (126,127), who called it fixation-off sensitivity (FOS); this unpatterned vision can be obtained either through +10 spherical lenses or through underwater goggles covered with semitransparent paper. He claims that FOS is suspected if EEG abnormalities appear and persist as long as the eyes remain closed and disappear when the eyes are opened. In such cases, EEG abnormalities of FOS can be elicited by elimination of central vision and fixation; FOS is related to eyes-closed, not eye-closure EEG abnormalities. According to Panayiotopoulos (126,127), the incidence of FOS-related EEG abnormalities appears to be as frequent as that of PPR in children younger than 12 years of age; FOS is probably more frequently associated with benign childhood epilepsy with occipital paroxysms than with any other epileptic condition.
Related posts:
 Dynamics of EEGs as Signals of Neuronal Populations: Models and Theoretical Considerations
EEG of Degenerative Disorders of the Central Nervous System
Metabolic Disorders and EEG
Anticipating Seizures Based on EEG
Intracranial Monitoring: Depth, Subdural, and Foramen Ovale Electrodes
EEG Event-Related Desynchronization (ERD) and Event-Related Synchronization (ERS)
Dynamics of EEGs as Signals of Neuronal Populations: Models and Theoretical Considerations
EEG of Degenerative Disorders of the Central Nervous System
Metabolic Disorders and EEG
Anticipating Seizures Based on EEG
Intracranial Monitoring: Depth, Subdural, and Foramen Ovale Electrodes
EEG Event-Related Desynchronization (ERD) and Event-Related Synchronization (ERS)
Stay updated, free articles. Join our Telegram channel

Full access? Get Clinical Tree


