Metabolic Disorders and EEG
Trudy Pang
Megan Selvitelli
Donald L. Schomer
Ernst Niedermeyer
INTRODUCTION AND HISTORICAL REMARKS
Neuronal electrogenesis is dependent on metabolic homeostasis. Nutritive and energy-providing metabolic systems represent the fuel for neuronal and glial structures and abnormalities in their composition may lead to pronounced clinical and electroencephalographic changes. These changes are usually reversible, but sometimes irreversible progression ensues.
Cerebral metabolic disturbances and/or electroencephalogram (EEG) changes due to blood alkalosis from hyperventilation and anoxia are presented elsewhere. This chapter deals mainly with alterations of blood sugar levels, failure of the hepatic and renal organ systems, states of electrolyte imbalances, changes due to endocrine disorders, and certain toxicmetabolic conditions. Some chronic metabolic disturbances, such as inborn errors of metabolism, are discussed under the heading of degenerative disorders.
Berger’s observation of slow EEG activity induced by hypoglycemia in schizophrenic patients treated with insulin marked the beginning of EEG studies in human metabolic disorders (1). Over the ensuing years, EEG studies in metabolic disorders remained somewhat in the background when compared with the activity in the fields of epileptic seizure disorder and structural cerebral lesions. Most of the metabolic disorders belong to the domain of internal medicine, a field of understandably limited interest in EEG investigations.
Major progress was made when the work of Foley, and Bickford and Butt on hepatic coma showed very pronounced slowing and formation of triphasic waves (2,3). The contributions of Condon, Krump, Thiebaut, Cadilhac, and Glaser have provided further important information on the EEG correlates of metabolic encephalopathies (4, 5, 6, 7 and 8).
There has been persistent interest in the EEG of metabolic disorders. This is probably due to the discovery of renal encephalopathies after dialysis in chronic renal insufficiency (9). Furthermore, EEG monitoring techniques are now being used to study the evolution of hepatic encephalopathy and the requirement for and efficacy of hepatic and renal transplantation.
HYPOGLYCEMIA
Cerebral functioning depends on an adequate supply of glucose. Hypoglycemia-induced EEG changes have been shown experimentally by Moruzzi, Himwich, Gellhorn and Kessler, and Davis (10, 11, 12 and 13). It was found that the electrical activity of the cortex disappears earlier than that of deep structures. Level of awareness, blood sugar level, and EEG changes do not necessarily parallel each other (12).
Early clinical EEG observations were reported by Berger, Davis, Hoagland, Gibbs, Engel, Weinland and Weinland, Lafon, Gibbs and Murray, Hetzel and Niedermeyer, Shagass and Roswell, and Regan and Browne-Mayers (1,13, 14, 15, 16, 17, 18, 19, 20, 21 and 22). It was found that very low blood sugar levels were compatible with a normal EEG and also with wakefulness (23). Clinical observations had already shown that impairment of consciousness and disturbance of central nervous system (CNS) functions were dependent mainly on the rapid fall of the blood sugar level, rather than on absolute values (24). Patients with insulin-dependent diabetes mellitus may be unaware of hypoglycemia. Their nearly normal glycosylated hemoglobin levels result in normal cerebral glucose uptake and preserved cerebral metabolism (25). Most of the aforementioned work was based on administration of insulin for therapeutic purposes in schizophrenic patients (Sakel cure).
All of this work shows an extremely impressive degree of slowing in the EEG. In particular, the EEG demonstrates a decrease in alpha and an increase in theta and delta frequencies with increasing hypoglycemia. Most often this is most marked in the frontal region (26,27). In some patients, hypoglycemia may also promote epileptiform discharges (28). Sperling found that induced hypoglycemia in medically refractory complex partial epilepsy patients may activate or accentuate temporal lobe slowing and epileptiform discharges (29). In a more controlled manner, induced hypoglycemia in adult cats results in an initial diffuse slowing of the EEG, followed by occasional spike waves and then near-isoelectric activity (30). Along this continuum and commonly seen in diabetic patients, Kirchner and colleagues demonstrated that induced hypoglycemia results in a faster onset of seizures in rats exposed to flurothyl, which corresponded with implanted hippocampal depth electrode recorded discharges (31).
Spontaneous states of hypoglycemia may mimic complex partial seizures, due to the concomitant impaired neuropsychiatric state. However, the prolonged nature of these attacks, atypical semiology, unresponsiveness to anticonvulsant therapies, and provocation by fasting helps to differentiate between these possibilities. Wang and fellow researchers recently demonstrated an initial theta and delta slowing on the EEG, followed by sporadic spike and sharp waves during a patient’s typical attacks. Intravenous glucose administration terminated the event (32). Prolonged fasting may be required to confirm the
diagnosis of an insulinoma, which requires surgical removal to promote cessation of events (33). Thus, the hypoglycemic attacks induced by an insulinoma may result initially in impaired cognition, while increasing hypoglycemia may promote spike-wave discharges and seizures.
diagnosis of an insulinoma, which requires surgical removal to promote cessation of events (33). Thus, the hypoglycemic attacks induced by an insulinoma may result initially in impaired cognition, while increasing hypoglycemia may promote spike-wave discharges and seizures.
HYPERGLYCEMIA
Hyperglycemic states are much less eloquent and predictable in their EEG manifestations than are states of hypoglycemia. Gibbs and colleagues found mixed slow and fast frequencies and some intermingled spiking in patients with blood sugar levels exceeding 400 mg/100 mL (15). In advanced diabetic coma, however, very pronounced slowing may occur, and the record may become indistinguishable from a hypoglycemic state (6). According to Cadilhac and colleagues, the EEG abnormalities may persist for several days despite effective treatment (4). Occasionally, epileptogenic lesions may result from comatose states, but such sequelae are more likely to be caused by the hypoglycemic state rather than hyperglycemic state (34).
A distinction has to be made between ketotic and nonketotic hyperglycemia. The latter entity was described by DiBenedetto and colleagues and appears to be rich in neurologic complications (35). Epileptic seizures of focal character are common in this condition (36, 37 and 38), as are, above all, focal motor seizures with rolandic EEG spike foci and contralateral clonic motions (39,40). The focal motor seizures may be movement induced (41,42). Other focal seizures including visual hallucinations with forced head and eye deviation and aphasia may also rarely occur (43, 44 and 45). The hyperglycemic states do not have to be nonketotic in order to cause focal seizures, but in such cases, a ketotic nonacidotic situation is found (36). Correction of the hyperglycemic state with insulin, rather than treatment with anticonvulsant medications, controls the epileptic seizures.
LIVER DISEASE (HEPATIC ENCEPHALOPATHY)
Liver disease may produce variable degrees of EEG abnormalities, from mild slowing to isoelectric activity. The presence or absence of notable EEG changes is dependent on the pathophysiologic mechanisms involved. For this reason, some discussion of the pathophysiologic mechanisms and their clinical expression is needed.
A distinction must be made between the concept of hepatic encephalopathy and acute massive hepatic cellular failure. Portal-systemic hepatic encephalopathies are based on a portocaval anastomosis, whereby protein from gastrointestinal venous absorption bypasses hepatic metabolism and is carried to the systemic venous system. This condition is found in chronic cirrhosis of the liver with portal-systemic venous shunts. In contrast, acute fulminant hepatic failure results in sudden hepatocellular breakdown and dysfunction. In both situations, toxic (mainly nitrogenous) substances reach the brain and contribute to the cerebral pathology and clinical symptoms described below. In advanced stages, the distinction between both the pathophysiologic and EEG changes of a full-fledged hepatic coma becomes indistinguishable, regardless of the mechanism (9).
Patients presenting with hepatic encephalopathy demonstrate a notable decline in mental functions, including constructional apraxias, increased reaction times, and impaired memory and concentration (46,47). In addition, altered personality traits may occur, such as apathy, euphoria, childishness, and irritability. Motorically, patients demonstrate bradykinesia, asterixis, parkinsonian traits, and pyramidal signs, which may be present before hypo- and hyperreflexia emerge in profound coma (46). The level of consciousness decreases from confusion to lethargy and may progress to deep coma with unresponsiveness. The concept of minimal hepatic encephalopathy has also been raised, in which patients appear clinically normal, with subtle deficits on neuropsychiatric testing, including changes in attention and psychomotor speed (47). The demonstration of minimal hepatic encephalopathy may correlate with decreased ability to drive and decreased quality of life.
The biochemical and neuropathologic mechanisms of hepatic encephalopathy are still being elucidated. Hyperammonemia and glutamate alterations are strongly suspected in both acute and chronic hepatic encephalopathy, as is the role of increased GABA tone. Shawcross and Jalan summarized the ammonia hypothesis, detailing the role of hyperammonemia in contributing to increased astrocytic pH that results in calcium-dependent release of glutamate, which contributes to NMDA activation and excitotoxicity (47). In contrast, with chronic liver disease, hyperammonemia contributes to decreased chronic astrocytic glutamate stores, resulting in inactivation of the glutamate transporter and decreased postsynaptic glutamate receptors on neurons and astrocytes, thereby contributing to increased cerebral inhibition. However, these authors also note that there is increased GABAergic cerebral tone that also contributes to chronic cerebral inhibition in liver cirrhosis. Ahboucha and Butterworth reviewed PET studies that suggest a role for increased GABAA receptor activation, also resulting in increased postsynaptic neuron inhibition (48). Neuropathologic correlates of acute and chronic liver disease include astrocytic and cytotoxic edema with the former and Alzheimer II astrocytic change in the latter (47).
The altered pathophysiology of hepatic encephalopathy may be demonstrated by both evoked potentials and brain MRI, as well as EEG. The varying dynamics of cognitive brain dysfunctions are mirrored by altered event-related P300 potentials, even with a minor degree of dysfunction and with less sensitivity to medication use than the EEG (49). Even in the absence of overt hepatic encephalopathy, brain MRI may be abnormal and demonstrate low-grade cerebral edema (50).
The electroencephalographic changes of hepatic encephalopathy have been well known since the studies of Foley et al. and Bickford and Butt (2,3). The degree of slowing often parallels the level of blood ammonia (51). Similarly, the degree of EEG slowing correlates with severity of liver disease (52). Amodio and Gatta summarized the common changes associated with hepatic encephalopathy, including low-frequency alpha background rhythms with sudden intermittent random theta waves superimposed in either a temporal, frontal, or generalized distribution
(53). Subsequently, slow theta background activity may predominate (3,9,54, 55, 56 and 57). As the clinical presentation worsens, the EEG may progressively show more disorganization with diffuse and asynchronous theta and delta slowing over both hemispheres. With severe coma, the background activity may decrease in amplitude and frequency to the point of becoming isoelectric (53,58). Girier and colleagues investigated the EEG findings in fulminant hepatic failure in children and described the stages of progressive EEG deterioration (59). Inferences with regard to the need for liver transplant can be made on the basis of the EEG findings. Figure 21.1 demonstrates the mild-to-moderate degree of slowing that may be seen with hepatic encephalopathy, while Figure 21.2 demonstrates more marked slowing.
(53). Subsequently, slow theta background activity may predominate (3,9,54, 55, 56 and 57). As the clinical presentation worsens, the EEG may progressively show more disorganization with diffuse and asynchronous theta and delta slowing over both hemispheres. With severe coma, the background activity may decrease in amplitude and frequency to the point of becoming isoelectric (53,58). Girier and colleagues investigated the EEG findings in fulminant hepatic failure in children and described the stages of progressive EEG deterioration (59). Inferences with regard to the need for liver transplant can be made on the basis of the EEG findings. Figure 21.1 demonstrates the mild-to-moderate degree of slowing that may be seen with hepatic encephalopathy, while Figure 21.2 demonstrates more marked slowing.
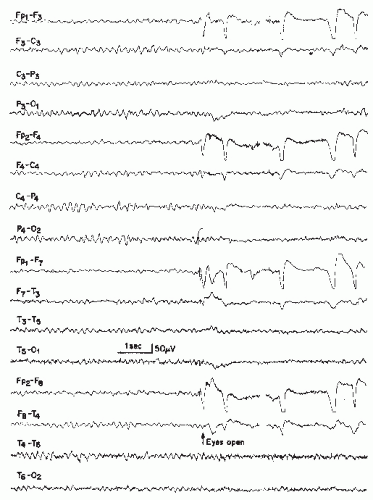 Figure 21.1 Hepatic encephalopathy in a 59-year-old patient. The EEG demonstrates moderate slowing of the background rhythm (5 to 6 Hz), with some intermixed 8 to 10 Hz alpha waves of lower voltage. |
Bickford and Butt introduced the term triphasic waves, classically described as moderate to high-amplitude slow waves occurring with a frequency of 1.5 to 3 Hz with an initial sharp positive transient, followed by a smaller negative component (Figs. 21.3 and 21.4) (3). The discharges are often noted to have a frontal to occipital delay in expression, occur singly or in runs lasting 0.5 to 2 seconds, and arise from a slowed and disorganized background (60). Triphasic waves may be seen in fully awake patients or may commonly occur with worsening cognitive status. However, these waveforms resolve with sleep. In general, the incidence of triphasic waves in hepatic encephalopathy lies around 25% (57,61,62).
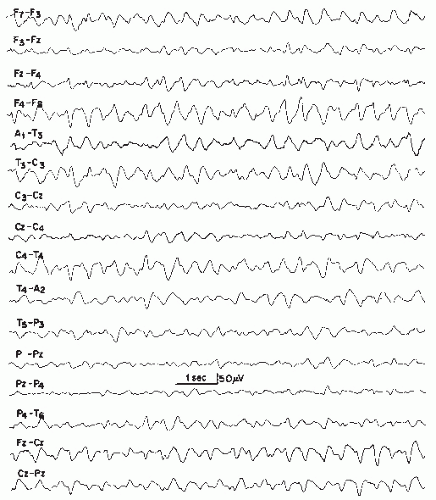 Figure 21.2 Hepatic encephalopathy in a 42-year-old patient. Predominant activity around 2.5 Hz, most notable over the frontocentral regions. Several triphasic waves are seen in channels 4 and 15 of the right portion of the tracing. |
More recently, several authors have questioned the diagnostic specificity of triphasic waves for hepatic encephalopathy. Fisch and Klass demonstrated triphasic waves in numerous conditions, including stroke, hypertensive encephalopathy, hyper/hyponatremia, hypercalcemia, hypoglycemia, encephalitis, cerebral abscess, septic shock, dementia, lithium toxicity, and the postictal state. However, no specific characteristic of the triphasic wave morphology could reliably differentiate the etiology of the triphasic wave from the possibilities noted above (63). Aguglia and colleagues and Blatt and Brenner similarly noted the occurrence of triphasic waves with etiologies ranging from stroke, brain tumors, Binswanger’s subcortical encephalopathy, and lithium-treated aged psychiatric patients (64,65). More recently, Kenangil and colleagues and Eriksson
and Wictor also described the occurrence of triphasic waves with bilateral paramedian thalamic stroke and CNS Lyme disease, respectively (66,67). Karnaze and Bickford also reviewed the medical records of patients whose EEGs demonstrated triphasic waves (68). Of the 50 patients identified, more than half had hepatic encephalopathy as the likely etiology of the triphasic waves. However, other associated conditions included renal failure (10), anoxia (9), hyperosmolarity (2), and hypoglycemia (1). Of note, only 43% of hepatic encephalopathy patients demonstrated all the diagnostic features of triphasic waves noted above.
and Wictor also described the occurrence of triphasic waves with bilateral paramedian thalamic stroke and CNS Lyme disease, respectively (66,67). Karnaze and Bickford also reviewed the medical records of patients whose EEGs demonstrated triphasic waves (68). Of the 50 patients identified, more than half had hepatic encephalopathy as the likely etiology of the triphasic waves. However, other associated conditions included renal failure (10), anoxia (9), hyperosmolarity (2), and hypoglycemia (1). Of note, only 43% of hepatic encephalopathy patients demonstrated all the diagnostic features of triphasic waves noted above.
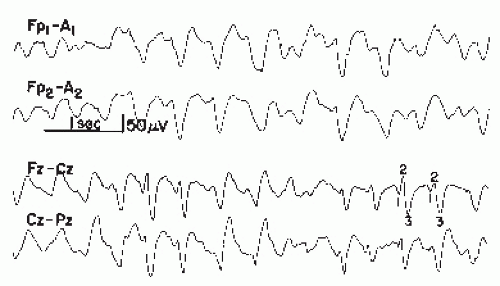 Figure 21.3 Examples of triphasic waves taken from two patients with hepatic encephalopathy. Note wave morphology. The numbers 1, 2, and 3 indicate the phase of the triphasic wave. |
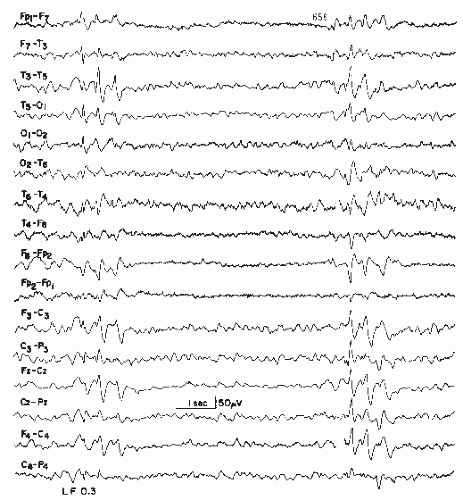 Figure 21.4 Triphasic waves of unusually paroxysmal configuration in a 59-year-old patient with hepatic encephalopathy and no history of seizures. Also note the distribution of the potentials and a posterior maximum of the triphasic waves; this is not altogether uncommon. |
The presence of triphasic waves appears to be a poor prognostic indicator. Karnaze and Bickford found that patients with triphasic waves experienced mortalities ranging from 30% with renal encephalopathy, 60% with hepatic encephalopathy to 100% with anoxia (68). Bahamon-Dussan and colleagues similarly found that patients with triphasic waves, regardless of etiology, had a 50% 1-month mortality rate and 77% mortality rate at 22 months of follow-up (69). However, these studies were performed over 20 years ago and advances in medicine may have lowered the mortality rates associated with these conditions. No recent evaluation of the prognostic significance of triphasic waves has been published.
Quantification of EEG data has been done by some authors (9,55,70, 71, 72, 73, 74 and 75). Amodio and colleagues recently compared different EEG hepatic encephalopathy classification systems (modified Parsons-Smith, Conn’s, spectral analysis according to Van der Rijt and ANNES [artificial neural network expert system]) to assess for correlations between the individual classification schemes with neuropsychiatric test results, severity of liver disease, biochemical indices of liver function, and risk of death (76). While all classification schemes, including visual assessment and spectral analysis, were appropriately correlated with these variables, the greatest reliability was noted with automatic quantification systems. In addition, spectral EEG analysis has also been used to identify minimal hepatic encephalopathy features, including an increase in theta power in the posterior divisions and less commonly a decrease in mean dominant frequency and increase in relative delta power (53).
EEG spectral analysis may help identify the initial changes associated with minimal hepatic encephalopathy, and the EEG may assist with the prognosis and treatment response to liver transplantation. Interestingly, while spectral EEG analysis may improve after orthotopic liver transplantation, neuropsychiatric impairments may remain. As cerebral disturbances after liver transplant are not uncommon, caused by factors such as general anesthetics, impaired liver function, sepsis, or hypoxia (77), the EEG may be useful in the assessment of cerebral dysfunction and possible electrographic seizures. In addition, the EEGs of post-transplant patients who do not survive demonstrate a greater incidence of epileptiform abnormalities than survivors (78). Thus, the EEG may assist with the differential diagnosis of post-transplant cerebral disturbances and assist with post-transplant prognosis.
Despite the paroxysmal appearance of triphasic waves, clinically overt epileptic manifestations are not very common with hepatic encephalopathy and occur much less frequently than in renal encephalopathies (79, 80 and 81). Surprisingly, however, Adams and Foley found an approximately equal incidence of seizures in renal and hepatic failure (82). Similarities between triphasic waves and spike-wave complexes cannot be denied. The boundaries between these abnormalities were discussed by Hughes, Klass, and Ghigo (83, 84 and 85). Ficker et al. demonstrated various forms of spikes, focal sharp waves, and generalized spike waves in patients with hepatic encephalopathy (86). These patients also had epileptic seizures and poor outcomes. In addition, Eleftheriadis and colleagues also discussed the case of a gentleman presenting with continuous generalized tonic-clonic seizures in the setting of decompensated hepatitis C liver cirrhosis (87). Therefore, a continuum of epileptiform discharges and electrographic seizures may be seen with hepatic encephalopathy.
Chronic hepatocerebral degeneration may lead to a variety of EEG changes. The acquired form is neurologically characterized by dysarthria, ataxia, intention tremor, and choreoathetosis affecting chiefly the cranial musculature (88,89). This clinical entity is considered to occur much more frequently than the familial form (Wilson disease) (88). The acquired form may develop in various chronic liver diseases and often leads to the above-described picture of hepatic encephalopathy. Such a development is less common in Wilson disease. Nevsimalova and colleagues found only mild alterations in EEG recordings of patients diagnosed with Wilson disease, with predominantly generalized intermittent theta or delta slowing, occasionally with associated sharp waves (90). Only 21% of patients demonstrated focal findings, of which 15% demonstrated focal
epileptiform discharges. Giagheddu and colleagues noted abnormal EEGs in only 3 of 23 patients studied. These recordings demonstrated temporal theta slowing, left paramedian epileptiform activity (in a patient with a prior thalamotomy), and diffuse slow activity with triphasic waves (in a patient experiencing symptoms of hepatic encephalopathy) (91).
epileptiform discharges. Giagheddu and colleagues noted abnormal EEGs in only 3 of 23 patients studied. These recordings demonstrated temporal theta slowing, left paramedian epileptiform activity (in a patient with a prior thalamotomy), and diffuse slow activity with triphasic waves (in a patient experiencing symptoms of hepatic encephalopathy) (91).
RENAL DISEASE (RENAL ENCEPHALOPATHY, UREMIA)
Various gradations of EEG abnormalities have been reported in both acute as well as chronic renal failure and may potentially be reversed with renal transplantation.
In acute uremia, the neurologic picture is characterized by agitation, confusion, tremor, fasciculations, myoclonus, and coma (92). The EEG may demonstrate irregular low-voltage activity with slowing of the posterior basic rhythm and occasional theta bursts. Other cases show prolonged bursts of bilateral synchronous mixed slow and sharp activity or frank spikes. Bilateral spike discharges may or may not be associated with widespread myoclonic jerking. Grand mal and partial seizures as well as infrequent nonconvulsive status epilepticus may develop (93,94). About 10% to 30% of patients with renal insufficiency develop epileptic seizures (95, 96 and 97). Seizures are usually due to water-electrolyte imbalance (98,99), although they may also occur in the setting of medication side effects, infection, malignant hypertension, or dialysis disequilibrium (95,96).
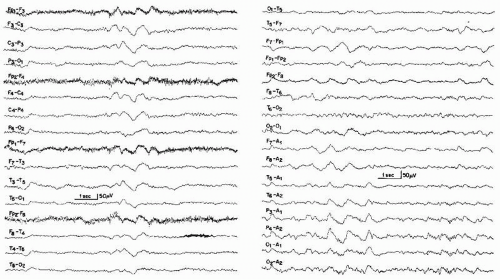 Figure 21.5 Left: Encephalopathy due to chronic renal failure (age 50 years). Note intermittent runs of delta slowing. Right: The same patient in sleep. Trains of delta waves with superimposed spindles, not exceeding the normal limits of variability. The tendency toward normalization in sleep is found in most forms of metabolic encephalopathy. |
In chronic uremia, patients may experience decreased energy, poor memory, irritability, and agitation (100). The EEG most typically demonstrates a slow and disorganized background, with more pronounced slowing associated with worsening symptoms of uremia and a prior history of malignant hypertension (101, 102, 103, 104, 105 and 106) (Fig. 21.5). While Hughes noted the closest parallel between increased urea concentrations and more marked background slowing, this association was minimal and of limited clinical significance (100). Rarely, theta discharges, sharp waves, and polyspike and wave complexes are noted (103,104). Photic stimulation may result in photomyoclonic or photoparoxysmal responses (103). Notably, children with chronic uremia similarly demonstrate an increase in theta and delta and a decrease in beta activity with spectral EEG analysis (107), while only 20% of children demonstrate low-amplitude spikes or bilateral frontocentral spike and wave discharges (108).
Related posts:
 Dynamics of EEGs as Signals of Neuronal Populations: Models and Theoretical Considerations
Activation Methods
Dementia and EEG
Anticipating Seizures Based on EEG
Intracranial Monitoring: Depth, Subdural, and Foramen Ovale Electrodes
EEG Event-Related Desynchronization (ERD) and Event-Related Synchronization (ERS)
Dynamics of EEGs as Signals of Neuronal Populations: Models and Theoretical Considerations
Activation Methods
Dementia and EEG
Anticipating Seizures Based on EEG
Intracranial Monitoring: Depth, Subdural, and Foramen Ovale Electrodes
EEG Event-Related Desynchronization (ERD) and Event-Related Synchronization (ERS)
Stay updated, free articles. Join our Telegram channel

Full access? Get Clinical Tree


