Polygraphy
Anton Kamp
Gert Pfurtscheller
Günter Edlinger
Fernando H. Lopes Da Silva
Polygraphy denotes the simultaneous recording of several physiologic and/or behavioral variables. The main reasons for the simultaneous recording of several variables are to obtain information on behavioral aspects and to differentiate artifacts in the electroencephalographic (EEG) data. These objectives usually do not require precise representation; in many instances, the relevant information concerns only the occurrence of a certain phenomenon or is easily obtained from clearly discernible characteristics of a variable. Therefore, most polygraphic data of interest in EEG studies can be obtained using simple recording methods that allow appreciable distortion of the original data. If, however, the polygraphic variables are of primary concern, then sophisticated and precise recording methods are necessary. In view of the techniques used and the interpretation of the recorded data, these methods go far beyond the simple polygraphic methodology commonly applied to EEG studies. This chapter discusses these simple methods and presents a number of examples of variables that are of interest in certain EEG studies. A classic survey of variables of interest in polygraphic studies and of corresponding recording methods can be found in Manual of Psychophysiologic Methods, edited by Venables and Martin (1).
In practice, polygraphic recordings are made with an EEG apparatus; this may be of primary interest for determining the temporal relations between the EEG and the other signals, which reflect different physiologic functions and/or behavioral states. Unfortunately, the frequency characteristics and the magnitude ranges of many signals of interest for polygraphic studies fall outside those provided by a conventional EEG recording system; moreover, they might not be recordable due to the electrical characteristics of the input circuit of the EEG recorder. Such signals, therefore, require special provisions, such as the use of specialized preamplifiers or input couplers to obtain an adaptation or a conversion; in this way, the recording of such signals can be carried out with the EEG apparatus. Many variables of interest in polygraphic studies, such as blood pressure, respiratory parameters, temperature, and electrodermal signals, vary slowly as a function of time; therefore, their recording requires highly sensitive universal direct current (DC) amplifiers that are equipped with means of sensitivity control and adjustable high- and low-pass filters for selection of the appropriate frequency response. Modern EEG recorders have low sensitivity auxiliary input terminals that also permit DC recording; these inputs can be used to record other signals of sufficiently large amplitude (e.g., in Fig. 40.8, the traces indicated by EDG, STIM, BUTTON PRESS, and TIME CODE). When the EEG is used to record different physiologic and/or behavioral variables simultaneously, employing separate recording systems, the time relations between the various types of signals must be preserved by using a form of time indexing or time marking on both recording media.
CARDIOVASCULAR VARIABLES
Electrocardiogram and Heart Rate
There are several reasons for recording the electrocardiogram (ECG) simultaneously with the EEG. It may be desirable in specific cardio- or cerebrovascular studies. In most cases, however, the ECG recording is not intended to carry out a vascular study but only serves as an indicator of ECG artifacts in EEG records or as a general parameter of vegetative functions; in these latter circumstances, one is mainly interested in the heart rate (HR). An ECG can be recorded perfectly using an EEG system because the electrical characteristics of its input circuit and the provisions commonly available for adjustment of frequency response and gain are adequate. The bandwidth required for appropriate ECG recording goes from 0.8 to 60 Hz; the recording sensitivity required is approximately 1 mV/cm using conventional ECG electrode placements. When the ECG electrodes are placed on the chest wall, a higher sensitivity may be necessary. The subject’s behavioral activities might lead to artifacts in the ECG record, owing to muscular activity or electrode motion. The latter can be reduced significantly by using an appropriate type of electrode, such as cup electrodes with a jelly bridge between skin and electrode surface. Interference caused by electromyographic potentials can be minimized by choosing electrode positions carefully and lowering the high-frequency response of the recording system (20 Hz; 3 dB) in order to attenuate the high-frequency electromyogram (EMG) potentials. High-frequency filtering can be obtained by means of the EEG apparatus’s adjustable high-frequency filters.
HR recording is best carried out by using a series of pulses generated at the top of clearly distinguishable R waves of the ECG. If, however, owing to less favorable electrode positions, the R wave cannot be easily distinguished, extra signal processing must be applied. This processing may consist of high-pass filtering and/or the introduction of a refractory period, during which the instrument is insensitive. Commercially available heart frequency meters or HR counters usually have such provisions. HR measurements may be given in terms of the number of beats over a certain period of time (HR) or in terms of heart period (HP), the average interval between a number of successive heartbeats. Because HR and HP are reciprocal, the
instrument, although calibrated in terms of HR, may have a meter deflection or another output signal proportional to Tint, the interval between successive heartbeats. In the available instruments, HR is more commonly presented than HP. In some applications of polygraphy, the main interest is not in the nominal HR but rather in HR changes and the relation to other physiologic, psychological, or behavioral variables. So that relatively small HR changes can be distinguished, the recording is best carried out with a preadjusted preset HR value. The model given in Figure 40.1 demonstrates a simple method for subtracting a preset value from the HR meter’s electrical output.
instrument, although calibrated in terms of HR, may have a meter deflection or another output signal proportional to Tint, the interval between successive heartbeats. In the available instruments, HR is more commonly presented than HP. In some applications of polygraphy, the main interest is not in the nominal HR but rather in HR changes and the relation to other physiologic, psychological, or behavioral variables. So that relatively small HR changes can be distinguished, the recording is best carried out with a preadjusted preset HR value. The model given in Figure 40.1 demonstrates a simple method for subtracting a preset value from the HR meter’s electrical output.
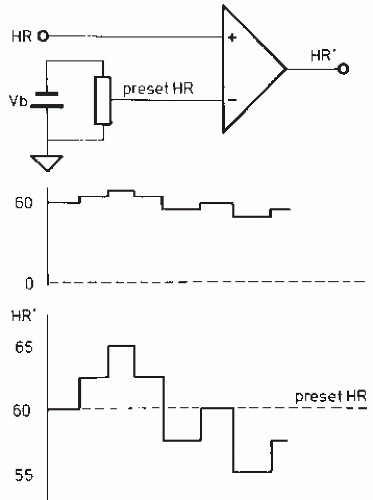 Figure 40.1 Method for recording instantaneous heart rate (HR); the momentary heart period (HP) value, transformed into HR, is plotted in relation to an adjustable preset mean HR value. |
Plethysmography
Plethysmography is the measurement of the variations in organ or limb volume due to changes in the quantity of blood it contains. Because such volume changes are related to increased or decreased blood flow, plethysmographic methods can be used to obtain estimates of the mean blood flow rate and of pulsatile and transient flow changes. Plethysmography may be of interest in psychophysiologic studies because mental processes and behavioral responses are often accompanied by changes in such cardiovascular parameters as blood flow, accompanied by measurable changes in limb volume. Continuous measurement of the latter is known as pulse volume plethysmography; under certain restricted conditions, an index of the blood flow rate can also be obtained in this way (2). In most psychophysiologic studies, however, the variable of interest relates to changes in blood volume and in blood volume pulses. The most common methods for measuring limb volume changes are pneumatic and photoelectric. Pneumatic methods are more complicated and are not suited to psychophysiologic studies. Therefore, although providing more precise information, they are much less frequently used in polygraphy. Figure 40.2 shows the principle of finger photoplethysmography. Two photosensors measure the transmission and reflection of the light emitted from a light-emitting diode. The fraction of transmitted light through the tissue and the fraction of reflected light from the tissue depend on the amount of blood in the tissue. Extensive discussions of the measuring principles, amplifier recorder requirements, and recorded waveforms have been provided by Lader (3) (pneumatic plethysmography) and Weiman (4) (photoplethysmography).
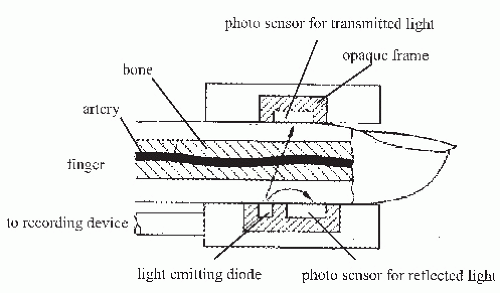 Figure 40.2 Principle of finger photophethysmography for transmission and reflexion of light. |
Impedance plethysmography of the thorax for impedance cardiography is the basis for noninvasive beat-to-beat monitoring of the stroke volume (5). An electric current is introduced into the thorax and the corresponding voltage is measured. The ratio of voltage to current yields the impedance (Z) that varies (in a very simplified model) with the amount and distribution of blood in the thorax. Based on the ECG, the phonocardiogram (PCG), and impedance cardiogram (ICG), the stroke volume can be determined noninvasively (Fig. 40.3).
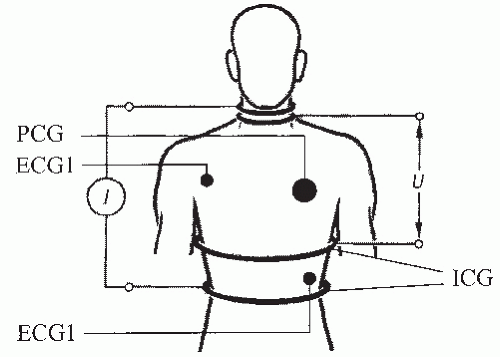 Figure 40.3 Principle of impedance cardiography. (Adapted from Gratze G, Fortin J, Holler A, et al. A software package for noninvasive, real-time beat-to-beat monitoring of stroke volume, blood pressure, total peripheral resistance and for assessment of autonomic function. Comp Biol Med. 1998;28:121-142.) |
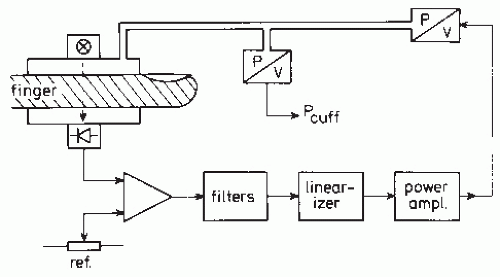 Figure 40.4 Block diagram of a system for noninvasive continuous recording of blood pressure based on the Penas principle. (From Wesseling KH, van Bemmel RA, van Dieren A, et al. Two methods for the assessment of hemodynamic parameters for epidemiology. Acta Cardiol. 1978;33:84-87.) |
Blood Pressure
The catheter-manometer system is, at present, the fundamental method for continuous accurate measurement of the full arterial pressure waveform. It is, however, an invasive procedure and should be avoided unless the introduction of a catheter into an artery is absolutely necessary. The Riva-Rocci-Korotkoff method (using an upper arm cuff and a stethoscope) is noninvasive and commonly used, but it does not provide continuous blood pressure information. However, most automatic methods developed for determining blood pressure have been based primarily on the Riva-Rocci-Korotkoff method. For instance, Roy and Weiss (6) described a technique for providing intermittent determinations of the systolic and diastolic blood pressure obtained over several heartbeats. Such systems have also become commercially available. The method indicated above, however, is sensitive to motion artifacts and not continuous.
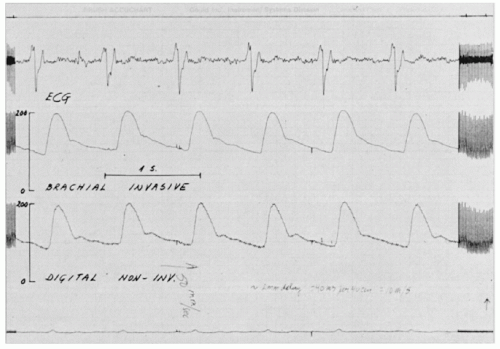 Figure 40.5 Example of a comparison of continuous recordings of blood pressure, simultaneously obtained by an invasive (intraarterial) and a noninvasive method. The latter was performed according to the method introduced by Penaz. |
Penaz (7) developed an important improvement in the noninvasive determination of blood pressure, using continuous measurement of the blood pressure in the finger. This method uses a finger cuff. By means of a servosystem the cuff pressure is maintained equal to the arterial pressure. This is achieved by minimizing arterial diameter changes using a photoelectric plethysmographic feedback method. The working principle is shown in the block diagram of Figure 40.4. The further development and evaluation of methods based on this approach (8,9) are of great interest to those interested in the continuous measurement and recording of beat-to-beat diastolic, systolic, and mean arterial pressure. This is indicated in Figure 40.5 by the similarity between continuous blood pressure and curves recorded simultaneously by way of noninvasive and invasive methods.
The noninvasive blood pressure measurement was first applied during anesthesia (10) and was also used for long-term sleep monitoring in patients with systemic hypertension and sleep-related breathing disorders (11). The new system gives valuable results if the position of the finger cuff is carefully controlled. An example of blood pressure recordings combined with respiratory measurements is displayed in Figure 40.6. A review of noninvasive continuous blood pressure measurements is found in Ruddel and Curio (12) and more recently in Parati et al. (13).
The capacity for measuring acute and immediate changes in autonomic, EEG, and hemodynamic physiologic variables during different sleep stages on a continuous basis has played an important role in enabling us to understand the interplay between changes in EEG and changes in circulatory variables and in autonomic neural functions. In this way the possibility of recording simultaneously with the EEG, HR variability, and blood pressure (BP), among other cardiovascular physiologic variables, has advanced our understanding of mechanisms linking sleep and cardiovascular physiology (14).
Related posts:

Stay updated, free articles. Join our Telegram channel

Full access? Get Clinical Tree


