Anticipating Seizures Based on EEG
Fernando H. Lopes Da Silva
Stiliyan Kalitzin
INTRODUCTION
In this chapter, we deal with the possibility of anticipating seizures based on the analysis of electroencephalogram (EEG) recordings. Nonetheless it is interesting to note that there exist many reports stating that epileptic patients may feel an approaching seizure (1), but most of these are based on relatively small patient populations. It is relevant to assess this issue critically since it may be important in order to determine the value of any automatic method based on EEG recordings. Schulze-Bonhage et al. (2) carried out a comprehensive analysis of subjective seizure anticipation reported by 500 consecutively recruited outpatients with focal and generalized epilepsy. The patients were asked to report any premonitory symptoms, with respect to, at least 30 minutes prior to a seizure. No auras were included. These authors found that 6.2% of patients were able to report anticipating seizures. The median estimated time interval between occurrence of premonitory symptoms and seizure onset was 90 minutes. More recently, Scaramelli et al. (3) reported a study where the existence of premonitory or prodromal signs (PS) was investigated in a randomly selected population of 100 adult epileptic patients both with focal and generalized epilepsies. Using a semistructured protocol and personal interviews they found evidence for PS (behavioral, cognitive and mood changes, excluding auras) in 39% of patients, mostly in those having complex partial and generalized tonic-clonic seizures. In this study PS were reported to have an insidious onset and a duration ranging from 30 minutes to several hours prior to seizure onset. We should note that these results are certainly relevant although it is not yet possible to estimate the corresponding sensitivity and specificity with respect to the pre-ictal period. The fact that no EEG recordings were generally carried out during the period where the patients reported PS raises also the question as to whether EEG signal changes might be associated with the presence of PS. In assessing the clinical significance of EEG automatic methods of analysis, it is important to keep these results on subjective experiences of epileptic patients in mind.
In their thoughtful account of the “state of seizure prediction,” Zaveri et al. (4) considered that three phases can be distinguished in this research field in the course of the last decades. In the first phase in the seventies, a variety of attempts were tried, from measuring epileptiform spike rates to estimating time-varying EEG spectral features. In the second phase, particularly in the late eighties and beginning nineties, the question of anticipating epileptic seizures was approached within the frame of mathematical methods derived from the theory of nonlinear dynamical systems. In the third phase, since about 2000, more sophisticated studies are appearing particularly with respect to theoretical models of seizure dynamics, to statistical methods of evaluating clinical application studies, and to proposals of new strategies. In any case the development of reliable methods to anticipate seizures is the aim of a wide range of researchers having in view the desideratum of being able to control the occurrence of seizures, ideally avoiding their onset.
Considering the relevance of the mathematical approaches, however, we start by presenting a sketch of the analytical tools used in this context. Before entering into the main question of anticipation of epileptic seizures, we consider how these mathematical analyses have been applied to characterize the dynamics of the neuronal networks during seizures. This is useful to understand better what happens in the dynamics of the corresponding EEG signals in the course of the transition from the interictal to the ictal or seizure state. We finish this chapter with the discussion of alternative strategies specially in relation to theoretical modeling of seizure dynamics. In this context, it is interesting to note that the question of predicting seizures is related to similar problems in other fields of science. Recently, Scheffer et al. (5) reviewed this issue in a general way and concluded that there may exist generic early-warning signals that may indicate for a wide class of systems with multiple attractors if a critical threshold is approaching, such as in the case of an approaching epileptic seizure. The authors assume in this chapter, however, that transitions occur due to crossing that threshold. In reality internal or external fluctuations, or “noise,” can trigger a transition even away from the critical threshold in a multi-attractor system. Another aspect that should be noted is that in order to define effectively a precursor, or early-warning signal, it is necessary to have a specific model of critical transitions.
CHARACTERIZATION OF EEG SIGNALS DURING EPILEPTIC SEIZURES AS REALIZATIONS OF LOW-DIMENSION NONLINEAR COMPLEX SYSTEMS
In the last decade, the interest for the characterization of epileptic seizures based on EEG recordings using analytical tools derived from the mathematical theory of nonlinear complex systems has grown steadily. A large number of approaches have been tried out with this aim in view.
A very abbreviated explanation of the corresponding basic concepts is appropriate here. Traditionally EEG analysis employs mathematical tools used in the analysis of linear systems as
discussed in detail in Chapter 54. More recently nonlinear methods of analysis of time series have received special attention, particularly since Takens (6) proposed the mathematical basis for the reconstruction of dynamical systems using time series and Grassberger and Procaccia (7,8) introduced methods to estimate invariants of such systems from a single time series, such as the correlation dimension (D2), Lyapunov exponents, and entropy (for mathematical definitions see, for example, Ref. 9). The most important aspects of nonlinear time series analysis are described in Grassberger et al. (10), and a tutorial review of nonlinear dynamical EEG analysis is that of Pritchard and Duke (9). The basic principle is to reconstruct the state space of the system using delay-vectors derived from the EEG time series. A fundamental concept is that the dynamics of a system must be studied in a phase space; a point in this space characterizes the state of the system at any moment of time. The phase space is a reconstruction procedure that starts from raw data and builds vectors by iterations of a time delay (delay-vectors). In this way invariants of the signal dynamics, namely the correlation integral and the correlation dimension D2, or the Lyapunov exponents can be estimated to characterize the signal dynamics.
discussed in detail in Chapter 54. More recently nonlinear methods of analysis of time series have received special attention, particularly since Takens (6) proposed the mathematical basis for the reconstruction of dynamical systems using time series and Grassberger and Procaccia (7,8) introduced methods to estimate invariants of such systems from a single time series, such as the correlation dimension (D2), Lyapunov exponents, and entropy (for mathematical definitions see, for example, Ref. 9). The most important aspects of nonlinear time series analysis are described in Grassberger et al. (10), and a tutorial review of nonlinear dynamical EEG analysis is that of Pritchard and Duke (9). The basic principle is to reconstruct the state space of the system using delay-vectors derived from the EEG time series. A fundamental concept is that the dynamics of a system must be studied in a phase space; a point in this space characterizes the state of the system at any moment of time. The phase space is a reconstruction procedure that starts from raw data and builds vectors by iterations of a time delay (delay-vectors). In this way invariants of the signal dynamics, namely the correlation integral and the correlation dimension D2, or the Lyapunov exponents can be estimated to characterize the signal dynamics.
Given an EEG signal one can put in evidence nonlinear deterministic dynamics, by testing whether the null hypothesis that the signal is a realization of a Gaussian random process can be rejected. This can be tested in various ways; one of the most common tests consists in making a comparison of the invariants of the signal, such as the correlation dimension D2 or the Lyapunov exponents, with those of surrogate signals (randomized signals) as proposed by Theiler et al. (11), Pijn et al. (12), Prichard and Theiler (13), and Schreiber and Schmitz (14). This methodology has been applied by several authors to the analysis of EEG signals recorded during different behavioral states, including sleep (15) and alpha rhythms (16), by computing the correlation dimension (D2) of EEG epochs and the corresponding surrogates.
With respect to the study of EEG signals recorded from the brain of epileptic patients, the basic question is whether differences in the dynamics of neuronal networks, in terms of invariants such as the correlation dimension (D2) and/or Lyapunov exponents, could be found in these signals during the period preceding an epileptic seizure, with respect to reference periods far from seizure occurrence.
This concept stems from previous studies where it was shown that EEG signals recorded during epileptic seizures have different properties in terms of nonlinear dynamics compared to normal ongoing EEG activity. Hallmarks of such studies were those of Babloyanz and Destexhe (17) who estimated nonlinear dynamical parameters of absence seizures, namely the correlation dimension and the largest Lyapunov exponent, and reported a considerably lower value for the seizure periods in comparison with normal EEG, what these authors interpreted as indicating that the EEG during absence seizures has low-dimensional chaotic nature. These authors claimed the “existence of a chaotic attractor” during the absence seizure. Although this claim has been rejected by controlled studies performed later, this study has set the tone for many later investigations. Along the same line Iasemidis et al. (18, 19 and 20) described a sudden decrease in the value of the largest Lyapunov exponent, an indication of deterministic chaos, at seizure onset in subdural electrocorticogram (ECoG) recordings in seizures with a temporal lobe epilepsy (TLE) onset, initially in those channels close to the epileptogenic focal area, followed by other channels. In an animal model of epilepsy (limbic kindling in the rat) with a focal onset in the hippocampus, Pijn et al. (12) demonstrated a very clear decrease of the value of the correlation dimension D2, occurring at seizure onset. The drop in the value of D2 was most pronounced in the “focal area.” The process of seizure spreading could be followed by showing the progressive decrease of D2 for signals recorded from various brain areas at increasing distances from the “focal area.”
In this experimental animal study (12) and in a subsequent study in patients with temporal lobe epilepsy (21,22) we found that most EEG signals recorded during interictal periods could not be distinguished from random time series, while most epochs recorded during seizures were clearly distinguishable from random noise. These results demonstrate that EEG signals during epileptic seizures have different dynamics with respect to the interictal EEGs and are characterized by low-correlation dimension. This implies that the dynamical state of the neuronal networks underlying an epileptic seizure can be described by a relatively small number of degrees of freedom, in contrast with the interictal EEG. Whether this corresponds to a state characterized by a chaotic attractor cannot be concluded without further evidence.
The estimation of correlation dimension D2 in the cases reported by Pijn et al. (21) yields excellent results in terms of delineating the epileptogenic zone in cases of TLE, as well as tracing ictal spread throughout the brain. These studies, however, did not reveal any value of D2 able to predict reliably the onslaught of a complex partial seizure. In fact these findings indicate that a behavior reminiscent of a low-dimensional chaotic attractor becomes manifest only well into the seizure.
In any case we should stress that these kind of measurements can be influenced by a number of factors that have to be taken into account in interpreting the results, namely the following: the activity of the reference electrode may be of considerable influence on estimates of D2; bipolar montage reconstruction is the method of choice, whereas in case of monopolar recordings, one should always consider the possibility that extraneous “noisy” contamination through the reference electrode may influence the estimation of D2. In addition the presence of epileptiform spikes in the EEG signals, recorded interictally or pre-ictally, may yield a very low D2, close to 0. EEG signals displaying seizure activity always yielded D2 values different from surrogate signals. The differences, however, varied from being subtle to very large. Indeed there is usually a marked degree of nonstationarity in most EEG signals during the course of a seizure. Therefore, it is inappropriate to allocate a single value for D2 for a whole seizure and thus only an analysis that takes into account the evolution of D2 in the course of time might reveal a correct picture. Another limiting factor in the nonlinear EEG analysis is related to the nature of the acquisition technique. EEG signals are amplified and band-pass filtered during recording, and this may influence the values of calculated D2 or
the Laypunov exponents. As those calculations are based on defining neighborhoods in the reconstructed phase space of the system, excluding low-frequency variations of the signals may create spurious “closeness” of states and vice versa, taking a broader band signal may separate states in the phase space of the system.
the Laypunov exponents. As those calculations are based on defining neighborhoods in the reconstructed phase space of the system, excluding low-frequency variations of the signals may create spurious “closeness” of states and vice versa, taking a broader band signal may separate states in the phase space of the system.
ANTICIPATING EPILEPTIC SEIZURES USING SPONTANEOUS EEG SIGNALS
First we should have an operational definition of what is meant by anticipating or predicting epileptic seizures. Predictability may be defined operationally as “the demonstration that there exists a statistically significant association between the outcomes of a set of measurements preceding a seizure, and the time to the first seizure following these measurements.” The main point that has to be added is what kind of measurement is appropriate for the required association. Here we pass in review a number of measures that have been proposed and explored.
An early and simple idea was to use as a measure the rate of occurrence of epileptiform spikes, that is, to check whether there exist any consistent association between variations in the rate of occurrence of epileptiform spikes and the time of seizure onset. While there were some early reports indicating a possible relationship, a well controlled study by Gotman and Marciani (25) in 44 patients with focal epilepsy clarified this issue. They monitored continuously EEG and behavior of these patients, quantified spiking rate by an automatic detection method, and demonstrated that spiking rates do not change before seizures but may increase markedly after them. Thus neither high nor low spiking rates are associated with the occurrence of seizures, and spike rating cannot be applied in order to predict seizure onset. Other EEG statistical properties have been used with the aim of detecting hidden information in the pre-ictal period that might be used to predict the impending occurrence of a seizure. Thus Viglione and Walsh (26) using pattern recognition analytic procedures of spectral data reported that EEG changes characteristic of preseizure states could be detected a few seconds before seizure onset. Using linear autoregressive models fitted to ongoing EEG signals in 12 epileptic patients suffering from “absences,” Rogowski et al. (27) showed that the location of the poles in the z- and s-planes, as a function of time, presented a specific pattern linked with the occurrence of the seizure. These authors noted further that the trajectory of the “most mobile pole” during the preseizure period could aid in the prediction of the seizure by several seconds. Later, Salant et al. (28) used multivariate spectral estimation based on parametric modeling (determination of pole trajectories and coherence functions) in order to detect EEG changes preceding the outbreak of a seizure. Prediction of oncoming primary generalized seizures was based on the detection of increased pre-ictal synchronization. Prediction times of 1 to 6 seconds were found in several seizures from five patients. These methods, however, were not applied in general in view of the short prediction window and the uncertainty about the precise moment of starting of these seizures. These techniques were not tested thoroughly in a general clinical setting.
Efforts to solve the problem of anticipation in a more general context got a considerable impulse with the application of mathematical concepts developed for the analysis of nonlinear complex dynamical systems. Having passed above in review evidence that during epileptic seizures EEG signals display lowdimension correlation dimension values, the question is whether this is also the case before seizure occurrence, that is, in the pre-ictal period. In this respect memorable contributions were those of Iasemidis et al. (18, 19 and 20), Lehnertz and Elger (29), and Martinerie et al. (30).
As indicated above, a seizure onset, in general, represents an abrupt transition from a high-dimensional to a low-dimensional state. This can be described as a phase transition in the dynamics of the neuronal networks characteristic of the nonlinear nature of the underlying system. The question is thus whether phase transitions occur already in the pre-ictal period?
Iasemidis et al. (18, 19 and 20) analyzed long stretches of EEG signals, starting many hours before a seizure, recorded from subdural and implanted electrodes in the hippocampus of TLE patients. They reconstructed for each EEG epoch the phase space and estimated the corresponding maximum Lyapunov exponent (Lmax). The values of Lmax of EEG epochs recorded before the seizure showed fluctuations over time. Noteworthy, the Lmax values of EEG signals recorded from different cortical sites started to converge (phase of entrainment) several minutes before a seizure, and seconds prior to a seizure these values were locked together and showed an abrupt transition to a more ordered state. These authors noted that a critical number of sites should display entrainment over a certain time period for a seizure to occur. In this way these authors consider that this analysis methodology allows the definition of a pre-ictal transition state and thus it may be used to detect an impending seizure. Based on these data Iasemidis et al. (31) proposed an adaptive seizure prediction algorithm to analyze continuous EEG signals for the prediction of TLE seizures.
Lehnertz and Elger (29), applied the concept of EEG signal “complexity,” defined as the variability of a set of consecutive D2 estimates, in order to determine whether seizure onset could be anticipated. They found that “complexity” was reduced in EEG epochs recorded close to seizure onset and proposed that “neuronal complexity loss” could be used to anticipate seizure occurrence.
Martinerie et al. (30) analyzed 19 seizures from a homogeneous group of 11 patients with MTLE associated with hippocampal sclerosis, using indwelling electrodes, by reconstructing intracranial EEG signals as trajectories in phase space. They introduced nonlinear indicators to characterize the signal dynamics taking into account the EEG signals both as functions of time and space. In this way they were able to pinpoint the brain sites where seizure apparently started and showed that in most cases seizure onset could be anticipated 2 to 6 minutes
(Fig. 30.1). Confronted with the difficulties of applying this methodology in practice particularly because of the nonstationarity of EEG signals that may cause many spurious detections, this group developed alternative methods choosing, instead of a continuous sliding EEG window, a time window far from the seizure as reference and compared the dynamical properties of successive epochs of EEG signals to those of the reference window. In this way a new measure was introduced: the “dynamical similarity index,” which quantified changes in dynamics relative to the reference window. These authors reported a decrease of the dynamical similarity index several minutes before seizures in both intracranial (32, 33, 34, 35, 36 and 37) and even scalp EEG recordings (38). Chávez et al. (39) analyzed changes in phase synchrony and in the degree of association between EEG signals recorded from different sites (using nonlinear correlation coefficient) and found a significant decrease of synchrony in the focal area several minutes before seizures (>>30 minutes), mainly in the frequency band of 10 to 25 Hz.
(Fig. 30.1). Confronted with the difficulties of applying this methodology in practice particularly because of the nonstationarity of EEG signals that may cause many spurious detections, this group developed alternative methods choosing, instead of a continuous sliding EEG window, a time window far from the seizure as reference and compared the dynamical properties of successive epochs of EEG signals to those of the reference window. In this way a new measure was introduced: the “dynamical similarity index,” which quantified changes in dynamics relative to the reference window. These authors reported a decrease of the dynamical similarity index several minutes before seizures in both intracranial (32, 33, 34, 35, 36 and 37) and even scalp EEG recordings (38). Chávez et al. (39) analyzed changes in phase synchrony and in the degree of association between EEG signals recorded from different sites (using nonlinear correlation coefficient) and found a significant decrease of synchrony in the focal area several minutes before seizures (>>30 minutes), mainly in the frequency band of 10 to 25 Hz.
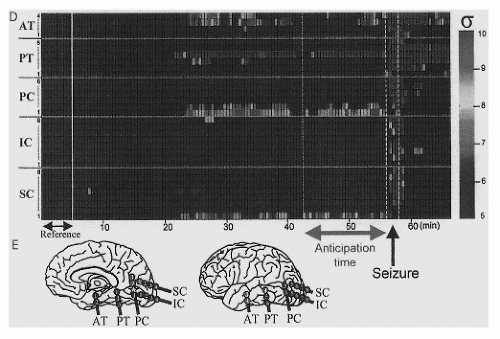 Figure 30.1 Nonlinear analysis of an intracranial EEG signal showing changes in the “similarity index” computed between a reference period and successive time windows preceding the seizure (D). The statistical significance is indicated by color code (blue indicates significance levels up to 5 standard deviations). The anticipation time with respect to seizure onset for EEG channel PC1 (Precuneus gyrus) is 13.5 minutes in this case. Channels with and without pre-ictal changes are depicted in red and blue, respectively, on a diagram showing the locations of intracranial electrodes (E). The first channel where seizure onset is detected is indicated by a yellow star. AT, anterior temporal lobe; PT, posterior temporal lobe; PC, precuneus gyrus; IC, infracalcarine; SC, supracalcarine. (From Navarro V, Martinerie J, Le Van Quyen M, et al. Seizure anticipation in human neocortical partial epilepsy. Brain. 2002;125(Pt 3):640-655.)(See color insert) |
More recently the same group (40) introduced a new method for analyzing multivariate phase synchronization in EEG signals, which basically tracks multivariate phase synchronization in space and time-frequency domains; these authors called this method frequency flow analysis (FFA). This method is particularly suited to analyze nonstationary time-frequency dynamics, since it allows the estimation of continuous phase differences as function of time. Using this approach, groups of EEG signals can be identified as belonging to common frequency flows, and the problem of studying synchronization becomes the problem of tracking frequency flows. This method was applied to simulated signals and real EEG or MEG signals recorded before and during epileptic seizures (35); it appeared to be relevant in tracking transient collective dynamics fluctuating in time, frequency, and space.
The reader may be overwhelmed by the large amount of methods that we have passed in review in this short chapter. This considerable series of methods is the result of the very inventive work of several research groups pursuing the still evasive objective of developing “the” optimal EEG analysis method with respect to detecting relevant features of EEG signals in the pre-ictal phase. An excellent critical description of the various methods used in this field is given by Mormann et al. (41).
Recently Wendling et al. (42) made a critical comparison of the performance of three families of methods regarding their capacity to assess the degree of coupling between EEG signals, namely linear and nonlinear regression, phase synchronization, and generalized synchronization. This was evaluated using a model where the relationships (coupling parameters) between signals were precisely known. The main result was that there was no “ideal” method, that is, none of the methods performed better than all the other in all conditions. They pointed out, however, that linear and nonlinear regression methods showed sensitivity to the coupling parameter in all tested models with average or good performances. Accordingly they concluded that the strategy of choice with respect to the analysis of coupling of EEG signals in epileptic brains is to first apply the regression methods in order to characterize functional connectivity before using more sophisticated methods that require more stringent assumptions. We concur with this advice and stress that a practical strategy is to use more than one method applied to the same EEG data, including always linear and nonlinear regression (21,43).
ASSESSING THE PERFORMANCE OF ALGORITHMS IN ANTICIPATING EPILEPTIC SEIZURES
The early studies were followed by a series of investigations where researchers tried a variety of modifications of the approaches described above and proposed additional algorithms like the “accumulated energy” algorithm, based on wide frequency band spectral energy (44), and presented critical studies with the aim of evaluating the results obtained by means of different methods in a rigorous way. In the context of a critical evaluation of the performance of the “dynamical similarity index” Navarro et al. (37) analyzed the dynamics of long EEG epochs recorded from patients with indwelling electrodes undergoing monitoring for presurgical evaluation of refractory partial epilepsy at the Montreal Neurological Institute. The similarity index detected pre-ictal changes considered relevant in two third of the seizures, these detections preceded a seizure on average by about 12 minutes, but the index could display fluctuations that were not directly followed by seizures. A large number of these fluctuations were related to changes of vigilance
or behavior. These authors carefully note that the dynamic changes detected pre-ictally may “represent physiologic changes acting as facilitating factors or pathologic changes reflecting a network dysfunction.”
or behavior. These authors carefully note that the dynamic changes detected pre-ictally may “represent physiologic changes acting as facilitating factors or pathologic changes reflecting a network dysfunction.”
An important assessment study in this context is that of Aschenbrenner-Scheibe et al. (45). These authors investigated the sensitivity and specificity of Lehnertz and Elger’s method (29,46,47) based on estimating a “dimension complexity drop” of sufficient amplitude and duration as indicative of the pre-ictal state. In invasive 24-hour long EEG recordings from 21 patients with medically refractory partial epilepsies, who underwent invasive presurgical monitoring, they found that only one out of 88 seizures was preceded by a significant pre-ictal dimension drop. They were not able to detect significant differences of mean length and amplitude of dimension drops between interictal and pre-ictal states. Furthermore they analyzed the results of the same algorithm applied to EEG signals comprising 50 minutes of pre-ictal and 24 hours of interictal periods. Using this data set they found that this algorithm resulted in a sensitivity of 38% in hippocampal seizures and 33% in neocortical seizures, considering that a false-positive rate of 0.1/hr was allowed. Regarding the clinical applicability of this algorithm Aschenbrenner-Scheibe et al. (45) concluded with the comment that “used as a pure warning system, a prediction method of this quality would probably be ignored after a short time.”
Related posts:
 Dynamics of EEGs as Signals of Neuronal Populations: Models and Theoretical Considerations
Activation Methods
Dementia and EEG
Nonepileptic Attacks
Intracranial Monitoring: Depth, Subdural, and Foramen Ovale Electrodes
EEG Event-Related Desynchronization (ERD) and Event-Related Synchronization (ERS)
Dynamics of EEGs as Signals of Neuronal Populations: Models and Theoretical Considerations
Activation Methods
Dementia and EEG
Nonepileptic Attacks
Intracranial Monitoring: Depth, Subdural, and Foramen Ovale Electrodes
EEG Event-Related Desynchronization (ERD) and Event-Related Synchronization (ERS)
Stay updated, free articles. Join our Telegram channel

Full access? Get Clinical Tree


