Dementia and EEG
Cornelis Jan Stam
INTRODUCTION
Only a few years after his first report on the human electroencephalogram (EEG), Hans Berger described EEG abnormalities in dementia, including an autopsy-proven case of Alzheimer disease (AD) (1,2). Since then, over 2000 research papers and more than 200 reviews have been published on the EEG in dementia. According to DSM IV criteria, dementia is a syndrome characterized by multiple cognitive deficits that cause impairment in social or occupational functioning and represent a significant decline from a previous level of functioning (3). Dementia has now become a major health problem, especially in the aged Western population. The prevalence of dementia in the Western population in those aged over 65 has been estimated between 3.6% and 10.3% (4). In 50% to 60% of patients dementia is due to AD (4). In Europe alone, 5 million people are suffering from dementia (5).
In view of the importance of dementia as a health problem and the large number of studies that have been conducted, one might expect that the role of the EEG in dementia is now well defined. Surprisingly, this turns out not to be the case. Despite recent efforts at evidence-based guidelines for the diagnosis of dementia, opinions on the usefulness of the EEG still vary considerably. According to some authors, the usefulness of the EEG is very limited and should be restricted to excluding nonconvulsive status epilepticus or supporting a diagnosis of sporadic Creutzfeldt-Jakob disease (6). In an American guideline the EEG is not even considered as an option (7). In contrast, other authors have advocated a more widespread use of the EEG in dementia (8,9). Summarizing the EEG literature up to 1996, Jonkman reached the following three conclusions: (i) there remains a need for a laboratory technique to confirm the diagnosis since a 100% accuracy cannot be obtained by clinical methods only; (ii) the sensitivity of the EEG is higher or equal to the best other laboratory techniques; (iii) all AD patients should be studied at least once by EEG as well as by MRI.
In a recent European guideline, the possibility that the EEG could be considered not simply as a tool to exclude rare conditions but also as an adjunct in the diagnosis of specific causes of dementia is considered (5). Compared to the 2001 USA guideline, the 2007 European guideline reflects the tendency to move away from a purely exclusionary approach to dementia diagnosis that dominated the older literature (10). Currently, there is a tendency to use laboratory investigations such as brain imaging, cerebrovascular fluid markers, and the EEG not just to exclude rare and possibly treatable causes of dementia but also to obtain positive arguments in favor of specific diseases causing dementia such as AD, frontotemporal lobar dementia (FTLD), vascular dementia (VaD), and so on (11,12). In a recent review on the usefulness of EEG and ERPs as biomarkers Jackson and Snyder indicate that they anticipate expanded application of quantitative EEG (qEEG) as a reliable and sensitive biomarker of mild cognitive impairment (MCI) and AD (13).
In this chapter we will give an overview of the literature on EEG in dementia. This overview cannot be complete, in view of the huge number of published research papers; instead we will present a selection of the most important studies, with an emphasis on more recent investigations that make use of current diagnostic criteria and proper statistical methods. First, the most important EEG changes in normal aging will be discussed. This topic is important to gain a proper understanding of the borderline between normal changes due to aging and the earliest signs of brain pathology in MCI and early AD. EEG changes in MCI, which is in many respects a transitional phase between normal aging and early dementia, will be discussed separately. Next, EEG changes in the major categories of dementia will be described. Emphasis will be given to the most common causes of dementia such as AD, VaD, dementia with Lewy bodies (DLB), and FTLD. Rare causes of dementia that are particularly relevant for EEG such as Creutzfeldt-Jakob disease will also be described. The practical use of the EEG in the work up of patients with cognitive complaints will be considered taking into account the objective data from the literature as well as the controversies between various guidelines.
EEG CHANGES IN NORMAL AGING
Compared to the extensive EEG changes that occur in the earliest years of life, reflecting developmental processes in the brain, the EEG remains relatively stable after the age of 18. However, EEG changes do occur with normal aging, especially after the age of 60, and it is important to delineate these from the earliest signs of pathology. EEG changes with normal aging have been described extensively in a classic review by Klass and Brenner (14). A more recent review has been published by Rossini et al. (15). One problem confronting EEG studies in the elderly is the definition of “normal.” On the one hand, “normal” can be defined in a statistical sense as referring to what is most prevalent in a population. A consequence of this approach could be that EEG findings will be biased by the presence of as yet subclinical pathology in an elderly population. For example, in a study on 52 normal subjects aged 20 to 91 years,
Hartikainen et al. found abnormal EEGs in 21% (16). Such findings raise the question whether the EEG is very prone to false-positive findings or whether a substantial percentage of subjects were suffering from subclinical pathology. Alternatively, “normal” can be defined as complete absence of disease or “successful” aging. Taken to the extreme, this approach might imply that the EEG of even the very old should not be different from that of an 18 year old, what is, of course, not realistic. In practice it is not so easy to determine which definition of “normal” holds; it depends strongly on the inclusion criteria used in EEG studies of healthy elderly. However, the question what is normal remains important, and we will come back to it when appropriate. Here we will discuss age-related changes in the major EEG rhythms, as well as some borderline phenomena such as focal temporal slow activity.
Hartikainen et al. found abnormal EEGs in 21% (16). Such findings raise the question whether the EEG is very prone to false-positive findings or whether a substantial percentage of subjects were suffering from subclinical pathology. Alternatively, “normal” can be defined as complete absence of disease or “successful” aging. Taken to the extreme, this approach might imply that the EEG of even the very old should not be different from that of an 18 year old, what is, of course, not realistic. In practice it is not so easy to determine which definition of “normal” holds; it depends strongly on the inclusion criteria used in EEG studies of healthy elderly. However, the question what is normal remains important, and we will come back to it when appropriate. Here we will discuss age-related changes in the major EEG rhythms, as well as some borderline phenomena such as focal temporal slow activity.
The physiologic alpha rhythm of awake, healthy adults is characterized by a frequency range between 8 and 13 Hz, a posterior temporal and occipital dominance and a clear reactivity to eye opening. The characteristics of the alpha rhythm, and in particular the alpha peak frequency, are very stable properties within a person and have a strong genetic basis. Several of these characteristics have been reported to change with normal aging, most notably the alpha peak frequency. A slowing of the alpha frequency was described already in 1954 by Obrist (17). After the age of 85 years the alpha rhythm may slow to 7 to 8 Hz (6). However, even in the very old the alpha frequency is not expected to drop below 7.5 to 8 Hz (18). In addition to slowing, the alpha rhythm in the elderly may be characterized by the presence of a benign rhythmic subharmonic variant of the alpha rhythm (19). This variant is characterized by rhythmic activity in the theta or delta band, at a frequency that is a subharmonic of the alpha rhythm, with clear reactivity to eye opening. Often traces of normal alpha can be found in the same record as well (Fig. 20.1). Reports on alpha rhythm slowing are probably biased at least to some extent by the presence of subclinical pathology. In our view slowing of the alpha rhythm below 8 Hz, even in the very old, is more likely to reflect pathology than normal aging. In a single subject, slowing of the alpha peak frequency over time by more than 1 Hz is also a sign of pathology.
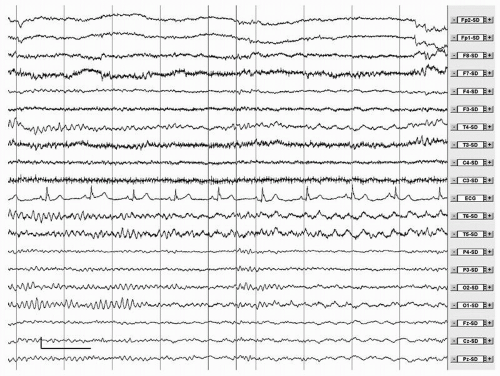 Figure 20.1 Male, 55 years. Alternation of normal alpha rhythm on the left and subharmonic slow variant of alpha rhythm on the right. This can be a normal finding in elderly subjects. Calibration mark: vertical, 50 µV; Horizontal, 1 second. Filter settings: time constant 1 second. Low-pass filter, 35 Hz. Source derivation. |
Several studies have addressed changes in the amount and amplitude of the alpha rhythm with normal aging. A reduced percentage time alpha and reduced alpha reactivity were reported by Markand (20). A reduction of alpha band power was also described by Hatikainen et al. (16). According to Babiloni et al. the power decrease in healthy elderly subjects may be limited to the lower alpha band of 8 to 10.5 Hz (21). The lower alpha band has been associated with attentional processes, whereas the upper alpha band may be related to different types of cognitive
processes, memory, and perceptual performance, but in different ways and with different reactivities (22). In addition to a decrease in power, the spatial distribution of EEG rhythms becomes more uniform in the elderly (23). Even though the power of the alpha rhythm may decrease with aging, it should be stressed that this is a fairly nonspecific finding. The so-called low-voltage EEG with amplitudes less than 20 µV can be a normal variant (14). An exception is the low-voltage EEG in Huntington disease, which will be discussed later in this chapter.
processes, memory, and perceptual performance, but in different ways and with different reactivities (22). In addition to a decrease in power, the spatial distribution of EEG rhythms becomes more uniform in the elderly (23). Even though the power of the alpha rhythm may decrease with aging, it should be stressed that this is a fairly nonspecific finding. The so-called low-voltage EEG with amplitudes less than 20 µV can be a normal variant (14). An exception is the low-voltage EEG in Huntington disease, which will be discussed later in this chapter.
Compared to the alpha rhythm, much less is known about changes in other rhythms with aging. The mu rhythm may be less prevalent in elderly (24). Slowing of the mu rhythm has not been the subject of separate studies but is probably in line with alpha rhythm changes. Differences in peak frequency between mu and alpha of more than 1 Hz should probably be considered to be abnormal. Of interest, the alpha rhythm in AD can be slowed with relative sparing of the mu rhythm. The amount of beta decreases in the elderly (16). Surprisingly, several reports indicate that elderly women have more beta than men (16,25). This finding is suggestive of postmenopausal hormonal changes, but there is no clear evidence for this conjecture. Quantitative analysis has shown that absolute power in delta and theta bands decreases with normal aging (16). In the eldest group, delta power was related to subtle cognitive deficits and cholinergic dysfunction.
A controversial issue is the interpretation of focal abnormalities in the anterior temporal areas in the EEG of the elderly. Such abnormalities have been reported by several authors (26, 27 and 28). These abnormalities are highly prevalent, occurring in over one third of subjects over 60 years, often with a preference for the left temporal areas (27). Intermittent temporal slowing has been related to white matter hyperintensities on MRI (26). White matter hyperintensities in healthy elderly have also been associated with decreased EEG coherence and cognitive abnormalities in another study (29). In a study in 27 healthy elderly subjects with a mean age of 78 years (range: 65 to 83 years) Visser et al. describe temporal theta or delta in 16 subjects (59%) (28). These temporal EEG abnormalities were associated with impaired word fluency and ventricular widening on CT. Klass and Brenner discuss the possible clinical significance of these temporal slow waves extensively (14). They propose to distinguish between more malignant and more benign forms of temporal slow waves. They introduce the concept of “benign temporal transients of the elderly” (BTTE) and give nine criteria that have to be fulfilled for temporal slow waves in order to be classified as BTTE. If the criteria are not fulfilled, the temporal slow waves should be considered pathologic and may indicate temporal, possibly vascular pathology.
The introduction of the concept of BTTE is a laudable attempt to reduce the number of false-positive findings in EEGs of elderly which would be likely to occur if all focal temporal slow waves would be classified as abnormal. However, the criteria for BTTE are somewhat complex and elaborate, and no information is available on their intra- and interrater reliability. Also, it is not clear whether the association between focal temporal theta or delta, cognitive dysfunction and structural abnormalities does not hold for the supposedly benign category of BTTE. At present it cannot be excluded that focal temporal theta and delta may be very sensitive early biomarkers of temporal lobe dysfunction, either of vascular or degenerative origin. The significant association between temporal focal abnormalities and MCI in a large cohort of memory clinic patients would favor such a view (30). What would be helpful is a simpler classification scheme of temporal abnormalities in the elderly, allowing for different grades of abnormalities and not just a classification as benign and malignant.
Another phenomenon that can be encountered infrequently in the EEG of healthy elderly subjects is a type of rhythmic, anteriorly dominant delta that occurs at the transition between wakefulness and sleep. This activity resembles frontal intermittent rhythmic delta activity (FIRDA) and has been referred to as “sleep onset FIRDA” (31). However, it should be stressed that FIRDA in the EEG of adults is always abnormal, whereas sleep onset FIRDA is considered to be a benign variant. A proper evaluation depends on the context, including the state of wakefulness as well as the presence of other EEG abnormalities. Pathologic FIRDA is unlikely to occur in the context of an otherwise entirely normal EEG. Also related to drowsiness is the phenomenon of “subclinical rhythmic EEG discharge of adults” (SREDA) (32). SREDA is characterized by paroxysms of rhythmic, sometimes sharply formed activity, mainly in the theta band. The paroxysms have a sudden onset and end, and the activity does not show the evolution of amplitude or frequency that is typical of epileptic seizures. The distribution is either unilateral or bilateral, predominantly in the temporal areas. SREDA is not associated with any kind of brain pathology and is considered to be an entirely benign variant.
MILD COGNITIVE IMPAIRMENT
A major trend in current studies on diagnosis in dementia is the emphasis on early diagnosis. Patients seek medical attention at a stage when there are complaints, possibly objective cognitive deficits, but not sufficient criteria for a diagnosis of dementia. There is an urgent need for tools to be able to either reassure these patients that their complaints are innocent or to anticipate the advent of full-blown dementia reliably and take appropriate actions. The introduction of the concept of MCI reflects these current trends. MCI is a condition characterized by objective memory disturbances in the absence of other cognitive deficits (33). Importantly, the objective cognitive deficits are insufficient to interfere with social or occupational functioning. The original concept of MCI was based on memory complaints and could be called amnestic MCI. More recently, the concept of MCI has been expanded to include nonamnestic as well as multidomain types of MCI as well (12). In all cases, MCI is considered to be a transitional phase between normal aging and dementia, characterized by complaints, objective deficits, but no interference with daily functioning. MCI patients have a clearly increased risk to develop dementia. The risk of developing dementia is 15% per year for a patient with MCI, compared to 1% to 2% for the healthy elderly population (12). Although MCI is clearly a risk factor for dementia, not all patients with MCI become demented. One major challenge is to identify
those patients who will not go on to develop dementia at an early stage. This is one of the important objectives of EEG studies in this field.
those patients who will not go on to develop dementia at an early stage. This is one of the important objectives of EEG studies in this field.
EEG changes in MCI subjects compared to healthy elderly subjects are subtle but have been described in many studies. Several authors have reported an increase in theta power in MCI compared to healthy controls (34, 35, 36 and 37). Increased theta, but not alpha or beta, power correlates with hippocampal volume loss (34,38). Jiang et al. found increased alpha and beta band power in addition to increased theta power in MCI (39). EEG power was negatively correlated with MMSE scores. In the study of Babiloni et al. the strength of delta and alpha 1 sources was decreased in MCI subjects, and these changes also correlated with MMSE changes (40). Surprisingly, lower alpha 1 source power was negatively associated with vascular abnormalities on MRI (41). Liedorp et al. reported a significant association between focal abnormalities and MCI (30). In contrast, a combination of focal and diffuse abnormalities showed a negative association with MCI and rather favored a diagnosis of AD, VaD, or DLB.
Some studies have attempted to increase the sensitivity by recording the EEG during tasks or by considering measures of functional connectivity. The notion of “functional connectivity” refers to statistical interdependencies between measures of brain activity (such as EEG, MEG, and BOLD) recorded over different brain regions; such correlation might reflect functional interactions taking place between those brain regions (42). Pijnenburg et al. showed that during a working memory task the synchronization likelihood, a general measure of correlations between signals, was significantly higher in MCI compared to the control subjects in the lower alpha band (8 to 10 Hz) (43). The increased task-related connectivity might suggest a compensatory mechanism. In another study involving working memory tasks, the EEG coherences in all bands were significantly higher in the MCI group in comparison with those in the control group (39). MCI patients showed less alpha band reactivity during a picture memory task (44). Findings with respect to resting state functional connectivity seem to be less consistent. Some studies showed no difference between two groups at rest (39,45). In contrast Babiloni did find a reduced frontoparietal alpha 1 band synchronization likelihood in AD and MCI subjects, correlating with lower MMSE scores (46).
An important question is whether the EEG changes in MCI predict conversion to dementia. Huang et al. found decreased alpha global field power and more anterior located theta, alpha, and beta sources in progressive as opposed to stable MCI (47). In the study of Jelic et al. alpha and theta relative power and mean frequency from left temporal occipital regions proved to be reliable predictors for conversion to AD (48). Progressive MCI patients displayed lower event-related theta synchronization than stable MCI (49). In a study in 69 subjects fulfilling criteria for MCI, of whom 24 converted to AD, Rossini et al. showed increased midline coherence as well as stronger delta, theta, and alpha 1 sources in converters compared to nonconverters (50). In contrast, Luckhaus et al. reported an association between decreased alpha activity at baseline and risk of conversion in MCI (51). In the study of van der Hiele et al. increased theta activity during eyes closed and less alpha reactivity during eyes open and memory activation at baseline indicated lower global cognitive and executive performance at follow-up (52). Prichep et al. showed that the EEG might even predict future cognitive decline in subjects who have subjective memory complaints but do not even fulfill criteria for MCI (53). Baseline EEG in 44 normal elderly subjects with subjective complaints could predict future cognitive decline during an impressive 7-year follow-up. Decliners were characterized by increased theta power, slowing of the mean frequency, and abnormal functional connectivity especially in the right hemisphere in their baseline EEGs.
To conclude, EEG changes can be demonstrated in MCI, and some of these changes may correlate with structural changes (notably hippocampal atrophy), cognitive deficits, and an increased risk of conversion to dementia. The most consistent finding seems to be an increase in theta power, in particular in the anterior temporal areas. Studies during cognitive tasks or employing measures of functional connectivity show less consistent results, possibly due to unknown compensation effects. Many authors claim that the EEG can predict conversion to dementia in MCI, but there is no agreement on which EEG measure is most important. In addition to increased theta power, slowing of the alpha rhythm and decreased alpha power may be important. So far, many of these studies are mainly concerned with predictions at the group level. It remains to be shown that reliable predictions can be made at the level of individual patients in prospective studies.
ALZHEIMER DISEASE
Alzheimer disease was first described by Alois Alzheimer in 1907 (54). It is the most frequent cause of dementia in the aging Western population, accounting for more than 50% to 60% percent of all cases (4). Neuropathologically, AD is characterized by neuronal loss, atrophy, deposition of amyloid beta 1-42 protein in senile plaques, and neurofibrillary tangles composed of abnormally phosphorylated tau protein. Different stages can be distinguished in the neuropathology of AD, mainly depending on the distribution of neurofibrillary tangles, which is limited to the hippocampus in early stages and spreads out to entorhinal and association cortex in later phases (55). Although the deposition of amyloid is often considered an important hallmark of the disease (56), neurofibrillary tangles may be more closely related to disease symptoms. With the advent of new PET tracers it has now become possible to trace the neuropathology of AD in vivo (57,58). 2-(1-(6-[(2-[18F]Fluoroethyl) (methyl)amino]-2-naphthyl)ethylidene)malononitrile ([18F]FDDNP) is a tracer that binds to neurofibrillary tangles and beta-amyloid senile plaques. FDDNP binding has been shown to correlate with cognitive disturbances in AD patients (58). In contrast, Pittsburgh Compound-B (PIB) that binds selectively to amyloid did not correlate with cognitive dysfunction in AD (57). While the diagnostic usefulness of these new PET tracers remains to be elucidated, they present a major breakthrough in the direct neuroimaging of the underlying pathology in AD.
Clinically, AD is characterized by early memory loss, in particular impaired encoding of new material. Later, cortical functions become disrupted resulting in aphasia, apraxia, and agnosia. Psychiatric and behavioral problems are also common.
Average duration of survival after diagnosis in AD is 5 to 8 years (59). A diagnosis of AD depends mainly on clinical findings, with neuropathologic confirmation as a gold standard. However, the interrater agreement of a diagnosis of AD is only moderate with a kappa of 0.63 (60). Currently, the most important research criteria for AD are the NINCDS-ADRDA criteria (61). According to Waldemar et al. these criteria have a sensitivity of 81% and a specificity of 70% across studies with postmortem confirmation (5). Even the autopsy findings may not constitute a straightforward gold standard: kappa scores for neuropathologic interrater reliability vary between 0.65 and 0.59 depending on criteria used (62). The modest agreement between clinical diagnostic criteria and neuropathologic findings illustrates the need for sensitive, specific, and reliable biomarkers for AD. However, they may also point to more fundamental limitations in our concepts of disease entities. We will return to this in our discussion of the clinical usefulness of the EEG.
EEG changes in AD were already described by Hans Berger (1). There is general agreement that the EEG in AD is characterized by a relatively nonspecific, stage-dependent pattern of diffuse slowing (Fig. 20.2). In the earliest phase of the disease the EEG can be normal, especially in late onset cases (14). However, in general, a normal EEG argues against a diagnosis of AD (30). Power decreases in the beta and alpha band and increases in the theta and delta band (63, 64, 65, 66, 67 and 68). Alpha peak frequency decreases and reactivity of the alpha rhythm to eye opening also diminishes (68). Increase in theta and decrease in beta power are probably the first and most sensitive EEG changes in AD (10,66,69,70). The increase in theta may be more outspoken in early onset AD (71,72). A slowing of the alpha peak frequency occurs only after the increase in theta (70). Later alpha power decreases and finally in a relatively late stage delta increases. The increase in slow activity is most prominent over left temporal areas (65,73). Furthermore sources of alpha and beta display a shift toward more frontal regions in AD (74). An increase in gamma band power has been reported in AD during rest and cognitive tasks, but it is questionable whether EEG activity above 20 Hz can be reliably distinguished from muscle artefact (75,76). In the course of the disease, there is a further decrease of beta and alpha power, slowing of the alpha peak frequency, and a further increase in theta and delta power (66,77). Focal abnormalities are not typical and may be related to the frequent occurrence of vascular pathology in AD. FIRDA is rare and can
be found in only 2.9% of EEGs in AD (78). Epileptiform abnormalities are also rare, but AD is associated with a significantly increased risk of epilepsy, especially in early onset and severe AD (79). Temporal epileptiform activity may mimic AD (80, 81 and 82). An example can be found in Figure 20.3.
be found in only 2.9% of EEGs in AD (78). Epileptiform abnormalities are also rare, but AD is associated with a significantly increased risk of epilepsy, especially in early onset and severe AD (79). Temporal epileptiform activity may mimic AD (80, 81 and 82). An example can be found in Figure 20.3.
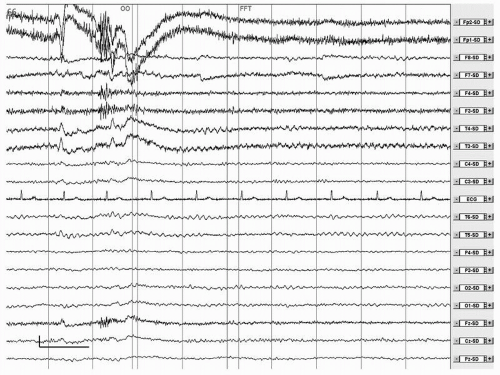 Figure 20.2 Male, 87 years. Alzheimer disease. Irregular, mildly slowed alpha rhythm, more pronounced at posterior temporal areas and diminished reactivity to eye closure. Calibration mark: vertical, 50 µV; Horizontal, 1 second. Filter settings: time constant 1 second. Low-pass filter, 35 Hz. Source derivation. |
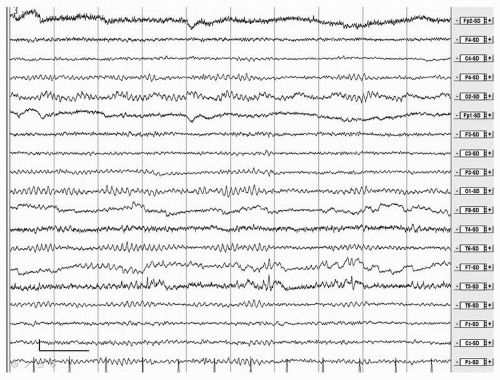 Figure 20.3 Female, 74 years. Mild cognitive impairment. Spike-wave complexes in the left temporal regions. Calibration mark: vertical, 50 µV; Horizontal, 1 second. Filter settings: time constant 1 second. Low-pass filter, 35 Hz. Source derivation. |
EEG abnormalities pointing to abnormal functional interactions between brain regions have been reported frequently in AD. Clinical symptoms may be due to a considerable extent to disrupted communication between distributed brain areas, justifying a description of AD as a disconnection syndrome (83). Functional connectivity can be studied by computing linear (such as coherence) or nonlinear (such as synchronization likelihood or mutual information) measures of correlation between EEG signals recorded from different brain regions. A decrease of EEG coherence in the alpha band in AD has been reported in many studies (69,84, 85, 86, 87, 88, 89 and 90). Nonetheless van der Hiele et al. reported no changes of alpha band coherence in AD, although these authors found also that theta relative power was increased in AD patients and this increase was related to decreased performance in all cognitive domains (68). A lower coherence in the beta band has also been described (89,91). Several studies agree with respect to a decrease of coherence in the theta band interhemispherically (69,92) and to a decrease of coherence in the alpha band (92), more specifically in the temporo-parieto-occipital region (88) and more focused on the left temporal region (69). Changes in the delta band are less evident, with a study reporting decreased coherence both inter and intrahemispherically (92) while another one (88) noted increased coherence between frontal and posterior regions but restricted to a few AD patients.
The normal parietal to frontal direction of information flow in the alpha and beta band is disrupted in AD patients (93). Nonlinear measures also showed a reduced functional connectivity in AD (42,45,94,95).
In addition to spectral analysis and assessment of functional coherence, several studies have explored advanced types of signal analysis in AD. Artificial neural networks are nonlinear classifiers that can improve the distinction between EEGs recorded in healthy subjects and patients suffering from MCI or AD (96, 97 and 98). Nonlinear EEG analysis attempts to reconstruct the dynamic processes in neural networks underlying the EEG (99,100). Nonlinear analysis has been applied to the EEG in AD in many studies (4,101). Measures such as the correlation dimension, the largest Lyapunov exponent, and the Kolmogorov entropy are used to characterize changes in the complexity of brain networks. In AD, several authors have reported a loss of complexity of brain dynamics (97,102, 103, 104, 105, 106, 107, 108, 109, 110 and 111). These changes may correlate with the severity of clinical symptoms. However, it should be stressed that results from nonlinear EEG analysis may be biased by more basic linear properties of the EEG (112).
These properties can be measured more easily with spectral analysis and coherence and may depend on the frequency band considered (113,114). More recently, complex brain networks have been characterized with graph theory (115,116). While healthy subjects have brain networks with the so-called small-world topology, characterized by a combination of high clustering and short path lengths, AD patients may have more random brain networks due to loss of critical communication lines (117, 118, 119 and 120).
These properties can be measured more easily with spectral analysis and coherence and may depend on the frequency band considered (113,114). More recently, complex brain networks have been characterized with graph theory (115,116). While healthy subjects have brain networks with the so-called small-world topology, characterized by a combination of high clustering and short path lengths, AD patients may have more random brain networks due to loss of critical communication lines (117, 118, 119 and 120).
Related posts:
 Dynamics of EEGs as Signals of Neuronal Populations: Models and Theoretical Considerations
Activation Methods
Metabolic Disorders and EEG
Anticipating Seizures Based on EEG
Intracranial Monitoring: Depth, Subdural, and Foramen Ovale Electrodes
EEG Event-Related Desynchronization (ERD) and Event-Related Synchronization (ERS)
Dynamics of EEGs as Signals of Neuronal Populations: Models and Theoretical Considerations
Activation Methods
Metabolic Disorders and EEG
Anticipating Seizures Based on EEG
Intracranial Monitoring: Depth, Subdural, and Foramen Ovale Electrodes
EEG Event-Related Desynchronization (ERD) and Event-Related Synchronization (ERS)
Stay updated, free articles. Join our Telegram channel

Full access? Get Clinical Tree


