Most frequent types of vertebrobasilar (VB) occlusive disease. Insets: (1a) Cerebral small vessel disease of pontine perforator by atherolipohyalinosis (inset: cross section of the lesion). (1B) Atheroma of the basilar artery occluding a penetrating small artery mimicking small vessel disease (so-called branch occlusion). (2A,B) Severe atheromatous stenosis/occlusion of major basilar branch (e.g., anterior cerebellar artery) by atherothrombosis (A) or embolism (B). (3) Predilection site of distal vertebral artery atherothrombosis in the V4 segment. Thrombotic occlusion simultaneously causing blockage of penetrating small arteries to the medulla oblongata. (4) Diffuse severe atheromatosis of the VB artery, finally leading to complete basilar artery thrombosis in insert (6). (5) Cardiac embolus sticking in the mid basilar artery with unpredictable consequences (e.g., VB transient ischemic attack due to rapid lysis, or causing locked-in syndrome due to complete transsectional pontine necrosis).
The most important determinant of outcome of posterior circulation strokes is the nature of the causative vascular disease underlying the stroke. Following acute VB ischemia, 1-month mortalities range from 2% to over 70% making meaningful predictions based only on clinical findings impossible. By contrast, the annual stroke rate in asymptomatic stenosis of the vertebral artery (VA) origin (see V0 segment in Table 6.1 later in this chapter) is as low as 0.4% [6].
| Arterial segment | Frequency of affection | Most probable pathogenesis | Typical vascular complication | Ultrasound technique | Preferred probe to use |
|---|---|---|---|---|---|
| V0 Origin of VA | Frequent | Atherosclerotic (atherothrombotic) | Thromboembolism hardly hemodynamic | CWD CCDS | CWD 4 MHz Linear probe 6–12 MHz Sectoral probe 5–8 MHz |
| V1 Free proximal segment | Rare | Dissection | Thromboembolism | CWD CCDS | Linear probe 6–12 MHz |
| V2 Bony canal of cervical column | Rare | Dissection rarely mechanical compression sometimes traumatic | Thromboembolic rarely hemodynamic | CCDS (complete US shadow at level of transverse processes) | Linear probe 6–12 MHz |
| V3 Atlas loop of VA Reaching to foramen ovale | Very rare | Dissection rarely arteritis | Thromboembolism (rarely hemodynamic) | CWD CCDS | CWD 4 MHz Linear probe 6–12 MHz Sectoral probe 5–8 MHz |
| V4 intradural part of distal VA | Frequent | Atherothrombotic | Thromboembolic occlusion thromboembolism | TCD TC-CCDS | TCD 2 MHz TC-CCDS 2–3 MHz |
| Basilar artery (BA) – proximal (caudal) – distal (oral) | Frequent | Atherothrombotic embolic rarely arteritis | Any of the above | TCD TC-CCDS | TCD 2 MHz TC-CCDS 2–3 MHz |
| Posterior cerebral artery – P1 (proxymal) – P2 (distal) | Frequent | Embolic more frequent than atherosclerotic rarely arteritis | Occlusion and peripheral embolism by atherothrombosis | TCD TC-CCDS | TCD 2 MHz TC-CCDS 2–3 MHz |
| Subclavian artery – proximal – distal | Frequent | Atherosclerosis | Strong marker lesion of CAD if prox.: SC steal mechanism | CWD CCDS | CWD 4 MHz Sectoral probe 5–8 MHz |
| Persistent primitive trigeminal artery | Very rare | Developmental anomaly | Prawn to cardiogenic embolism (otherwise unknown) | TCD TC-CCDS | TCD 2 MHz TC-CCDS 2–3 MHz |
As soon as VB ischemic stroke (i.e., posterior fossa stroke or posterior circulation stroke) has occurred and posterior cerebral bleeding has been excluded by computed tomography (CT) or magnetic resonance imaging (MRI), the first important differentiation of the underlying pathogenesis is small vessel versus large vessel disease. While the former as singular stroke (not as a generalized cerebral disorder) has a relatively benign prognosis, large artery occlusive disease can have lethal consequences and requires a rapid diagnostic workup in order to meet therapeutic time windows in due time (see later in chapter). A firm initial differential diagnosis is best supported by MRI of the posterior fossa, thalamus and posterior lobes combined with a thorough arterial ultrasound check. The reason for this combined approach is as follows: while large artery disease can directly be visualized at the level of the arteries themselves by ultrasound and other noninvasive arterial imaging techniques, the affected small cerebral arteries (Figure 6.1, insert 1A) leading to lacunar infarcts cannot directly be investigated during life because they are too small in diameter. Cerebral small vessel disease is inferred indirectly from the lesional pattern of lacunar infarcts on CT or MRI. It should be kept in mind, however, that lacunar-like, complete or partial necrotic lesions of the pons, midbrain or thalamus can also be caused by large artery disease like a transient basilar artery embolus temporarily blocking deep perforators to the basis pontis or to the thalamus (Figure 6.1, insert 5). An unstable atherosclerotic plaque in the basilar artery can cause a similar type of lesion before, all of a sudden, it progresses to complete basilar artery thrombosis (Figure 6.1, insert 6). It is therefore reasonable to investigate the large arteries of the VB system also in patients who present with lacunar syndromes either clinically, or morphologically on MRI.
Twenty percent of the cerebral blood volume is channeled into the VB distribution leading to the little-known fact that approximately 20% of aorto-cardiac cerebral emboli enter the VB pathway. By reviewing various stroke registries, Caplan [4] came to the conclusion that about 20–30% of all ischemic VB strokes are cardioembolic (in the wider sense of aorto-cardioembolic etiology) with a present trend to even higher proportions due to improved cardiac diagnostics, but also due to the worldwide atrial fibrillation epidemic [7,8].
Presumably, intra-arterial VB embolism arising from occlusions or high-grade stenosis of the extracranial VAs (i.e., the above-described V0–V3 segments) is still underestimated due to lack of systematic and longitudinal ultrasound studies on this particular type of disease combined with microembolus detection [9,10,11].
Short overview of existing non-ultrasound imaging techniques
The correct allocation of stroke symptoms to the VB circulation (i.e., to PCOD), has been revolutionized by modern imaging techniques, in particular by means of both magnetic resonance brain imaging (MRI) of the posterior fossa and systematic neurosonology of the brain supplying neck arteries, and large intracranial arteries with color-coded duplex scanning and transcranial Doppler [12,13], as well as improved cardiac imaging and rhythm monitoring. Invasive digital subtraction angiography (DSA) and completely noninvasive CT and MRI arteriograms added considerably to our present understanding of VB occlusive disease [14].
Particularly in the posterior circulation, ischemic strokes vary widely in their severity, ranging from mild, transient lacunar strokes to devastating strokes (because of the infarcts’ strategic localization like thalamic infarcts) or even to life-threatening, huge pontocerebellar infarctions due to basilar artery thrombosis with up to 70% mortality [15].
Focused questions
Why is VB occlusive disease clinically so important for investigation?
What is the specific role of neurovascular ultrasound among the spectrum of presently available diagnostic tools?
Which other imaging techniques are important for the VB system?
Which steps of the ultrasound investigation are particularly useful and help to improve the management of the patient?
Is there a role of VB ultrasound for the patient’s follow-up?
Anatomy
For better anatomical orientation, and because of the specific and different prognostic and therapeutic impact of VB occlusive disease, the following nine arterial segments should be considered individually and investigated separately: (1) V0 (0 = zero) segment of the VA (i.e., the origin [mouth] of the VA normally arising from the SA) (2) the V1 segment of the VA extending from its origin downstream to its entrance into the transverse processes of the vertebral column (mostly at C6), (3) the V2 segment of the VA extending throughout the bony canal of the transverse processes C6 to C2, (4) the V3 segment extending from beyond the atlas to the foramen magnum and dura, and (5) V4 extending from the dura up to the conjunction with the companion VA to form the (6) basilar artery. The proximal and distal parts of the basilar artery should also be considered separately. The same holds true for (7) the P1 and P2 segments of the posterior cerebral artery (each of them separated from one another by the origin of the posterior communicating artery). (8) The proximal SA and the brachiocephalic trunk are brain-supplying vessels reaching from the aortic arch to the origin of the VA, or right common carotid artery, respectively [16], whereas (9) the distal SA is a limb-supplying, high resistance vessel. By means of a subclavian steal mechanism, however, it may cause abnormal cerebral hemodynamics within the VB distribution.
Basic imaging tips
lists the above-listed arterial segments of the VB system and the nature of the disease most probably affecting them, as well as preferable ultrasound techniques for interrogation.
Steps of ultrasound investigation to approach vertebrobasilar occlusive disease
V0/V1 segment
With continuous-wave (CW) Doppler probes, all segments of the VA can be insonated, a clear-cut advantage of this simple technique during initial screening. For the VA’s origin, a 4-MHz probe is feasible. The patient is lying in a supine position with his/her head straight and the neck extended. The anatomical landmark is the proximal part of the SA with its characteristic triphasic flow pattern. After identifying this artery proximally, the probe should be moved slowly along the anterior lower neck within the supraclavicular fossa in a distal and posterior direction. There is a change of the flow form from a triphasic waveform to a sharp rise in flow velocity during systole and gradual tapering of continuous forward flow throughout diastole. This is the characteristic waveform of the VA due to the low resistance vascular bed of the hindbrain [17]. For the unequivocal identification of the VA it is helpful to rhythmically compress it behind the mastoid at the level of the V3 segment. This manipulation leads to a short repetitive modulation of the diastolic flow and allows a correct identification of the VA. The origin of the VA could be found in approximately 65–85% of patients [18,19]. Color-coded duplex sonography may facilitate the insonation of the vertebral origin. Particularly on the right side, it is easy to visualize its origin with a linear 7–15-MHz probe. In obese patients with a short neck, a 5–8-MHz sectorial probe could be superior. With the ongoing development of color-coded duplex sonography instruments, we recommend using this technique.
Specific findings at the V0/V1 segment
The normal mean blood flow velocity at the origin of the VA is 64 cm/s (range 30–100 cm/s) [20]. However, these velocities can differ considerably due to frequent asymmetries in the VA diameter in approximately 73% of normal individuals [21].
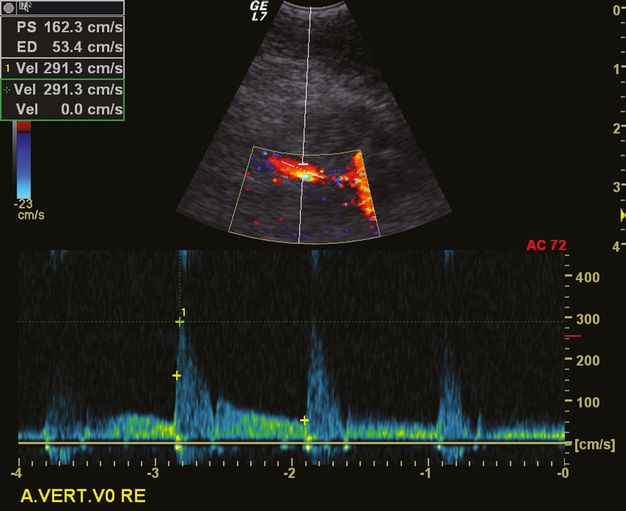
Pragmatically, a low-grade stenosis (<50%) at the origin of the VA can be diagnosed by means of a peak systolic velocity (PSV) at its origin of ≥85 cm/s. Additional criteria are the ratio of the PSV at the origin/PSV at the V2 segment of ≥1.3, and the end-diastolic velocity at the origin being ≥27 cm/s. For a medium-grade stenosis of 50–69%, a PSV at the origin of ≥140 cm/s is characteristic. Additional criteria are a ratio of the PSV at the origin/PSV at the V2 of ≥2.1, and an end-diastolic velocity at the origin being ≥35 cm/s. For the diagnosis of a high-grade stenosis (with 70–99% lumen narrowing), a PSV at the VA’s origin of ≥210 cm/s is mandatory. This diagnosis is supported by ancillary criteria (like an PSV origin/PSV V2 ratio of ≥4.0, and an end-diastolic velocity at the origin of ≥50 cm/s [22,23]). In our experience, the peak systolic velocity is the most robust criterion. In case of VA occlusion, the diagnosis is more difficult due to the anatomical vicinity of the inferior thyroid artery and the frequent development of cervical collateral pathways mimicking a normal anatomy. The absence of a flow signal has to be interpreted with caution.
V2 segment
For the investigation of the V2 segment of the VA, color-coded duplex sonography with a 7–15-MHz linear ultrasound probe is superior to CW Doppler sonography alone because it allows the unequivocal identification of the vascular bed of the VA as such. The acoustic shadows from the transverse processes of the vertebrae will appear as a helpful landmark because the segments (or more) of the V2 segment of the VA are directly located between these processes [24].
Specific findings at the V2 segment
In the V2 segment, the normal peak systolic flow ranges from19 to 98 (mean 56) cm/sec [18]. A focal increase to >100 cm/s is indicative of a significant stenosis [25]. However, an atherosclerotic stenosis in the V2 segment is very rare, as opposed to dissections of the VA typically occurring in the V2/V3 segment [26].
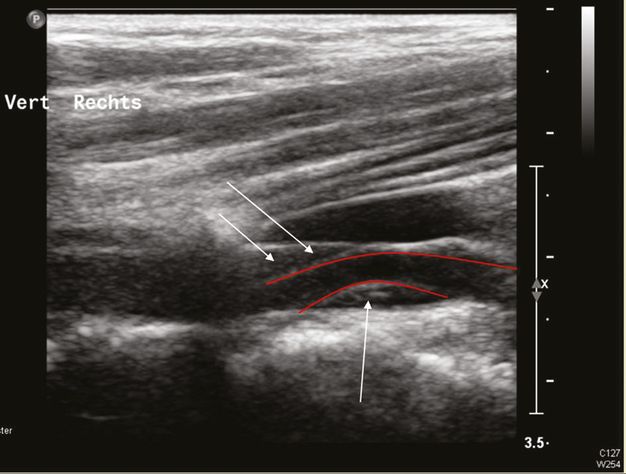
Dissection of the VA with an intramural hematoma, B-mode investigation with a linear ultrasound probe. The red lines show the course of the arterial lumen and the arrows mark the intramural hematoma.
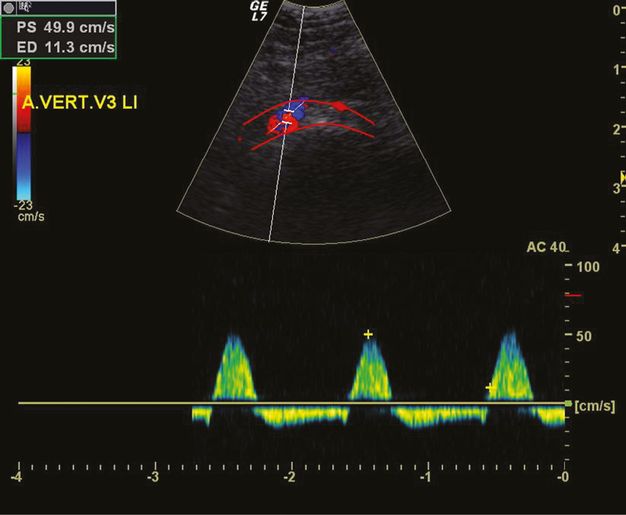
Alternating flow in the V3 segment of the VA due to proximal VA occlusion at the V4 level. The red lines mark the vascular bed of the VA.
Occlusions of the VA in the V2 segment are characterized by the absence of flow during color-coded duplex sonography, or by a high-resistance flow pattern proximal to the occlusion [27]. With color-coded duplex sonography it is possible to visualize the V2 segment in up to 100% [22], therefore this is the method of choice. However, its positive predictive value is limited because VA hypoplasia can also lead to a high-resistance waveform [28,29]. An indirect sign for a proximal VA stenosis is the decreased poststenotic pulsatility. In combination with the direct visualization of the V2 segment during color-coded duplex, this criterion achieved a 71% sensitivity and 99% specificity for the detection of >70% proximal VA stenosis [30].
The diameter of the VAs is mostly different on either side. A diameter of <2.5 mm has been defined to represent hypoplasia and seems to be an independent risk factor for VA atherothrombosis and VB stroke [31].
V3 segment
With the 4-Mhz CW Doppler probe, the V3 segment can be insonated reliably. Placed behind the mastoid and directed toward the contralateral eye, the typical VA waveform will be identified in either direction due to the tortuous course of the artery in this segment (the so-called atlas loop). Again, color-coded duplex sonography with a sectorial probe, or a >7.5-MHz linear probe, or a 2–4-MHz phased array transducer facilitates the artery’s identification. The appearance of the VA in this location is comparable to the handle of a coffee cup. In the proximal part of the atlas loop, the direction of the blood flow is toward the probe, whereas in the distal part blood is flowing in the opposite direction.
Specific findings at the V3 segment
In the V3 segment, atherosclerosis is nearly never found. If this segment is stenosed at all, a VA dissection is the most frequent cause of stenosis or occlusion (26,32). There is no clear cut-off value of the peak systolic velocity to define a V3 stenosis, but a significant difference of the flow on the right compared to the left in the absence of hypoplasia is indicative of a significant stenosis. The bending or looping course of the artery makes an angularly corrected measurement of the flow velocity difficult or even impossible. Therefore the afferent and efferent part of the artery should be investigated separately.
Most frequently, indirect signs of a proximal or distal atherosclerotic VA steno-occlusion can be demonstrated. An example is the alternating flow in the V3 segment due to a proximal occlusion, or a preocclusive signal due to a distal VA occlusion.
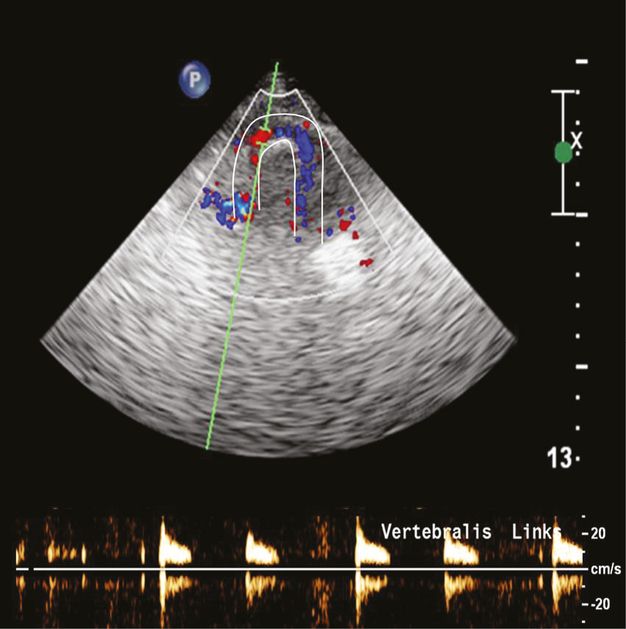
High-resistance preocclusive signal in the V3 segment due to a distal V4 occlusion. The white lines mark the arterial course of the VA and the Doppler signals show the typical sharp small systole without any diastolic signal.
Related posts:

Stay updated, free articles. Join our Telegram channel

Full access? Get Clinical Tree


