Cerebral arteries (basal view) and circle of Willis. 1 = Superior cerebellar artery; 2 = basilar artery; 3 = pontine branches; 4 = vertebral artery; 5 = anterior spinal artery; 6 = posterior spinal artery; 7 = anterior cerebral artery; 8 = anterior communicating artery; 9 = middle cerebral artery; 10 = internal carotid artery; 11 = posterior communicating artery; 12 = posterior cerebral artery; 13 = artery of labyrinth; 14 = anterior and posterior inferior cerebellar artery; I‒VI: cranial nerves.
The vertebral artery enters the cranial cavity through the great foramen and runs cephalad between the brainstem and the clivus until it joins with the contralateral vertebral artery to form the unpaired basilar artery. The most important branch of the vertebral artery in its intracranial (V4) segment is the posterior inferior cerebellar artery (PICA), which supplies the dorsolateral medulla oblongata and the cerebellum.
The basilar artery is approximately 3‒4 cm long and its course can be straight, curved or tortuous. It gives off several branches: the anterior inferior cerebellar artery (AICA), numerous pontine branches and the superior cerebellar artery (SCA). Finally it divides into the posterior cerebral arteries. The basilar artery supplies the basal sections of the temporal and occipital lobes, the cerebellum, the brainstem and the inner ear. The posterior cerebral artery runs laterally within the ambient cistern (P1 segment) and follows a curved path around the crus of the cerebrum (peduncle of cerebrum) occipitally to the tentorium (P2 segment). Between the P1 and P2 segments the posterior cerebral artery is joined by the posterior communicating artery, which connects the C1 segment of the internal carotid artery to the posterior circulation.
In favorable examination conditions, especially with a good insonation window, the branches of the main arteries of the circle of Willis, and the C2–C6 segments of the internal carotid artery can also be visualized. Further details to this special sonographic examination are presented in Chapter 9B.
Examination technique
TCCS requires the use of lower-frequency sector transducers to adequately penetrate the skull to produce useful brightness mode (B-mode) images and to record Doppler signals. A 1.6- to 3.5-MHz transducer or multifrequency transducer with 2- to 3-MHz spectral capability is commonly used [12,14,15]. The patient is examined in the supine position, with the head in the midline. The examiner sits behind the patient’s head. Both the examiner and the patient must be comfortable because, particularly in pathological conditions, the evaluation might take a long time (about 20–30 minutes).
Transtemporal examination
Using the transtemporal approach, the transducer is placed at the temporal bone cephalad to the zygomatic arch and anterior to the ear (Figure 9A.2). In this position, the hypoechoic butterfly-shaped cerebral peduncles, surrounded by the hyperechoic neighboring cisterns can be visualized in the axial plane on gray-scale B-mode image (Figure 9A.3). An imaging depth of 140–160 mm is recommended, to recognize the hyperechoic contralateral skull at the lower edge of the B-mode image. By slightly angling the transducer apically (about 10°) in the diencephalic plane,the third ventricle appears in the midline, with a thalamus on each side and the pineal gland posteriorly. In order to scan axial sections in the plane through the cella media, the transducer is tilted further cranially (by 30°) [16,17]. If the transducer is rotated from the axial plane by 90° the coronal plane can be displayed (B). Further details concerning B-mode brain parenchymal imaging are described in Chapter 24.
Examination technique for intracranial vessels. Schematic image of the sectional planes for transtemporal (left), suboccipital (center) and transorbital insonation (right).
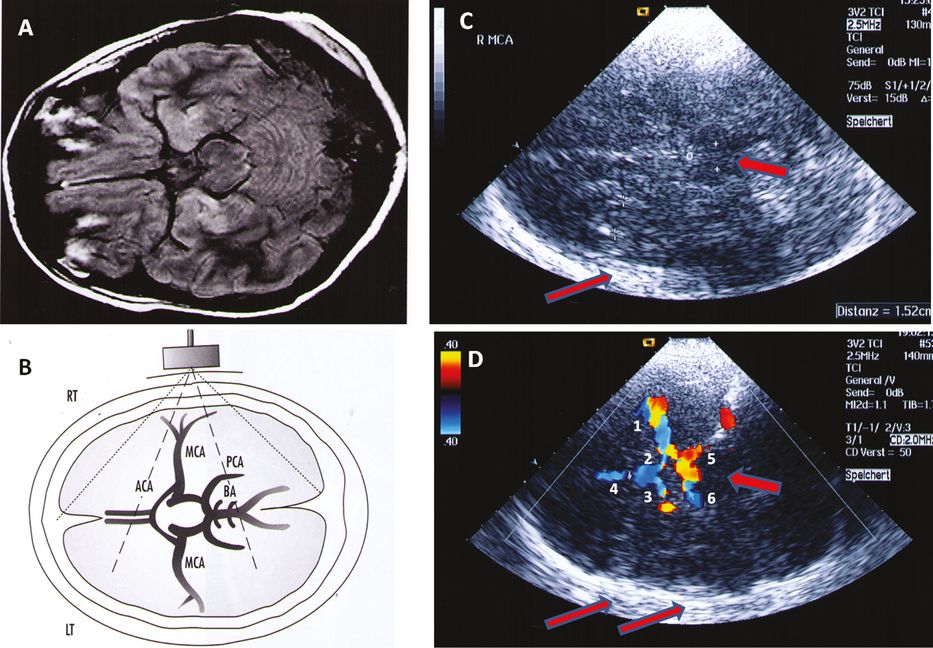
View of the basal cerebral arteries with transtemporal insonation. (A) Magnetic resonance image of the anatomical position of the arteries of the circle of Willis in the same plane as in (B). (B) Schematic view in the axial plane with transtemporal insonation of the basal cerebral arteries. (A and B with permission [12, p. 218].) (C) Axial plane through the mesencephalon. Examination depth 130 mm. (+) = mesencephalic brainstem; (o) = midline; width of the contralateral lateral ventricle = 1.52 cm. (D) Color-coded duplex sonography of the middle cerebral artery = MCA (1), the A1 segment of the anterior cerebral artery = ACA (2), the A1 segment of the contralateral ACA (3), the A2 segment of the ipsi- and contralateral ACA (4), the posterior cerebral artery = PCA (5) and the contralateral PCA (6). Examination depth 140 mm. Large arrow: mesencephalic brainstem; small arrows: contralateral skull.
By color-coding the Doppler signal, the flow in the basal cerebral arteries can be imaged and the individual arteries identified on the basis of their anatomical position – with respect to the brainstem structures – and flow directions. The lesser wing of the sphenoid bone serves as a B-mode landmark for the terminal internal carotid artery and the siphon [18]. Vessels with flow toward the transducer are coded red while those with flow away from the transducer are coded blue [12]. Accordingly, assuming normal flow conditions, the transtemporal insonation displays the ipsilateral middle cerebral artery (MCA) in red and the two segments (A1 and A2) of the ipsilateral anterior cerebral artery (ACA) in blue.
Usually a long M1 segment of the MCA can be visualized because its proximal part runs in the axial plane. In elderly subjects. it can be recognized on B-mode image as a hyperechoic pulsatile structure located parallel to the lesser wing of the sphenoid bone. By using the color function of the device, the trifurcation and the larger branches can be visualized. It is often possible to simultaneously image the contralateral MCA (coded blue since the direction of flow is away from the transducer). Accordingly, the A1 segment of the contralateral ACA is coded red. The evaluation of the flow direction in the anterior cerebral artery is important for the assessment of the collateral circulation in extracranial and intracranial occlusive disease [18,19,20].
By slightly angling the transducer caudally, the terminal C1 segment of the internal carotid artery (coded red) ‒ usually displayed in the diagonal plane ‒ is visible. In the anterior coronal plane the course of the internal carotid artery can be easily followed in the carotid sulcus to its bifurcation into ACA and MCA (Figure 9A.4C,D). The carotid siphon can be visualized using the combined transtemporal axial and coronal approach [21].
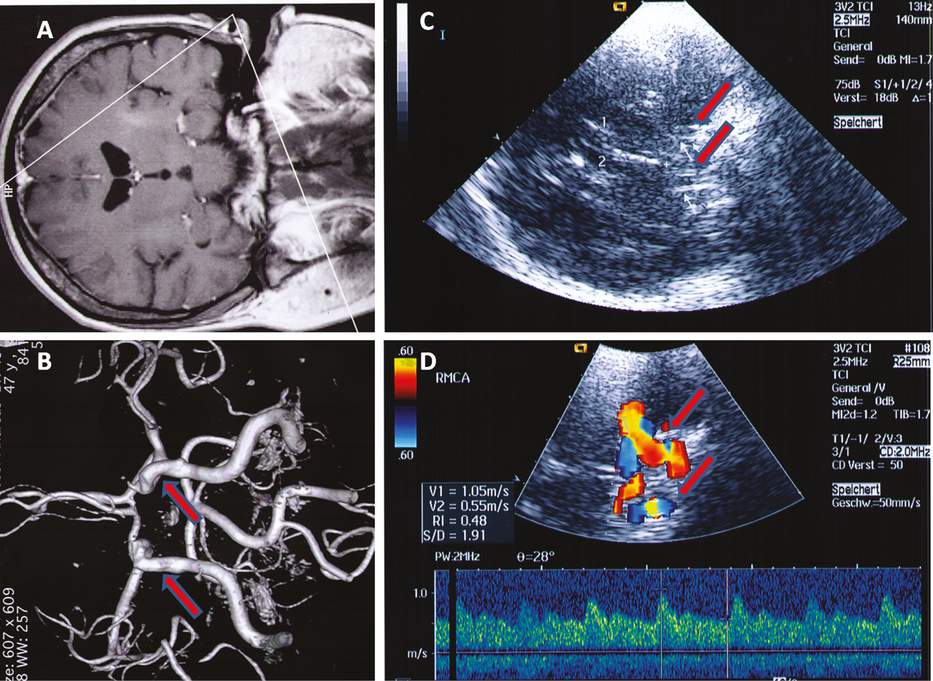
Coronal plane. (A) View of the magnetic resonance plane for the imaging of the coronal plane. (B) View of the corresponding magnetic resonance angiography. Arrows: C1 terminal segment of the ipsi- and contralateral internal carotid artery. (A and B with permission [12, p. 217].) (MRI, MRA images: By courtesy of Diagnoseklinik München.) (C) B-mode image in the coronal plane. The transducer is rotated by 90° in temporal position. 1,2 = ipsi- (1) and contralateral (2) frontal horns of the lateral ventricles; (+)= midline. Arrows: B-mode image of the carotid sulcus (carotid groove of the sphenoid bone). (D) Color-coded image of the terminal C1 segment of the internal carotid artery (ICA) in the anterior coronal plane. Arrows: ipsilateral ICA = coded red, contralateral ICA = coded blue. The spectral waveform of the middle cerebral artery (MCA) was recorded at the MCA/ACA bifurcation.
The posterior cerebral artery (PCA) winds posteriorly and laterally around the brainstem. It is not always possible to visualize it in the same plane as the MCA and the ACA. The transducer must be slightly tilted occipitally – this way it is sometimes possible to see the contralateral PCA as well, with inverse color coding.
Because of its curved course, usually the precommunicating P1 segment and the proximal (anterior) portion of the postcommunicating P2 segment of the PCA, with flow toward the transducer, are coded red, and the distal (posterior) P2 segment, with flow away from the transducer, is coded blue.
The posterior P2 segment and the basal vein of Rosenthal (BVR) can sometimes be imaged simultaneously in the diencephalic plane since they run relatively close to each other (see Chapter 22; Figure 9A.5). Here, there is a double Doppler signal: one for the PCA and one for the BVR [12,22].

Examination in the diencephalic plane. Imaging of the P2 segment of the posterior cerebral artery (A) and of the basal vein of Rosenthal (B). Occasionally it is possible to simultaneously image the P2 segment of the posterior cerebral artery and the basal vein running side by side. The Doppler spectrum exhibits a mixed signal of the artery (a) and vein (b). Arrow: 3rd ventricle, (*) = ipsilateral thalamus.
A 90° rotation of the transducer at the level of the P1 segment of the PCA allows the visualization of the top of the basilar artery in the posterior coronal plane.
Transnuchal examination
The transnuchal (suboccipital) insonation is used for the examination of the proximal portion of the basilar artery and the intracranial (V4) segment of the vertebral arteries. The patient sits or lies in a lateral position on an examination bed, with the head slightly tilted forward. The transducer is positioned suboccipitally in the midline and pointed toward the nasion (Figure 9A.6). To make the orientation on the screen easier, it is helpful to first locate the echoreflective osseus border of the hypoechoic foramen magnum in the B-mode image [23,24]. After switching to the color mode, the two vertebral arteries can be easily recognized lateral to the great foramen. By changing the position of the transducer these arteries can be followed to their junction with the basilar artery at the depth of about 70–80mm. The two vertebral arteries and the basilar artery are coded blue due to their flow direction away from the transducer [25,26]. Because the vertebral arteries and the basilar artery have a tortuous course, it is difficult to visualize a long segment of the arteries. Under optimal examination conditions it is sometimes possible to visualize the “Y” configuration of the converging vessels. The posterior inferior cerebellar artery (PICA) branches off the V4 segment of the vertebral artery. It can be usually imaged well with red color-coding due to the flow toward the transducer.
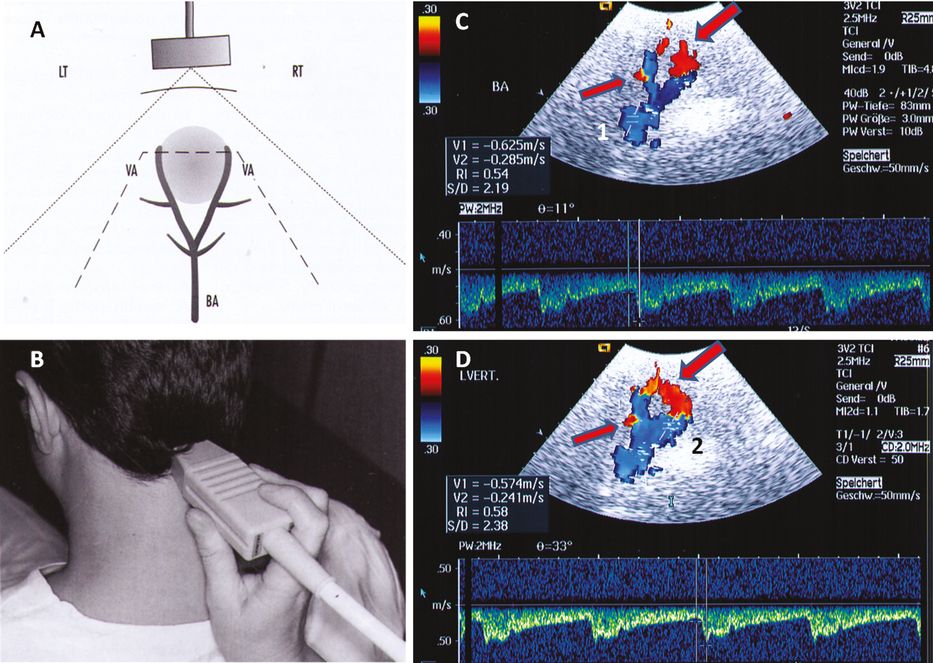
Imaging of the basal cerebral arteries by suboccipital insonation. (A) Schematic view of the sectional plane with suboccipital insonation of the terminal segments of the vertebral arteries and the basilar artery. (B) Transducer position for suboccipital (transforaminal) insonation. (C) Visualization of both vertebral arteries and the basilar artery by insonating through the great foramen, corresponding to the scheme shown in (A). (A, B and C with permission [12, pp. 213 and 221].) The basilar artery and the cranial segments of the vertebral arteries are coded blue, with flow away from the transducer. In their proximal V4 segment, both vertebral arteries are coded red – caused by their tortuous course in the great foramen region (large arrow). Small arrow: posterior inferior cerebellar artery (PICA) – coded red due to a flow in the opposite direction. The spectral waveform of the basilar artery (BA) was recorded at a depth of 83 mm. (1) = basilar artery. (D) The same view of both vertebral arteries and the basilar artery as in (C). The Doppler spectrum was recorded in the left vertebral artery. (2) = vertebral artery.
The imaging of the branches of the basilar artery is described in Chapter 9B.
Transorbital examination
Transorbital insonation allows visualization of the ophthalmic artery and the carotid siphon [27,28,29]. It is important to note that the acoustic energy must be reduced to a maximum of 10‒15% in order to prevent possible ocular injury. Transorbital insonation is described in detail in Chapter 25.
Hemodynamic parameters
Whilst with pulsed Doppler sonography flow velocity can only be determined in a small, defined sample volume, color-coded duplex sonography enables blood flow to be visualized in real time through an entire vessel segment.
Using the color-coded procedure, the following information may be obtained simultaneously:
Vessel identification and anatomical position
Information on the time course of the flow parameters (spectrum analysis)
Information on the spatial distribution of the flow velocities, flow direction and flow disturbances (Figure 9A.7).
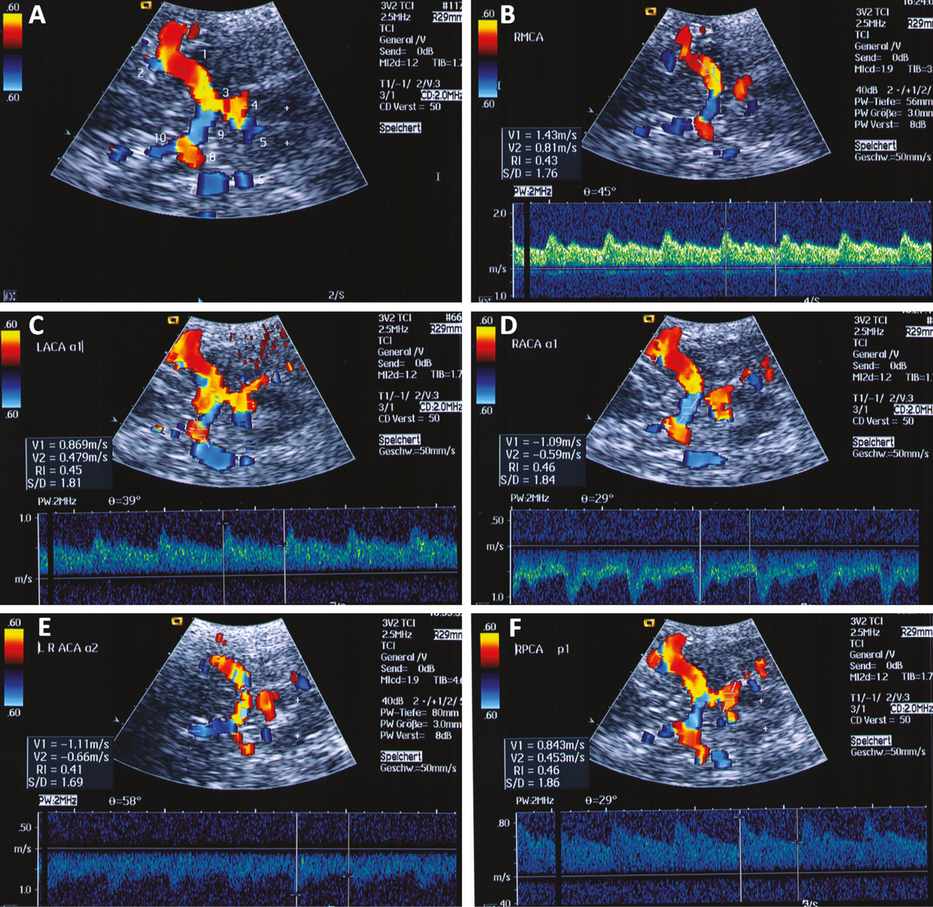
Angle-corrected measurement of flow velocity. Example of the angle-corrected blood flow velocities in a 32-year-old healthy man. The normal values for the maximum systolic and end-diastolic flow velocities of the intracranial arteries exhibit a wider scatter than those of the extracranial carotid artery. (A) View of the basal cerebral arteries with transtemporal insonation. 1 = MCA; 2 = M2 of MCA; 3 = posterior communicating artery; 4 = P1 segment of the ipsilateral PCA; 5 = P1 segment of the contralateral PCA; 6 = contralateral posterior communicating artery; 7 = contralateral MCA; 8 = A1 segment of the contralateral ACA; 9 = A1 segment of the ipsilateral ACA; 10 = A2 segment of the ACA. (+) = brainstem. (B) Spectral waveform of the right middle cerebral artery (RMCA) recorded at a depth of 56 mm (maximum systolic flow velocity = 143 cm/s, end-diastolic flow velocity = 81 cm/s, angle of insonation 45°). (C) Spectral waveform in the A1 segment of the left anterior cerebral artery (LACA a1) (maximum systolic flow velocity = 86 cm/s, end-diastolic flow velocity= 47 cm/s, insonation angle = 39°). (D) Spectral waveform in the A1 segment of the right anterior cerebral artery (RACA a1) (maximum systolic flow velocity = 109 cm/s, end-diastolic flow velocity = 59 cm/s, insonation angle = 29°). (E) Spectral waveform in the A2 segment of the anterior cerebral artery (LRACA a2) (maximum systolic flow velocity = 111 cm/s, end-diastolic flow velocity= 66 cm/s, insonation angle = 58°). (F) Spectral waveform in the P1 segment of the right posterior cerebral artery (RPCA p1) (maximum systolic flow velocity = 84 cm/s, end-diastolic flow velocity = 45 cm/s, insonation angle = 29°).
To determine the hemodynamic parameters, the sample volume is positioned under visual control in the vessel segment of interest so that its acoustic Doppler signal and the corresponding spectral waveform can be registered. The Doppler spectrum of the intracranial arteries is characterized by a high diastolic component [12].
The Doppler spectrum should always be displayed, not only to enable the identification of the vessel, but also to detect possible side-to-side differences and to measure flow velocities and pulsatility index (Figure 9A.8).
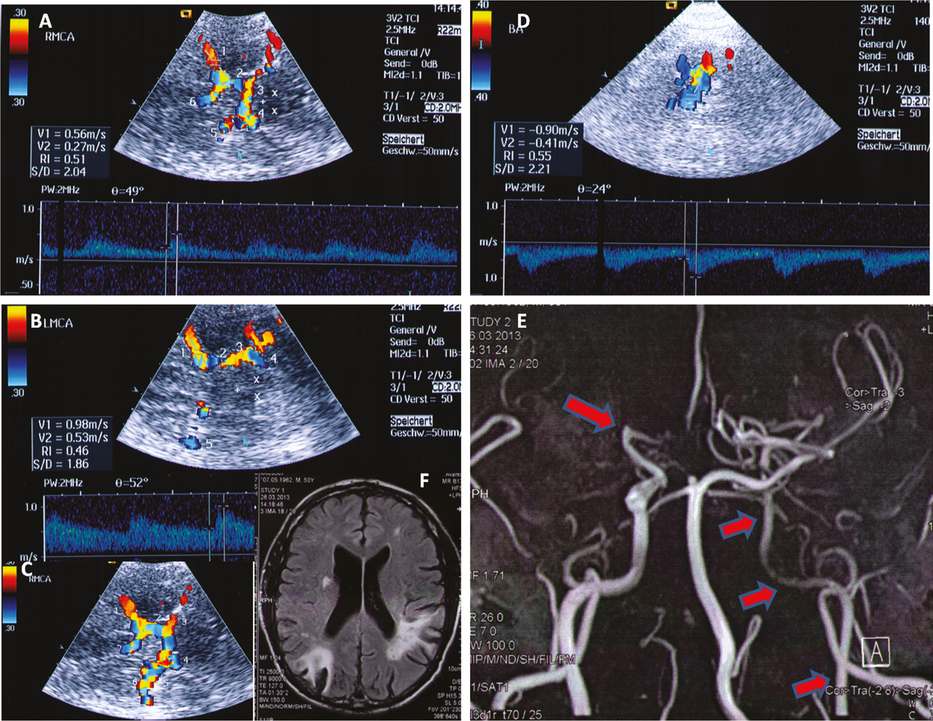
Intracranial collateral circulation. Case study: occlusion of the right MCA and a high-grade stenosis of the extracranial left ICA in a 56-year-old man with bilateral ischemic lesions in the left and right middle cerebral artery territories with good clinical recovery of the neurological symptoms due to favorable intracranial collateral supply. (A) Right MCA with reduced blood flow velocities (maximum systolic flow velocity = 56 cm/s) – despite no visible flow in the MCA in MRA. 1 = right MCA; 2 = right posterior communicating artery; 3 = P1 segment of the ipsilateral (right) PCA; 4 = P1 segment of the left PCA; 5 = contralateral (left) MCA; 6 = A2 segment of the ACA. (+) = midline, (x) = brainstem. (B) Left MCA with increased blood flow velocities (maximum systolic flow velocity = 98 cm/s) due to collateral supply of the right hemisphere. 1 = left MCA; 2 = left posterior communicating artery; 3 = P1 segment of the left PCA; 4 = P2 segment of the left PCA; 5 = right MCA. (+) = midline, (x) = brainstem. (C) Collateral supply of the right MCA territory via the left MCA and via the posterior communicating arteries. 1 = right MCA; 2 = right posterior communicating artery; 3 = P1 segment of the right PCA; 4 = P1 segment of the left PCA; 5 = left posterior communicating artery; 6 = left MCA. (D) Increased blood flow velocity in the basilar artery due to collateral supply of the right hemisphere (maximum systolic flow velocity = 90 cm/s). (E) MRA showing the occlusion of the right MCA (M1) at the origin (large arrow) and an extended high grade stenosis of the left extracranial ICA (three small arrows). (F) MRI image showing bilateral ischemia in the MCA territories. (MRI, MRA images: By courtesy of Radiologie Dr. Sollfrank, München.)
Related posts:

Stay updated, free articles. Join our Telegram channel

Full access? Get Clinical Tree


