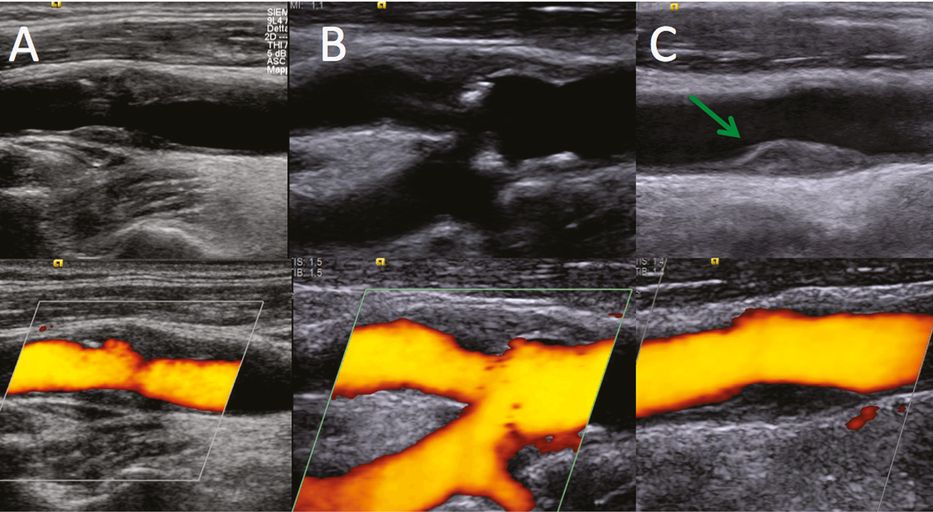
B-mode (top) and color power Doppler (below) of plaques with different echogenicity. (A) A hyperechoic with acoustic shadow, irregular surface calcific plaque; (B) isoechoic, smooth surface fibrous plaque; (C) iso-hypoechoic fibrolipidic plaque; (D) heterogeneous, proximally calcific hyperechoic and distally fibrous isoechoic plaque.
Plaque surface
Another important – yet debated – plaque characteristic taken into consideration to identify the plaque-at-risk is the plaque border. First observations were derived from traditional angiography, showing an “excavation” in the surface of acute symptomatic plaques. There followed uncertainties in the correlation with histological samples, addressing research efforts to increase sensitivity in the recognition of ulcerations with other noninvasive techniques [12]. Even though several studies reported the advantages of ultrasound for the diagnosis of carotid plaque ulceration, criteria for plaque ulcer description have been proposed, defining that an excavation should measure at least 2 mm in depth and 2 mm in length, with a well-defined back wall shown by B-mode sonography and an area of reversed flow within the recess as shown by Doppler color-flow imaging [13]. From a pathological point of view, the presence of the endothelium and an intact fibrous cap prevents the exposure of atheroma thrombogenic components to blood flow. In this regard, in order to correlate the presence of an ulceration with the acute stroke, it should be hypothesized that – at the time of symptoms onset – plaque surface suddenly breaks and induces activation of the coagulation cascade and platelet adhesion, thrombosis and distal artery-to-artery embolization. Nonetheless, plaque irregular surface and ulcerations have been inconsistently demonstrated as an independent stroke risk factor in clinical studies: a possible explanation, regardless of criteria used for its identification, may be that acute ulcerations are different from chronic ones, in which the “healing” causes a re-endothelization, thus reducing the potential embolic risk (Figure 5B.2A,B).
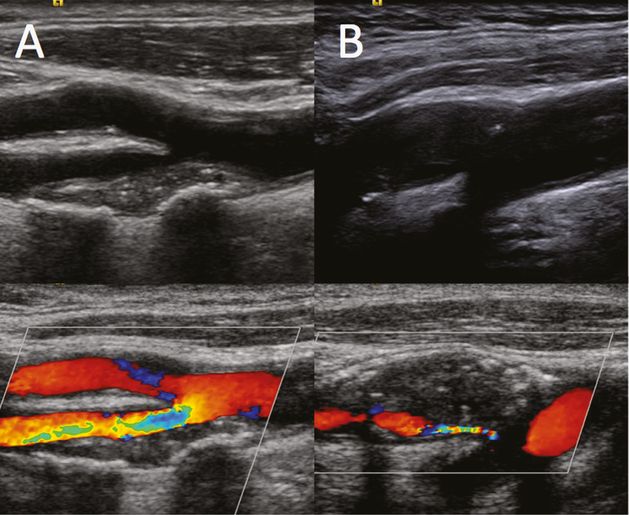
B-mode (top) and color power Doppler (below). (A) recent acute ulcerated plaque: note the ulceration and the absence of intimal layer at the bases of the niche; (B) chronic ulceration: the base of the rupture shows a hyperechoic intimal layer, expression of healing and re-endothelization; (C) isoechoic fibrous plaque shows minimal fibrin strands in the distal part (green arrow); high-resolution ultrasound allows a detailed real-time visualization in respect to color power Duplex.
With the development of more accurate imaging, including high-resolution ultrasound, plaque cap thinning and degradation, ulceration and plaque fissuration, differentiating acute rupture from occasionally observed chronic ones has become feasible (Figure 5B.2C). Recent views have reported that thrombus formation over the plaque surface may also occur in nonruptured surfaces and low-flow conditions with fibrin platelet adhesion on surface irregularities have been identified [15]. Potential triggers for adherence of platelets and thrombotic cascade activation may be an enhanced thrombogenic state, deficiencies of antithrombotic molecules, and active tissue factors transferred to adherent platelets by activated leukocytes [16].
Abnormal plaque motion
Plaque motion analysis – that is, plaque movements along the vessel wall, rotation and local deformation – may bring new insights in understanding the mechanisms responsible for plaque rupture and volume increase. Plaque movements may indeed represent the mechanical transmission to plaque surface of tears in the deep plaque texture. Consequently, the analysis of plaque movements and shear stress might provide information on the probability of plaque fissuring and rupture [17]. Meairs and Hennerici in 1999 [18] had already described the use of four-dimensional ultrasonography to acquire temporal three-dimensional data of carotid artery plaques during the cardiac cycle: they observed that asymptomatic plaques had a homogeneous orientation and magnitude of computed surface velocity vectors, coincident with arterial wall movement, with respect to symptomatic plaques showing plaque deformation not aligned with arterial wall movements. In 2003, Ramnarine and colleagues [19] applied tissue Doppler imaging of carotid plaque to study plaque wall motion, observing that this new method is limited by a high variability. Bang et al. in 2003 [20] reported that the motion analysis with radiofrequency ultrasound imaging might provide information about the plaque characteristics. Currently, it is a field that requires further standardized investigation.
Microemboli detection
Platelet adhesion and aggregation on a vulnerable plaque surface may cause emboli formation with fragmentation of the particles into the distal intracranial circulation. Transcranial ultrasound monitoring can easily identify microemboli (high-intensity transient signals, HITS or microembolic signals, MES) as transitory signals in intracerebral arteries, while T2-weighted magnetic resonance imaging might disclose incidental small white matter lesions. Both findings are alarming, indicating a high stroke risk of echolucent plaques even though asymptomatic, when identified on routine examination [13,21,22,23] or through specific, long-lasting monitoring. However, ultrasound monitoring is time-consuming and requires a trained observer to obtain reliable data, therefore its use in routine assessment of carotid plaque might not be not feasible, but it has indications as a risk predictor in selected cases.
Inflammation
The exact pathophysiological mechanisms that cause plaque progression and that transform an asymptomatic lesion into a symptomatic one are not yet completely understood. After the first observations in coronary artery diseases, inflammation has been hypothesized as a central factor in the progression of atherosclerotic plaques. Histological specimens have indeed clearly shown that while a chronic inflammatory infiltrate is present in stable plaques, an active, acute inflammation process regarding the surface and the cap is represented in vulnerable and ruptured plaques, with a related highly heterogeneous aspect [24]. Strictly connected with inflammation, adventitial vasa vasorum and angiogenesis have been identified in histological studies as markers of instability in atheromasic lesions of cerebro- and cardiovascular patients [25,26,27,28]. Vessels indeed grow normally within the plaque texture, and atheroma vulnerability and symptomatic carotid disease have been associated with an increased number of microvessels [27]. The rupture of these small, fragile, newly generated vessels may also be related to the intraplaque hemorrhage, an event that provokes a dramatic plaque volume increase [29] (Figure 5B.3). The idea to stage in vivo this inflammatory process and establish “plaque activity” has been the object of several imaging techniques aimed at visualizing the “functional” status of the atheroma. Computed tomography angiography, magnetic resonance angiography and 18-FDG positron emission tomography have focused on the evaluation of the “plaque metabolic activity,” but, to date, this is an evolving methodology that requires further consensus [30]. Carotid ultrasound, with UCAs, is an established valuable tool to identify adventitial vasa vasorum and plaque neovascularization, with the principal advantages of being a simple, low-cost and minimally invasive technique available in vivo.
B-mode (top) and color power Doppler (below). (A) an example of a highly heterogeneous, unstable plaque determining hemodynamic stenosis; (B) an acute, very low-echogenicity ruptured plaque with intraplaque hemorrhage and a dramatic volume increase leading to severe, tight stenosis.
In the following sections, we will describe contrast carotid ultrasound methodologies and correlations between ultrasound findings and clinical implications. We will also illustrate the advantages of contrast imaging in clinical practice, by providing a better definition of plaque morphology, and in research studies, by detecting angiogenesis (Table 5B.1).
| When to use: |
| In moderate-to-severe internal carotid artery stenosis, whether symptomatic or asymptomatic. |
| (a) Advantages in clinical routine: |
| – better intima–media thickness visualization – better plaque surface definition, especially in cases of calcified plaques with acoustic shadowing – more sensitive identification of plaque rupture and plaque ulcerations – improved sensitivity in detecting carotid pseudo-occlusion – improved vessel wall identification in difficult cases |
| (b) Research objectives: |
| – to identify vasa-vasorum and intra-plaque angiogenesis – to identify angiogenesis and neovascularization in remodeling thrombotic material |
Contrast ultrasound exam execution: machine set-up and protocol
Since the first data published in 2006, various groups have reported on the use of UCAs in carotid evaluation [31–44]. The protocol has also been described and standardized in a Consensus meeting held in Munich in 2011 during the 16th Congress of the European Society of Neurosonology and Cerebral Hemodynamics [45].
Apparatus
Ultrasound scanning should be performed with up-to-date ultrasound equipment and machine-specific low-mechanical index software for contrast-enhanced ultrasound. The same user-defined ‘‘presets’’ need to be maintained at constant levels in different examinations in order to allow comparisons between different patients as well as in the same patient during follow-up visits. Images in the present chapter were obtained using a Siemens S2000 system, with standard vascular presets, equipped with contrast multipulse, nonharmonic, real-time Cadence™ contrast pulse sequencing (CPS) imaging software. Linear phased array probes (9L4) with standard CPS settings (mechanical index 0.10) were used. The “Contrast Agent only” software feature, in which the image presented derives exclusively from the microbubble signals, was used, avoiding mixed B-mode/contrast visualization. All the examinations were digitally stored and DICOM files transferred to an external PC equipped with Windows XP and Showcase software (Trillium Technology, version 5.1) for the off-line analysis.
Basal evaluation
The first step in recommended protocols is the standard, basal evaluation of the carotid plaques, which is aimed at obtaining the ‘‘best view’’ images. Plaque ultrasound morphology should be categorized according to criteria that have been clearly established in the literature [11,12,13,14]. Plaque structure is identified according to its echogenicity and considered as hyperechoic with an acoustic shadowing, hyperechoic, isoechoic or hypoechoic, and consequently classified as calcific, fibrous, fibro-calcific, fibro-fatty and hemorrhagic. Echogenicity may also be more objectively quantified off-line by means of GSM computerized analysis [10], which identifies a low echogenicity “cut-off” to better define the plaque at risk. Plaque surface is defined as regular, irregular, or ulcerated when an excavation ≥ 2 mm is observed [13]. The degree of stenosis is evaluated either according to the European Carotid Surgery Trial (ECST) criteria [46], that is, as a percentage of the difference between the original vessel lumen diameter/area and the residual lumen diameter/area at the maximum site of stenosis. Some studies also use the North American Symptomatic Carotid Endarterectomy Trial (NASCET) criteria [47], that is, as a percentage of the difference between the distal diameter/area of the internal carotid artery and the residual lumen diameter/area at the maximum site of stenosis. All measurements must be correlated with the blood flow velocities [48].
Contrast administration and patient preparation
After the basal plaque evaluation has been completed, prepare the patient with a line in an antecubital vein (20-gauge Venflon). In order to preserve the microbubbles, which are fragile once reconstituted with the saline included in the package, the bolus must be injected immediately after the solution has been shaken, directly into the line of the Venflon (i.e., not from the top) through a three-way stopcock, thereby making it easier to screw and unscrew the syringe to the Venflon connector to recharge the contrast agent. The use of butterflies should be avoided because part of the UCA will remain in the catheter. Contrast ultrasound investigations are performed with repeated small (0.5–2 ml) bolus injections of SonoVue (Bracco Altana Pharma, Konstanz, Germany). Half the dosage contained in the contrast agent package (i.e., 2.5 ml) is generally sufficient for the evaluation of one side of a patient, starting with a 2-ml bolus, followed by a second short 0.5-ml bolus after some minutes.
The use of a saline flush after UCA bolus injection needs to be considered carefully: the saline flush is usually performed after contrast agent administration in computed tomography and magnetic resonance imaging to enhance the homogeneity of the contrast agent delivery in the blood flow stream, for the wash-in, wash-out evaluation or when acquisition times are short. The use of this method is theoretically of limited value with UCAs for carotid plaque assessment, because the scanning and acquisition times are much longer, and are not based on the UCA first pass, but on the analysis of the UCA in a “steady state” of up to 10 minutes. Nevertheless, a brief saline flush of 5 ml (performed either through the top of the Venflon or through one of the stopcock’s three ways) injected when the UCA starts to dissolve, approximately 4–5 minutes after the first bolus administration, helps to clean the line and to gain another short period (20–30 seconds) of contrast enhancement. Moreover, in this way the quantity of contrast agent used to perform the exam can be further reduced. A timer on the screen that records the starting time of the first bolus is essential to check how much time has elapsed.
Five to 10 minutes after the first 2-ml bolus has been injected and the line has been flushed with saline, a second or even a third small (0.5-ml) UCA bolus may help to focus on particular findings observed during the first injection. Washing the line with a small (5-ml) saline flush whenever the signal of the UCA starts waning may extend the period of visualization and reduce the amount of UCA used.
High acoustic power repeated “flashes,” might be applied to destroy the microbubbles within the plaque texture and observe the “refill kinetics”; however, it should be borne in mind that the mechanical force used to destroy the microbubbles is comparable, at least in theory, to the principle of contrast-enhanced sonothrombolysis in intracranial clots: when the destruction of microbubbles is rhythmically repeated in particularly soft, unstable lesions that are prone to rupture, a harmful effect may be hypothesized.
The overall UCA examination does not generally last longer than 10–15 minutes per side.
Image interpretation
A few seconds are required after the UCA bolus injection for the microbubbles to be carried through the peripheral venous system to the pulmonary filter, left heart and carotid arteries. In cases of jugular valve incompetence, after some heartbeats it is not uncommon to observe the UCA refluxing into the jugular vein in a retrograde direction toward the brain, long before its appearance in the carotid arterial lumen.
General imaging
Figure 5B.4 shows examples of the carotid bifurcation in color (A,B) and contrast imaging with a specific CPS contrast software modality (A1,B1). Using UCAs, visualization can be enhanced both in cases in which the basal color visualization is per se optimal (Figure 5B.4A,A1) and in cases where tissue echogenicity provides suboptimal basal color visualization (Figure 5B.4B,B1). The pitfalls and difficulties encountered when using UCAs are similar to those of standard ultrasound imaging: an initial “blooming effect,” resembling an excessive color gain, due to the very high contrast enhancement from the microbubbles may be observed within seconds of their appearance in the carotid lumen (Figure 5B.5A1); hard calcified tissues inducing a strong acoustic shadowing below the calcification may block UCA reflection (Figure 5B.5B1); visualization may also be poor when neck tissue echogenicity is poor and vessels are too deep for optimal insonation (Figure 5B.5C1).
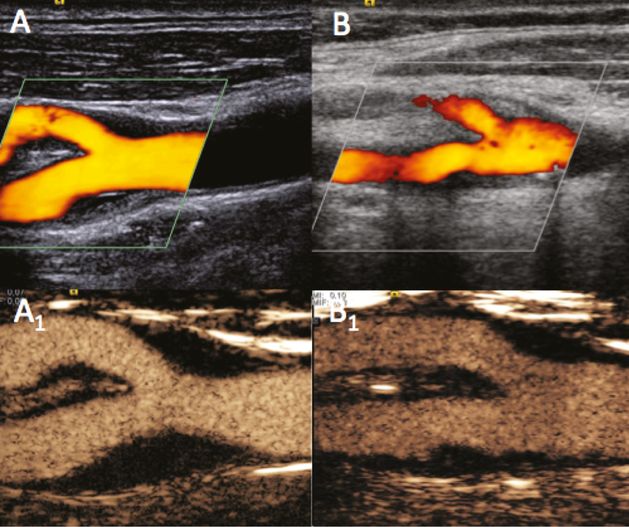
Examples of carotid bifurcation visualization using color power Doppler (A,B) and UCA imaging with a specific CPS contrast software modality (A1,B1). (A) A case of optimal basal visualization. (B) A case of basal difficult visualization owing to neck tissue echogenicity, which improved following UCA administration.
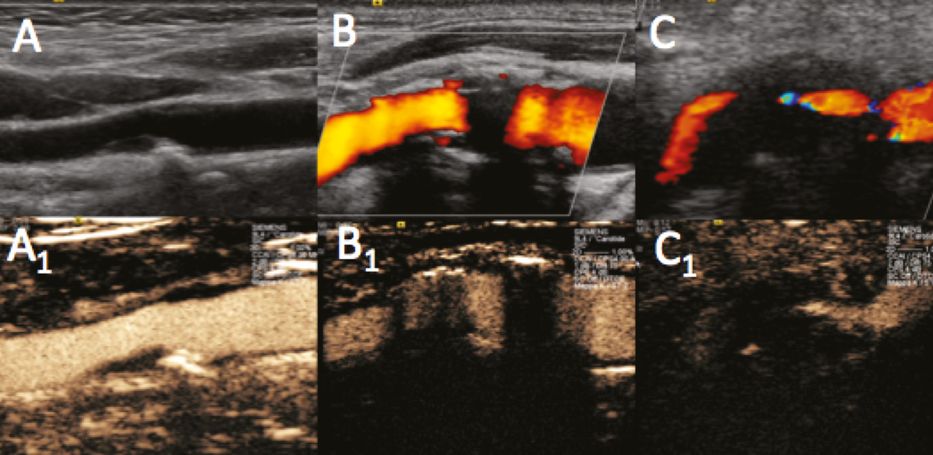
Pitfalls and difficulties during UCA examination execution. B-mode (A), power Doppler (B,C) and UCA imaging (A1,B1,C1). (A1) Initial “blooming effect” due to high UCA concentration during first pass. (B1) “Hard” calcifications with acoustic shadowing resistant even to UCA reflection. (C1) “Difficult” neck tissue echogenicity with vessels too deep for optimal insonation.
Morphology definition
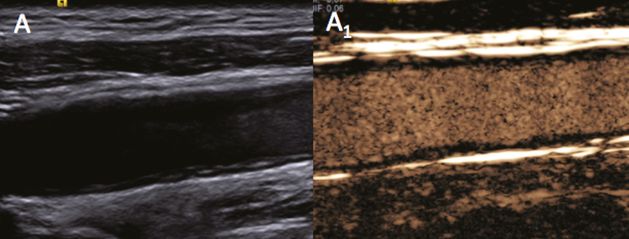
The different layers of the intima–media can be visualized more clearly by using UCAs. When boundaries are difficult to identify, as may occur in the near wall with the B-mode even when tissue harmonic imaging and spatial compound are used (Figure 5B.6A), UCAs may provide a better image (Figure 5B.6A1). Moreover, the microbubbles can be seen running parallel to the vessel wall in the external layers, thereby highlighting the external vascularization of the adventitia.
Sensitivity in the detection of plaque ulceration and surface rupture has always been a subject of debate within the context of vascular diagnosis, and ultrasound is often compared with other conventional radiological imaging methods. UCAs can increase sensitivity in the detection of ulcerations when compared with color imaging alone, particularly when low flow within the ulceration does not induce the typical color changes (Figure 5B.7A–A1,B–B1). Moreover, surface rupture may be visualized even in small plaques, whereas standard imaging tends to reveal a normal border and fibrous cap (Figure 5B.7C); indeed, when UCA is used, the microbubbles clearly identify the fissuration by diffusing from the vessel lumen into the atherosclerotic lesion (Figure 5B.7C1). In patients with acute ischemic stroke, the detection of plaque rupture may be of fundamental pathophysiological importance as it may identify the plaque responsible for the ischemic symptoms even in moderate stenoses.
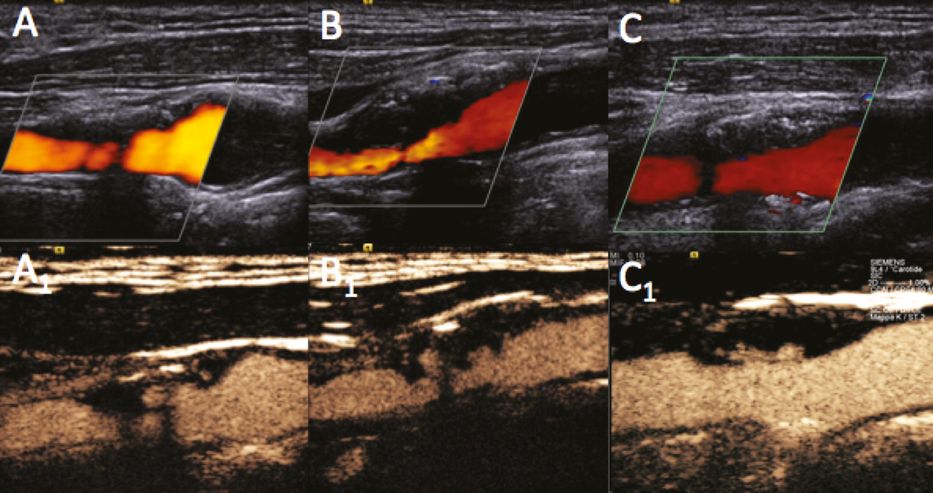
Better identification of plaque surface, particularly in the “near wall” revealing plaque ulcerations (A,B) and plaque rupture (C). Power Doppler (A,B,C) and UCA imaging (A1,B1,C1). Detection sensitivity to ulcerations may be increased by using UCA rather than color imaging alone, particularly when the low flow inside the ulcerations does not induce the typical color changes.
In particular conditions, UCA can help to confirm a carotid occlusion. Even though the hemodynamic evaluation is fundamental for the diagnosis (Figure 5B.8B, small boxes), UCAs may indicate the absence of a signal in case of proximal occlusion (Figure 5B.8A1), as well as a proximal vessel patency in case of distal occlusion. In the latter, the slow, turbulent flow of the blood moving in the proximal part of the distally occluded vessel may display typical turbulences and initial aggregation phenomena leading to secondary local thrombus formation and vessel occlusion (Figure 5B.8B1).
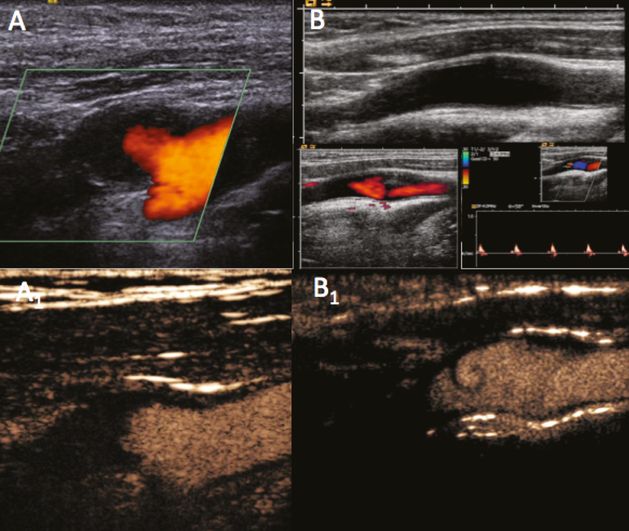
Internal carotid artery proximal (A) and distal occlusion (B). Power Doppler (A,B), hemodynamic evaluation (B small boxes) and UCA imaging (A1,B1,). After the hemodynamic evaluation, UCA may confirm the absence of signal in case of proximal occlusion (A1), as well as the patency of the proximal vessel in cases of distal occlusion with low, turbulent flow (B1).
Related posts:

Stay updated, free articles. Join our Telegram channel

Full access? Get Clinical Tree


