CHAPTER 7 Cellular Mechanisms of Brain Energy Metabolism
Brain Work Supports Information Processing
The minimum energy cost of binary operations can be calculated from the decline in entropy, which happens only by means of an energy supply. The value must be compared with the actual cost of implementing the mechanical operation. These comparisons suggest that the cost of mechanical implementation of the binary operations in the brain is at least 9 orders of magnitude greater than the cost of the logical operation, which may be as low as 5 × 10⁻²¹ J.1 In contrast, Laughlin and colleagues2 and Abshire and Andreou3 reported that a single binary operation of the blowfly retina requires a minimum energy supply of 2 to 20 × 10−12 J. This is 9 orders of magnitude greater, thus suggesting that the cost of the logical operation is negligible.
Brain Work Maintains Ion Concentrations
It is not known how much of the ATPase activity that fuels the dynamic transfer and processing of information is necessary to keep the cells intact at the resting steady state and poised and ready for increased functional activity. Several lines of evidence suggest that the ATPase activity associated with the functional activity of information transfer varies from a value that is no more than twice the absolute minimum required to maintain cellular integrity to a value that is an order of magnitude greater. Whether the actual changes in information transfer are reflected in proportional changes in energy turnover is not known; however, it appears that energy turnover is generally maintained at specific thresholds associated with major categories of functional activity (see Fig. 7-1 later) rather than being coupled to the moment-to-moment fluctuations in brain function, with minimal variation in the energy turnover rate in response to the fluctuating functional contingencies of each category. This description introduces the concept of a “subliminal” fringe of membrane potential difference that is maintained just below the level required to initiate the exchange of nerve impulses among neurons. This means that the actual initiation and regulation of impulse activity can take place with very little change in the energy turnover rate. Consistent with this is the small cost of the logical element of a binary operation when the mechanical part of the operation is poised very close to the all-or-none position of the switch, as well as measurements of brain states’ influence on the generation of impulses among neurons.4
The impulses that neurons exchange are known as action potentials. The classic “sodium theory” explains both the origin of the membrane potential and the graded or alternating depolarization of cells induced by the presence of sodium, calcium, potassium, and chloride equivalents as free ions in the intracellular and extracellular spaces, as well as the action on and the action of specific ion channels in the plasma membranes across which the ions move.5 The membrane potential differences are diffusion potentials established by the membrane conductances controlled by the channels that determine the ion permeabilities. The conductances of sodium and potassium associated with the resting membrane potential and the increased conductances associated with excitation above a baseline or a resting or “default” average are matched by the active ion pumping that strives to maintain constant ion concentrations.
The plasma membrane, or P-type, Na+,K+-ATPase is the protein that enables transport of the major ions across the semipermeable membranes. The protein combines with ATP, magnesium (Mg2+), Na+, and K+ to form an enzyme-substrate complex in which the enzyme is phosphorylated and the Mg2+ ions and adenosine diphosphate (ADP) are released.6 As the phosphorylated enzyme splits into inorganic phosphate (Pi) and the original enzyme, Na+ and K+ ions are translocated in the appropriate directions, outward for sodium and inward for potassium. The energy released by the hydrolysis of ATP at a rate of, for example, 5 µmol/g per minute is sufficient to transport 15 µmol Na+ per gram per minute and 10 µmol K+ per gram per minute. In the steady state, a chloride flux matches the difference between the sodium and potassium fluxes and thus renders the total ion flux electroneutral. In steady-state conditions, the ion fluxes equal the diffusion rates in the opposite directions. The resulting half-life of sodium in the cells is less than a minute under normal circumstances.
The actual ion concentrations and the permeability of the membrane to the ions together determine the membrane potential difference. The average membrane potential approaches the potassium equilibrium potential. Intuitively, it makes sense that the potassium ion, which has greater permeability in the membrane, has the major influence on the sign and magnitude of the membrane potential difference. In the steady state, the apparent average potassium and sodium ion permeabilities, or the membrane permeability–surface area products, can be calculated from the potassium and sodium ion transport fluxes. The average ion concentrations vary among cells and tissue; typical values are listed in Table 7-1. Using the typical values of the average steady-state membrane potential difference, the potassium and sodium fluxes calculated from measured ATP turnover rates, and the 3:2 ratio between the net sodium and potassium fluxes in the steady state,7 the average permeability–surface area products of sodium, potassium, and chloride ions can be calculated by means of Goldman’s flux equation (Table 7-2).8,9 The calculation ignores the calcium ion flux, which represents only a small fraction of the total energy requirement, although it is of major functional significance.10
Brain Energy Metabolism Enables Brain Work
The exact mechanism that links the work performed by brain tissue and the rate of metabolism under steady-state conditions is unclear. When concentrations of metabolites by definition do not change in the steady state, it is hard to conceive of feedback signals that can provide the link. Noradrenaline and the transmitter vasoactive intestinal polypeptide (VIP), when mediated by accumulation of cyclic adenosine monophosphate, both promote glycogenolysis and mobilize glycogen in the cerebral cortex.11 Activation of metabotropic receptors also increases oxidative energy metabolism in brain tissue slices.12 This suggests that monoaminergic neuromodulation regulates both neuron excitability and the energy metabolic rates of glycolysis and oxidative phosphorylation. Because intracortical VIP neurons have a narrow field of action whereas there is wide intracortical expansion of noradrenergic fibers, the two systems may serve to focus the modulation: VIP regulates the energy metabolism locally, within individual cortical columns, and norepinephrine exerts an effect across multiple columns.13
Definition of Brain Activity Levels
Brain functions vary and brain activity varies with these functions. Internal brain states regulate sensory perception, sensorimotor coordination, and learning, as reflected in different patterns of cortical synchrony.4 However, in the presence of distinct brain states, it is unclear that the work and the energy turnover rates change in direct proportion to the functional activity. The definition of a baseline functional activity and the issue of the brain’s normal or average activity are debated. Recent descriptions of brain functional activity distinguish between activation, default, resting, and baseline states, but the definitions of these states are not yet universally understood or accepted.
The issue hinges on the definitions of baseline and average functional activity in relation to the different rates of metabolism in these states. Work by Shulman and colleagues implies that steady-state functional activity is related to rates of release of the excitatory neurotransmitter glutamate and the linearly correlated rates of energy metabolism.14–17 In this work, the highest rates of glutamate release and energy metabolism are about twice the average rates observed in the resting awake or “default” state of these brains,18 which in turn are twice the rates observed in apparently unconscious but otherwise intact brains. These rates turn out to be about twice the rates associated with a completely inactive but intact baseline state, which in turn are about twice the rates associated with the state of absent ion transport. This state is not compatible with survival because the necessary ion gradients gradually dissolve.
Brain energy metabolism probably doubles for every categoric increment in functional activity, although within each brain, energy metabolism may be fairly constant (Fig. 7-1). By categoric increment is meant a change from one fundamental state of functional activity to the next. These stages are illustrated in Figure 7-1 and include the states of no ion transport (stage 0 or metabolic baseline), ion transport but no functional activity (stage 1 or functional baseline), low functional activity without consciousness (stage 2), normal functional activity with consciousness (stage 3 or default activity), and high functional activity associated with the highest level of physiologic activation (stage 4). Activity above stage 4 may be pathologic. Panel B shows that the metabolic or work rates associated with these stages can be described by the simple formula
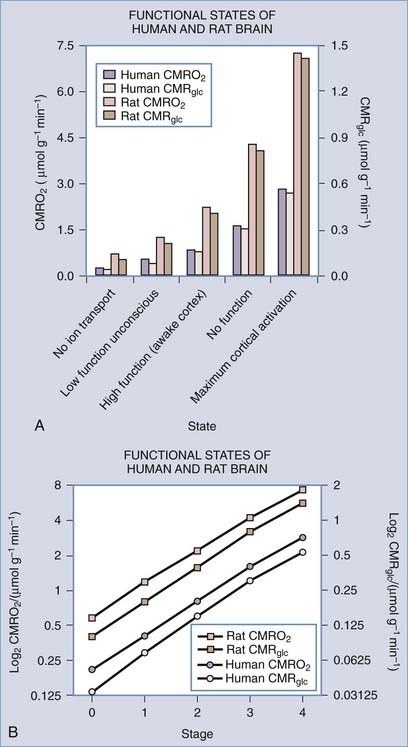
(Data from studies of rat or human brain summarized by Shulman,16 Hyder,17 Gjedde,19 and their colleagues.)
where CMR is the cerebral metabolic rate, CMR(0) is the cerebral metabolic rate of stage 0, and S is one of the five functional stages (0 to 4) defined earlier. The equation has an interesting similarity to the formula (see earlier) for a system that holds S bits of information. It probably shows that distinct internal brain states dynamically regulate cortical membrane potential synchrony during behavior and define specific levels of cortical processing.4
Description of Brain Activity Stages
Metabolic and Nonfunctional Baselines (Stages 0 and 1)
It is likely that maintenance of the membrane potential makes the major contribution to brain energy utilization at the nonfunctional baseline (stage 1). The fraction of metabolism of isolated brain tissue associated with the transport of sodium and potassium is approximately half of the metabolism of the low functional state of isolated brain tissue.20 About half of the nonfunctional baseline remains when ion transport in isolated nervous tissue is blocked completely by inactivation of Na+,K+-ATPase.21–24
Low Functional State (Stage 2)
The unconscious baseline can be thought of as a state of lowered but not absent functional activity in which higher cognitive activity is not present. The state exists in conditions of severed cortical connections, coma, persistent vegetative state, or anesthesia. In these conditions, the metabolic rate is close to 50% of the normal resting awake or default average.25–33 Here, work is associated with lowered but not absent depolarization of neuronal membranes, and the rate of work is about half of the work imposed by the average degree of depolarization existing in the resting awake or default condition.
Normal (Default) and Physiologically Elevated Functional States (Stages 3 and 4)
The normal or default metabolic stage refers to the awake and normally functioning mammalian brain. This stage has been better studied in awake humans than in other mammals. Stage 3 metabolism refers more accurately to the cerebral cortex of a resting awake human being, whereas whole-brain values tend to represent a mixture of stage 2 and 3 metabolic states. Recent steady-state values for the human brain are listed in Table 7-3, together with the estimated steady-state turnover rates of ATP, pyruvate, and lactate.
TABLE 7-3 Average Properties of Human Whole Brain and Cerebral Cortex
| VARIABLE (UNIT) | WHOLE BRAIN | CEREBRAL CORTEX |
|---|---|---|
| CMRGlc (µmol/g/min) | 0.25 | 0.30 |
| CMRO2 (µmol/g/min) | 1.40 | 1.60 |
| CBF (mL/g/min) | 0.43 | 0.50 |
| OGI (ratio) | 5.6 | 5.3 |
| ATP turnover (JATP, µmol/g/min) | 6.25 | 7.5 |
| Pyruvate turnover (JPyr, µmol/g/min) | 0.5 | 0.6 |
| Lactate efflux (JLact, µmol/g/min) | 0.035 | 0.07 |
| LGI (ratio) | −0.14 | −0.23 |
ATP, adenosine triphosphate; CBF, cerebral blood flow; CMRGlc, cerebral metabolic rate of glucose; CMRO2, cerebral metabolic rate of oxygen; LGI, lactate-glucose index; OGI, oxygen-glucose index.
Modified from Kuwabara H, Ohta S, Brust P, et al. Density of perfused capillaries in living human brain during functional activation. Prog Brain Res. 1992;91:209-215; Vafaee MS, Meyer E, Marrett S, et al. Frequency-dependent changes in cerebral metabolic rate of oxygen during activation of human visual cortex. J Cereb Blood Flow Metab. 1999;19:272-277; and Gjedde A, Johannsen P, Cold GE, et al. Cerebral metabolic response to low blood flow: possible role of cytochrome oxidase inhibition. J Cereb Blood Flow Metab. 2005;25:1183-1196.
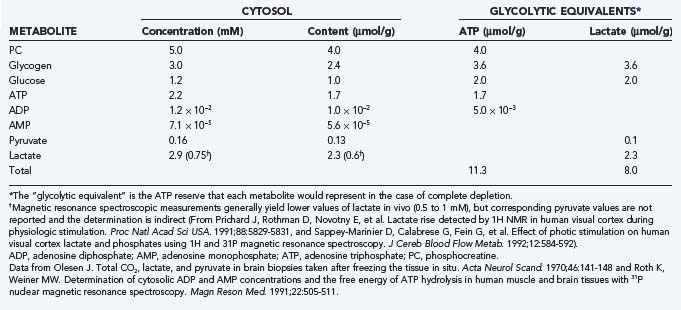
The whole-brain molar oxygen-glucose ratio or index (OGI) is slightly less than 6, thus indicating that about 90% of the metabolized glucose is fully oxidized. At the normal (default) stage, the total glucose consumption of the human cerebral cortex is about 30 µmol/hg per minute, with an OGI of about 5.5. The 10% nonoxidative metabolism of glucose leads to a rate of lactate production of about 5 to 7 µmol/hg per minute. This lactate flux is about 25% of the maximum transport capacity (Tmax) of the type 1 monocarboxylic acid transporter (MCT1, see later) in the blood-brain barrier at a tissue lactate concentration of about 1.5 mM (see Table 7-3). The corresponding ATP turnover in humans is unknown because it depends on the average degree of uncoupling of oxidative metabolism in mitochondria.34,35 In the absence of lactate production and uncoupling in mitochondria, the theoretical upper limit of ATP generation is 38 mol per molecule of glucose. However, with lactate production and uncoupling in mitochondria, the average gain is about 30 mol per molecule of glucose.34,36 Brain tissue metabolite stores are as listed in Table 7-4; an oxidative phosphorylation rate of 7.5 µmol/hg per minute represents less than a minute’s worth of ATP turnover in the human brain.
Atwell and colleagues evaluated the energy demands imposed by the different mechanisms that contribute to functional activity, commonly known as the brain’s energy “budget.”37,38 The main components are the requirements for ion homeostasis and impulse generation. The budget also includes processes such as biosynthesis during functional activity in vivo and neurotransmitter vesicle formation, fusion, and release. In the primate brain, almost all of the energy is spent on the restoration of ion gradients through the action of Na+,K+-ATPase. According to the budget, 90% of the energy turnover is devoted to “synaptic” activity and hence maintenance of membrane potential associated with functional activity in the brain. Eighty percent of the turnover occurs in neurons and about 15% in glial cells.39
Human brain oxygen consumption may increase to as much as 300 µmol/hg per minute under some physiologic circumstances and be accompanied by increased glucose consumption to as much as 50 µmol/hg per minute.16,40 These increases are based on magnetic resonance spectroscopic measurements of the total oxidative metabolism of pyruvate, which may increase to as much as 80 to 90 µmol/g per minute in normal human cerebral cortex.
Metabolism Depends on Delivery of Substrate to the Brain
Glucose Transport
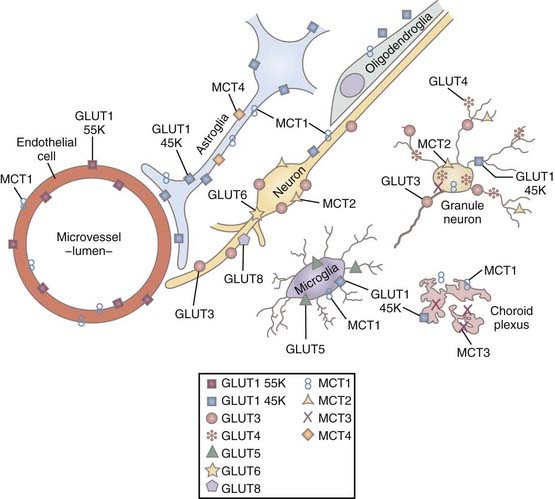
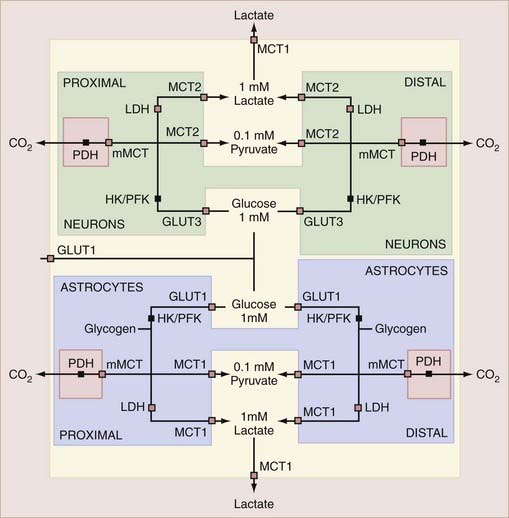
Glucose is the source of pyruvate and enters brain tissue, neurons, and astrocytes by means of facilitative insulin and sodium-insensitive diffusion facilitated by several members of the glucose transporter (GLUT) family of membrane-spanning proteins.41 In brain tissue, the important members of this family are the GLUT1 and GLUT3 proteins.42 The 55-kD GLUT1 protein resides exclusively in the capillary endothelium that constitutes the blood-brain barrier,43 whereas the alternative 45-kD GLUT1 protein belongs to glial cells, the choroid plexus, and the ependyma but is relatively rare in the end-feet of astrocytes close to the blood-brain barrier. The GLUT3 protein occupies the plasma membranes of neurons.44 Transport of glucose is nonlinearly proportional to the difference in concentration between blood plasma and cytoplasm, but it is so avid that the glucose concentration is the same substantial fraction of plasma glucose everywhere in brain tissue.45
The transport capacity of the GLUT1 protein in the blood-brain barrier is known in some detail, and it has been demonstrated that glucose delivery is rarely rate limiting for brain glucose metabolism.42,46 The maximum transport capacity, or Tmax, of the endothelial GLUT1 protein in the blood-brain barrier is about 4 to 8 times the net influx of glucose. This depends on the species, with twice as much glucose being imported as consumed.42,47 The transport properties of the respective neuronal and glial GLUT3 and GLUT1 proteins are less well known. Simpson and associates summarized the existing information and concluded that the maximum transport capacities of GLUT1 and GLUT3 in the respective cellular compartments were 25% and 5% of the total for GLUT1 in endothelium and interstitial glial membranes and 70% of the total for GLUT3 in neuronal membranes.47 Thus, total transport capacity is low in the glial compartment in comparison to the 20-fold higher capacity in the endothelial and neuronal compartments.46 The interpretation raises the question of compartmentation, which is key to the understanding of homeostasis of glucose and other metabolites in brain tissue. The distribution of glucose transporters is shown in Figure 7-2.47
Under normal circumstances, glucose transport is not rate limiting for glycolysis in neurons, but the sufficiency of glucose delivery to glial cells depends on the amount consumed by these cells, which also maintain a reserve of glucose in the form of glycogen. This is the key issue that will be dealt with later: how much of the glucose is consumed by neurons and glial cells, respectively? Blood-brain glucose transport can become rate limiting in pronounced hypoglycemia, and it is in principle possible that it also could be rate limiting in conditions of extreme glycolytic activity unless blood flow keeps pace with glucose demand. In the brains of very active rats, Silver and Erecinska found slight decreases in the extracellular glucose concentration, as determined by means of a glucose-sensitive microelectrode placed in brain tissue.48 Work by Simpson and coworkers found that at a plasma glucose concentration of 6 mM, the steady-state glucose concentration is less in glial cells (0.9 mM) than in neurons (1.2 mM), which in turn is less than in the interstitium (1.4 mM).47
Monocarboxylate Transport
The monocarboxylic acids pyruvate and lactate and the ketone bodies acetoacetate and β-hydroxybuturate49 cross brain tissue membranes by facilitative proton-dependent transport catalyzed by the MCT family of 14 membrane-spanning proteins.50–54 In brain tissue, the important transporters are MCT1, MCT2, and MCT4.55–57 The low-affinity MCT1 and MCT4 transporters dominate the membranes of the capillary endothelium and astrocytes, whereas the high-affinity MCT2 transporter is specific to neurons, particularly the glutamatergic synapses and postsynaptic densities.58,59 MCT2 further appears to be regulated by neuronal activity and glycolytic rates, and the MCT4 protein appears to be specific for astrocytes.57,60 The distribution of MCT is shown in Figure 7-2.47
The members of the MCT family are near-equilibrium proton symporters and as such are influenced by cell pH such that symport declines when pH rises. In view of the surface area of neurons and glia, it is probable that exchange of pyruvate and lactate among the compartments of the brain is nearly at equilibrium in steady-state conditions, as it is for glucose. The MCT2 protein has 5-fold higher affinity (0.7 mM) for pyruvate and lactate than the MCT1 protein (3.4 mM) does and 50-fold higher affinity than MCT4 (30 mM) does,5,7,8,53,61–63 thus indicating that it achieves greater occupancy by lactate at normal concentrations than do the MCT1 and MCT4 proteins (Table 7-5). For this reason, it is likely that lactate’s preference for transport by MCT proteins is determined by the lactate concentration in the brain. At higher concentrations, lactate prefers the MCT1 and MCT4 proteins. However, the lower affinities also mean that the transporter turnover numbers are higher, which makes the approach to a new steady-state faster, other factors being equal. None of the isoforms restrict the exchange of pyruvate at the normal low concentration, but the MCT2 isoform may restrict the exchange of lactate between neurons and the extracellular space at higher concentrations. The restriction depends on the maximum transport capacity of MCT2, which may increase in common with glutamate receptors during activation.64
The maximum transport capacity (Tmax) of the MCT1 protein at the blood-brain barrier is 20 µmol/hg per minute,65 with a Michaelis constant for lactate of about 3 to 5 mM,53 which is higher than the normal lactate content of brain (see Table 7-4). In brain tissue, the combined transport capacities of the MCT1, MCT4, and MCT2 proteins amount to as much as 2.5 mmol/hg per minute, or 100-fold greater than the blood-brain barrier transport capacity.58 Because the Tmax and half-saturation concentrations or Michaelis constants (Kt) of the MCT proteins are about the same for pyruvate and lactate,66 efflux of lactate and pyruvate across the blood-brain barrier under normal conditions is the rate-limiting step in the lactate and pyruvate tissue distributions. For the same reason, export of pyruvate to the circulation is no more than 10% that of lactate and thus may be ignored in the greater perspective of brain energy metabolism. The transport of lactate across neuronal membranes is close to saturation because of the high affinity of the MCT2 protein, which implies that net transport of lactate or pyruvate across neuronal membranes is prevented.67
Both pyruvate and lactate are transported into mitochondria by a specific mitochondrial monocarboxylate transporter (mMCT).68 The exact nature of the mMCT protein is not known, but the bulk of the evidence suggests that it is related to the high-affinity MCT2 transporter,53 although identity with the MCT1 protein is also suggested68,69 because both MCT1 and MCT2 can be found in the inner membrane of neuronal mitochondria. Kinship of the mMCT protein to MCT2 rather than the MCT1 protein is supported by the magnitude of the Michaelis constant of mMCT, which is 0.5 µmol/g, or higher than pyruvate’s concentration of 0.1 to 0.2 µmol/g in the cytosol. The Tmax of 0.3 mmol/hg per minute depends on mitochondrial density,70,71 but in any case it is fivefold higher than the average flux of pyruvate in human cerebral cortex (60 µmol/hg per minute). Thus, on average the rate of pyruvate entry into mitochondria can rise fivefold as the protein approaches saturation.
It is possible that the mMCT protein may become rate limiting for oxidative metabolism in the brain,67 as in the heart.72–74 However, it is more commonly held that the mitochondrial pyruvate concentration saturates the flux-generating pyruvate dehydrogenase (PDH) complex, thus rendering the pyruvate flux independent of the pyruvate concentration and instead a function of PDH and mitochondrial activity.
Oxygen Delivery
Oxygen delivery from blood to brain tissue is limited by its binding to hemoglobin. Other factors, such as specific resistance at the endothelium of brain capillaries,75,76 may also influence oxygen delivery. A significant fraction of the oxygen transported to brain tissue is extracted during the passage of blood in microvessels in the brain. On average, 40% of the oxygen in blood is extracted, but it may increase to as much as 60%. It appears that oxygen is delivered to the tissue entirely by diffusion and that the large extraction lowers the pressure gradient responsible for diffusion of oxygen. It is possible to calculate the loss of oxygen from the blood that flows through capillaries and hence the decline in oxygen partial pressure, which depends on the extraction fraction. Elevation of blood flow that exceeds the increment in oxygen consumption counters the decline in the pressure gradient, as described by simple one-dimensional models of oxygen diffusion to brain tissue.77–79 These models explain the nonlinear relationship between changes in blood flow and changes in oxygen consumption, which ensures that the disproportionately elevated blood flow delivers more oxygen during functional activation. The effect is to maintain mitochondrial oxygen tension relatively constant.
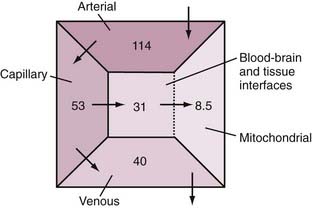
With typical values of the physiologic variables in the equations, the estimated normal distribution of oxygen pressure in the vasculature and tissue compartments is shown in Figure 7-3.80 Quantitative considerations predict that delivery fails when oxygen extraction reaches 60%, in which case extraction cannot increase further because the low capillary oxygen pressure restricts the diffusion.40 The neurovascular coupling responsible for the relationship between blood flow, oxygen delivery, and oxygen consumption has been the subject of research for the past 30 years, but no firm conclusions have yet emerged.
HomeostaTic Mechanisms Maintain Constant Adenosine Triphosphate
and
Under normal circumstances, brain energy metabolism maintains an approximately constant ATP concentration. Observations in the heart and brain suggest that 2- to 10-fold variations in work rate can be sustained with minimal change in ATP.81–85 Thus, the processes that maintain this metabolite must be sensitive (directly or indirectly) to increased ATP utilization by feedback or feedforward mechanisms such as monoaminergic and glutamatergic activation of metabotropic receptors.
Hydrolysis of Phosphocreatine
Creatine kinase (CK) occupies a pivotal role in early buffering of the ATP concentration.85 This cytosolic enzyme has tissue-specific isoforms, including the brain-predominant subtype BB-CK and the Mi-CK isoform bound to the inner mitochondrial membrane. The cytosolic CK reaction is in near equilibrium in living human brain.86,87 The reaction regenerates ATP by transfer of a high-energy phosphate bond from phosphocreatine (PC) to ADP. When the near equilibrium of the cytoplasmic CK reaction is perturbed, it buffers any increase in ADP by increased phosphorylation of ADP. The cytoplasmic PC is replenished by the mitochondrial CK, which in turn is regenerated by hydrolysis of ATP synthesized in mitochondria.88 The advantage is that PC diffuses an order of magnitude faster through the cytosol than do the adenine nucleotides.85 Yet under conditions of high metabolic activity, ATP homeostasis may be limited by the speed of the CK transphosphorylation reaction in mitochondria.88
Glycolysis
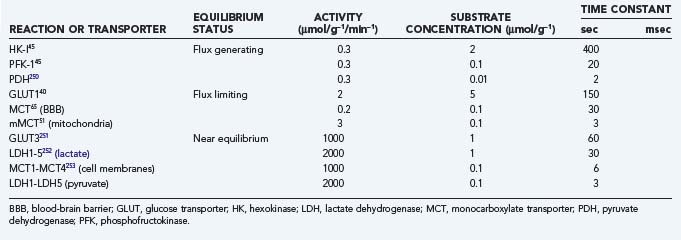
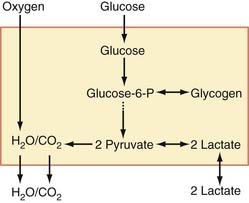
The main reactions and their time constants are listed in Table 7-6, and their interactions are shown in schematic form in Figure 7-4. The time constants dictate the half-times of change, that is, the times that it takes the system to reach the halfway point of a new steady state. It is apparent from Table 7-6 that glycolysis responds to change with time constants on the order of milliseconds whereas oxidative metabolism responds with time constants of seconds or minutes. Hence, oxidative metabolism responds to any stimulus with a certain delay when compared with glycolysis.
Lactate Synthesis
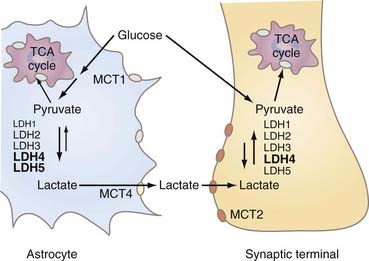
LDH is a tetrameric protein composed of one or more of two subunits, A and B, or M (for muscle type) and H (for heart type), respectively. The combinations yield five normal variants or isozymes (A4 = LDH5, A3B = LDH4, A2B2 = LDH3, AB3 = LDH2, and B4 = LDH1). The brain has all of the isozymes of LDH, but the “muscle” isozymes LDH4 and LDH5 predominate, particularly in astrocytes. Synaptic terminals have a little more of the “heart” isozyme LDH1 than cytosol does in general.89 The distribution of LDH isozymes between the cytosol of both neurons and astrocytes and synaptic terminals is shown in Figure 7-5.89
Both LDH4 and LDH5 have medium affinities for pyruvate and lactate that are close to the normal tissue concentrations of these metabolites, similar to less oxidative tissues such as liver and some muscle cells.90 The relatively intermediate affinities for pyruvate and lactate are reflected in the measured lactate-pyruvate concentration ratio of 10 to 15. Because the near-equilibrium LDH reaction is easily saturated at higher pyruvate and lactate concentrations, these higher concentrations tend to prevent net conversion rates from pyruvate to lactate or vice versa. The observation that the affinity of LDH for pyruvate is 10-fold higher than the affinity of mMCT for pyruvate (see Table 7-5) suggests that pyruvate prefers entry into mitochondria at higher pyruvate concentrations.
where Keq is the equilibrium constant of the LDH reaction. The ratio between the concentrations of lactate and pyruvate is also the apparent ratio between their affinities. At steady state, the ratio must be the same everywhere, given the near-equilibrium and facilitated diffusion nature of the proton symporters of lactate and pyruvate. The constant ratio implies that the different inherent kinetic properties of LDH exist to accommodate differences in the NAD+-NADH ratio in different parts of the tissue.91
It is a common claim that the relatively low affinity of LDH1 for pyruvate makes this enzyme particularly useful to a tissue with high oxidative capacity because it allows rapid buildup of pyruvate, whereas LDH5 is more effective at buffering the increase in pyruvate in a tissue with lower oxidative capacity because of its relatively high affinity for pyruvate. There is evidence that more LDH1 and the mRNA for the subtype are found in synaptic terminals than in neuronal and astrocytic cytosol in general, which in turn appears to possess particularly abundant LDH4 and LDH5 subtypes and their corresponding mRNA.89,92–94 However, it is probably incorrect to infer a net direction of the LDH reaction simply from the presence of a specific subtype in a cell population.95 For practical purposes, it is more useful to regard the properties of the LDH subtypes as being regulated to match the prevailing NAD+-NADH ratios during transient events of activation or deactivation of the tissue, as discussed later.
Oxidative Phosphorylation
At steady state, brain metabolism has a respiratory quotient of unity, consistent with the oxidation of glucose96–98 and with the integration of glycolysis and oxidative metabolism. The net effect of the metabolism of pyruvate to CO2 is to provide the electron chain complexes with the nicotinamide (NADH) and flavin (FADH2) adenine dinucleotides necessary for electron transport and oxygen metabolism. This subsection presents the primary regulatory steps for oxidative metabolism in mitochondria.
Pyruvate Dehydrogenase Complex and the Tricarboxylic Acid Cycle
Recent evidence suggests that mitochondria may import both pyruvate and lactate.68 Inside the mitochondria, the lactate is then reconverted to pyruvate in another LDH-catalyzed near-equilibrium reaction.69,99,100 The pyruvate provides the mitochondrial electron carrier complexes I and II with NADH and FADH2, respectively. Per mole of glucose, 2 mol NAD+ is reduced by glycolysis and 2 mol NAD+ is reduced by the oxidation of pyruvate in the PDH complex. The remainder of the NAD+ and the entire FAD are reduced by the flux-generating tricarboxylic acid (TCA) cycle enzymes citrate synthase and oxoglutarate dehydrogenase. Through the regeneration of guanine triphosphate, the TCA cycle leads to the nonoxidative phosphorylation of 2 mol ATP per mole of glucose. In total, per mole of glucose, 20 hydrogen ion equivalents are extruded from the mitochondrial matrix and join four hydrogen ion equivalents generated in the cytosol. The 24 hydrogen ion equivalents provide the driving force for the rephosphorylation of ADP. In this way, 3 mol of ATP for each mole of NADH oxidized to NAD+ and 2 mol of ATP for each mole of FADH2 are formed from ADP and Pi by the ATP synthase.
Calcium ions play a role in the oxidation of pyruvate by activating the mitochondrial enzymes mediating the nonequilibrium and flux-generating reactions (PDH complex, citrate synthase, NAD+-linked isocitrate dehydrogenase, and the 2-oxoglutarate dehydrogenase complex) that supply the NADH and FADH2 substrates for the mitochondrial complexes I and II.101 In the resting state, mitochondria contain little calcium, but calcium accumulates after excitatory amino acid stimulation of postsynaptic neurons.10,102 Calcium entry is facilitated by the Ca2+ uniporter in the mitochondrial membrane and driven by the mitochondrial membrane potential established by H+ extrusion. Increases in calcium concentration often occur as repeated spikes with steep upslopes and shallower downslopes that reach baseline during sustained excitation.103 A steady agonist level may induce pulsatile release of calcium from calcium stores, and the frequency of this calcium pulsation apparently depends on the agonist concentration.10
Oxidative Phosphorylation
Brain energy metabolism is synonymous with the rate of oxidative phosphorylation of ADP to ATP in mitochondria. This reaction is catalyzed by the proton-driven F-type ATPase in the inner membrane of the mitochondrial cristae, named for its discoverer Ephraim (“F”) Racker104 and now known as ATP synthase. Despite the importance of this process to the entire understanding of brain function, regulation of oxidative phosphorylation in the brain in vivo is still poorly understood. The “near-equilibrium” hypothesis of Erecinska and associates105 and Erecinska and Wilson106 assigned the flux generation to the irreversible reaction between oxygen and cytochrome c and hence to the oxygen tension and the electron saturation and degree of reduction of cytochrome c.107,108 The “near-equilibrium” status refers to the entire electron transport chain and the ATP synthesis reaction, with the important exception of the cytochrome c oxidase reaction.
Cytochrome c oxidase has been calculated to be 95% saturated at the oxygen tension prevailing in mitochondria in human brain in vivo, but its sensitivity to variations in oxygen tension is much greater than implied by this occupancy because diffusion of oxygen from microvessels is impaired at lower mitochondrial oxygen tensions. The “near-equilibrium” hypothesis therefore requires that the maximum reaction rate (Vmax) or apparent affinity (P50), or both, of cytochrome oxidase for oxygen be adjusted in response to the [ADP][Pi]/[ATP], or energy charge, ratio in the cytosol to allow the enzyme to maintain an adequate rate of ATP synthesis. The hypothesis predicts that increases in this ratio change the properties of cytochrome oxidase in such a way that cytochrome c continues to react with oxygen at the rate that matches the rate of cytosolic ATP utilization. There is a theoretical limit to the efficacy of this adjustment, particularly when the cytosolic energy charge is unchanged. In reality, it appears that the near-equilibrium hypothesis assigns the ultimate maintenance of oxygen consumption to the regulation of oxygen delivery, particularly in situations in which mitochondrial oxygen tension threatens to fall below a minimum threshold.40
In rat heart mitochondria, LaNoue and coworkers demonstrated that near equilibrium of oxidative phosphorylation exists when respiration is very slow (state 4) but that mitochondrial ATP synthesis occurs far from equilibrium when respiration is active (state 3).109 These observations show that the near equilibrium of oxidative metabolism could fail in normally and rapidly respiring brain tissue. As a result of the imbalance between oxygen delivery and cytochrome oxidase activity in these states, cytochrome c oxidase does not remain saturated when the mitochondrial oxygen tension declines relative to the average capillary oxygen tension. Energy turnover must therefore fail when mitochondrial oxygen tension declines below a certain threshold, and this takes place very rapidly and in association with loss of consciousness despite adequate intermediate metabolites in the tissue, including ATP.110
Uncoupling
Coupling of oxygen consumption to oxidative phosphorylation depends on the inability of hydrogen ions to escape into the matrix by routes other than through the ATP synthase channels. Alternative routes of dissipation of the hydrogen gradient maintain oxygen consumption by allowing oxide ions to join hydrogens ions without the generation of ATP from ADP. The importance of uncoupling has recently emerged as a potential but still elusive form of control of brain energy metabolism that is not reflected by changes in oxygen consumption. Uncoupling of mitochondria from energy metabolism takes place when protons escape to the matrix through permanent or inducible channels. An important permanent channel is adenine nucleotide translocase, which transfers the newly synthesized ATP out of the matrix. The more active this channel, the greater the leak of hydrogen ions, such that an upper limit of 90% coupling is observed. The lower limit is actually 0% coupling (100% uncoupling) in isolated mitochondria, with a 75% average in the rat in vivo.34 Inducible uncouplers probably also contribute to this average in brain tissue, in which the recently discovered uncoupling protein 2 (UCP2) has been identified. Whether UCP2 plays any role in the regulation of energy metabolism in the brain as a whole or in parts of the brain, such as those associated with appetite control, is unclear.34
Metabolic Compartments Exchange Pyruvate and Lactate
Brain tissue has several populations of cells, all of which play important roles in brain function. This section describes the properties of the separate metabolic compartments of neurons and astrocytes that confer important joint roles of these compartments in the regulation of metabolic responses to excitation. The relationships between the compartments, transporters, and enzymes that determine the exchanges among the compartments are shown schematically in Figure 7-6.
Stay updated, free articles. Join our Telegram channel

Full access? Get Clinical Tree


