Cellular Substrates of Brain Rhythms*
Florin Amzica
Fernando H. Lopes Da Silva
*This chapter was initiated and written in the previous editions by the late Dr. Mircea Steriade (1924-2006). The present authors wish to pay tribute to his outstanding work that has much advanced our understanding of neuronal mechanisms underlying EEG rhythms. They hope to continue and preserve the spirit of his contributions.
Quasiperiodically recurring waves, henceforth termed oscillations, are, besides evoked potentials, one of the essential components of the electroencephalogram (EEG). The curiosity of understanding the cellular counterparts of EEG waves started almost simultaneously with the discovery and description of different EEG patterns during the early 1930s and 1940s as an effort to relate the global graphic aspect of the EEG with its more intimate cellular counterparts. In this chapter, we will discuss how various patterns of oscillatory activity develop in cellular brain networks and are further reflected at the EEG level. The EEG is essentially an electric phenomenon; therefore, we will focus on the ionic currents active during various oscillating patterns but we will also identify the (minimal) anatomical structures necessary and sufficient for the genesis of the aforementioned activities. This approach has unavoidably oversimplifying virtues, while the EEG signal is a complex one. This reality will be recreated through the coalescence of various oscillations that coexist during a given behavioral context.
From its very beginning, the EEG was characterized through its oscillatory nature. Thus the dominant frequency of an oscillation became its main descriptor. This trend was further enforced with the advent of spectral analysis (e.g., Fourier transforms) and is still largely used nowadays. Although this might enclose certain advantages, it also contains numerous pitfalls that prevent the reaching of correct conclusions. This situation is generated by the fact that a given spectral component might ambiguously result either from the presence in the EEG of oscillations or from the contribution of particular waveforms, not necessarily rhythmic, to the EEG spectrum.
In the following we will organize this chapter according to the frequency bands traditionally encountered in the EEG praxis, however, emphasizing the possible sources of haziness related to the interpretation of EEG signals. Furthermore, as a section devoted to the understanding of the cellular mechanisms underlying the genesis of the oscillatory behavior of the EEG, the intracellular data constitutes a very strong, although not absolute, source of knowledge. The reader should, however, keep in mind that, when extrapolating from cellular data to EEG, one should not overlook essential details, such as
Cellular recordings are almost exclusively performed in animals, whose philogenetical development, behavioral, and structural peculiarities are often neglected.
The study of the intrinsic properties of cells is mostly carried out in vitro or in cultures, preparations that are as far as one can imagine from the complex reality of the whole brain, both in terms of network linkages and physiologic state. At best, these preparations would correspond to a deeply comatose brain.
The study of the network interactions, however multisite they might be, is still based on recordings from spatially discrete and limited locations. The assumption of continuity should therefore bear reserve.
Anesthesia is often an unavoidable companion of animal studies, and the elimination of the pharmacologic effect is time and again more complicated than a mere subtraction.
SLOW DELTA RHYTHMS
Grey Walter (1) was the first to assign the term “delta waves” to particular types of slow waves recorded in the EEG of humans. Although Walter introduced the term delta waves in correspondence to pathologic potentials due to cerebral tumors, with time delta activities became more related to sleep and anesthesia. The IFSECN (2) defines delta waves as waves with a duration of more than 0.25 seconds (which implies a frequency band between 0 and 4 Hz). Thus the delta term is associated with frequency bands rather than with phenomena generating specific electrographic patterns. There have been various studies aiming at disclosing the relationship between cellular activities and EEG (3) and the sources of delta activities (4,5). In the following it will be emphasized that the 0- to 4-Hz frequency range reflects more than one phenomenon and that definitions based exclusively on frequency bands may conceal the underlying mechanism. Studies in the last two decades have unveiled the electrophysiologic substrates of several distinct activities in the frequency range below 4 Hz during sleep and anesthesia. Their interaction within corticothalamic networks yields a complex pattern whose reflection at the EEG level takes the shape of polymorphic waves.
It should also be stressed from the beginning that delta activities cover two EEG phenomena: waves and oscillations, with no clear separations between the two, as far as spectral analysis is concerned. The term oscillation designates a repeated variation of a parameter (e.g., current, voltage) between two extreme values, with an optional requirement of regularity of the variation.
However, most of the biologic phenomena resulting from large population interactions, such as the EEG, are rarely associated with clocklike rhythmicity. At the other limit of the definition is the wave, as a single variation of a parameter between two extreme values. From the above definitions it appears that oscillations are made of waves.
However, most of the biologic phenomena resulting from large population interactions, such as the EEG, are rarely associated with clocklike rhythmicity. At the other limit of the definition is the wave, as a single variation of a parameter between two extreme values. From the above definitions it appears that oscillations are made of waves.
As for now, there are at least two cellular sources of delta activities: one originating in the thalamus and the other one in the cortex.
Thalamic delta oscillations have been found in a series of in vitro studies. They revealed that a clocklike oscillation within the delta frequency range is generated by the interplay of two intrinsic currents of thalamocortical cells. Whereas most of brain oscillations are generated by interactions within networks of neurons, but also glial cells, the thalamic delta oscillation is an intrinsic oscillation depending on two inward currents of thalamocortical cells (7, 8 and 9). It was shown that thalamocortical neurons recorded in vitro display rhythmic bursts of high-frequency spikes with an interburst frequency of 1 to 2 Hz. This oscillation results from the interplay between two membrane currents: the transient calcium current (It) underlying the low-threshold spike (LTS) and a hyperpolarization-activated cation current (Ih). Ih is a noninactivating inward (anomalous) rectifier carried by sodium and potassium. The model proposed for the genesis of this clocklike delta oscillation is depicted in Figure 3.1A: when the membrane potential hyperpolarizes (more negative than -70 mV), the Ih becomes activated and produces a depolarizing sag, which in turn will activate the It (deinactivated by the hyperpolarized membrane). The ensuing LTS deactivates the Ih but also generates a hyperpolarizing overshoot that will reactivate the Ih, thus restarting a new oscillatory cycle.
This oscillation was also found in vivo, in the thalamocortical neurons of the cat, after decortications (10, 11 and 12). Thalamocortical neurons from a variety of sensory, motor, associational, and intralaminar thalamic nuclei were able to display a clocklike delta rhythm either induced by imposed hyperpolarizing current pulses (Fig. 3.1B) or spontaneously (Fig. 3.1C). Interestingly, the deafferentation achieved through decortication, by removing the powerful depolarizing impingement from corticothalamic neurons and setting thalamic cells at a more hyperpolarized membrane potential (around -70 mV), was instrumental in permitting the delta oscillation to emerge. However, in intact preparations, with functional corticothalamic loops, the regular thalamic delta oscillation was absent or largely prevented by the ongoing cortical activity (13). At the cellular level, the occurrence of the Ih was blocked during the depolarizing phases of the slow oscillation (<1 Hz; see below), due to the interference of synaptic currents and the ensuing decreased membrane resistance with the intrinsically generated Ih. These more recent findings raised concerns as to the emergence of this intrinsically generated thalamic rhythm at the level of the EEG.
The existence of cortical delta oscillations was suggested on the basis that delta waves, at 1 to 2 Hz, survive in the EEG of athalamic cats (14). Whether such procedures generate a physiologic or a pathologic pattern remains an open question; nonetheless, they create a deafferentation of the cortex. Extracellular recordings of cortical activity during pathologic delta waves (as obtained by lesions of the subcortical white matter, the thalamus, or the mesencephalic reticular [RE] formation) have shown a relationship between the firing probability and the surface-positive (depth-negative) delta waves, whereas the depth-positive waves were associated with a diminution in discharge rates (15). These field-unit relationships led to the assumption that the depth-positive component of delta waves reflects the inhibition of pyramidal-shaped neurons by local-circuit cells, implying maximal firing of inhibitory interneurons during the depth-positive delta waves. However, this has not been found. It was then suggested that, far from resulting exclusively from inhibitory postsynaptic potentials (IPSPs), EEG delta waves are rather generated by summation of long-lasting afterhyperpolarizations produced by a variety of potassium currents in deeply lying pyramidal neurons (16,17).
The discovery of a novel slow-wave sleep- or anesthesia-related oscillation (around, but generally less than 1 Hz) (18), together with its thorough investigation at the cellular level (see below), set the basis for revisiting the cellular basis of delta rhythms. The frequency of the slow oscillation depends on the depth or type of anesthesia, or the sleep stage: it is mainly between 0.3 and 0.6 Hz under urethane anesthesia, between 0.6 and 0.9 Hz under ketamine-xylazine anesthesia, and between 0.7 and ˜1 Hz during natural sleep. This oscillation, termed slow oscillation by its authors, was first described in intracellular recordings from neocortical neurons in anesthetized animals and in EEG recordings from humans (18). It was subsequently found during natural slow-wave sleep of animals (19) and humans (20, 21, 22, 23 and 24).
The slow oscillation is generated within the cortex because it survives after thalamectomy (25), is absent from the thalamus of decorticated animals (26), and is present in cortical slices (27). At the intracellular level, cortical neurons throughout layers II to VI (with physiologically identified thalamic and/or callosal inputs, and with projections to the thalamus and/or homotopic points of the contralateral hemisphere) displayed a spontaneous oscillation recurring with periods of 1-1.5 to 5 seconds, depending on the anesthetic, and consisting of prolonged depolarizing and hyperpolarizing components (Fig. 3.2A). The long-lasting depolarizations of the slow oscillation consisted of excitatory postsynaptic potentials (EPSPs), fast prepotentials (FPPs), and fast IPSPs, reflecting the action of synaptically coupled GABAergic local-circuit cortical cells (18). Data also demonstrated the contribution of both NMDA-mediated synaptic excitatory events and a voltage-dependent persistent sodium current, INa(p), to the depolarizing component of the slow oscillation. On the other hand, the long-lasting hyperpolarization, interrupting the depolarizing events, is associated with network disfacilitation in the cortex. This is supported by the fact that the membrane input resistance is highest during the long-lasting hyperpolarizing component of the slow oscillation (28). The disfacilitation is probably achieved by a progressive depletion of the extracellular calcium ions during the depolarizing phase of the slow oscillation (29) (Fig. 3.2B-C).
All major cellular classes in the cerebral cortex, as identified by electrophysiologic characteristics and intracellular staining, display the slow oscillation: regular spiking and intrinsically bursting cells, as well as local-circuit inhibitory basket cells
(18,30,31). All these neuronal types exhibit similar relationships with the EEG components of the slow oscillation: during the depth-positive EEG wave cortical neurons are hyperpolarized, whereas during the sharp depth-negative EEG deflection cortical neurons are depolarized (Fig. 3.2). The spectacular coherence between all types of cortical neurons and EEG waveforms raised the question of the underlying synchronizing mechanisms. Dual intracellular recordings in vivo revealed that intracellular potentials were highly synchronized among neurons (31,32). This synchronization, displaying time lags as a function of the distance between cortical areas (33), mainly relies on the integrity of intracortical synaptic linkages. Although the coherence was impaired after local blockage of axonal transmission through local injections of lidocaine (Fig. 3.3), the slow oscillation survived at both locations and conserved a rudiment of synchronization suggesting that, besides direct intracortical linkages, other projections, possibly corticothalamo-cortical, as well as networks of gap junctions (see below) might contribute to the synchronization of the slow oscillation.
(18,30,31). All these neuronal types exhibit similar relationships with the EEG components of the slow oscillation: during the depth-positive EEG wave cortical neurons are hyperpolarized, whereas during the sharp depth-negative EEG deflection cortical neurons are depolarized (Fig. 3.2). The spectacular coherence between all types of cortical neurons and EEG waveforms raised the question of the underlying synchronizing mechanisms. Dual intracellular recordings in vivo revealed that intracellular potentials were highly synchronized among neurons (31,32). This synchronization, displaying time lags as a function of the distance between cortical areas (33), mainly relies on the integrity of intracortical synaptic linkages. Although the coherence was impaired after local blockage of axonal transmission through local injections of lidocaine (Fig. 3.3), the slow oscillation survived at both locations and conserved a rudiment of synchronization suggesting that, besides direct intracortical linkages, other projections, possibly corticothalamo-cortical, as well as networks of gap junctions (see below) might contribute to the synchronization of the slow oscillation.
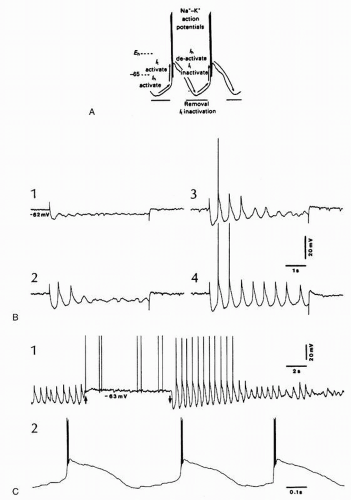 Figure 3.1 Delta oscillations in thalamocortical cells result from the interplay between two intrinsic currents, Ih and It. A: Proposed model for interaction between these intrinsic currents. Activation of the low-threshold calcium current, It, depolarizes the membrane toward threshold for a burst of sodium-dependent fast action potentials. The depolarization inactivates the portion of Ih that was active immediately before the calcium spike. Repolarization of the membrane due to It inactivation is followed by a hyperpolarizing overshoot, due to the reduced depolarizing effect of Ih. The hyperpolarization in turn deinactivates It and activates Ih, which depolarizes the membrane toward threshold for another calcium spike. (Modified from McCormick DA, Pape HC. Properties of a hyperpolarization-activated cation current and its role in rhythmic oscillation in thalamic relay neurones. J Physiol. 1990;431:291-318.) B: Delta oscillation of cat ventrolateral thalamocortical cell triggered by hyperpolarizing current pulses (0.7 nA in 1, 1 nA in 2, 1.1 nA in 3, and 1.2 nA in 4). Note increasing number of cycles at a frequency of 1.6 Hz. C: Latero-posterior (LP) thalamocortical cell after decortication of areas projecting to LP nucleus. The cell oscillated spontaneously at 1.7 Hz. A 0.5-nA depolarizing current (between arrows) prevented the oscillation, and its removal set the cell back in the oscillatory mode. Three cycles after removal of depolarizing current in 1 are expanded in 2 to show high-frequency bursts crowning the low-threshold calcium spike. In this and following figures, polarity of EEG and field potentials is as for intracellular recordings (positivity up). (Modified from Steriade M, Curró Dossi R, Nuñez A. Network modulation of a slow intrinsic oscillation of cat thalamocortical neurons implicated in sleep delta waves: cortically induced synchronization and brainstem cholinergic suppression. J Neurosci. 1991;11:3200-3217.) |
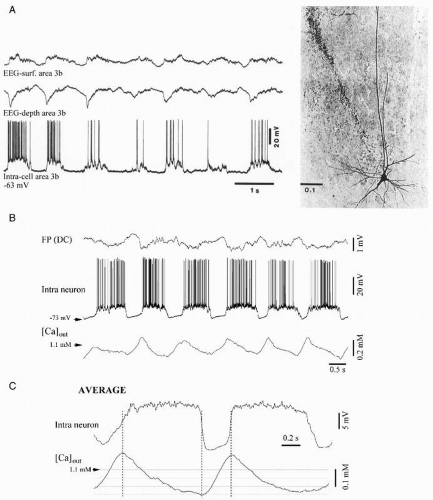 Figure 3.2 A: Pyramidal cell from the somatosensory cortex (area 3b) during the slow (<1 Hz) oscillation. The left panel shows intracellular recordings and simultaneously recorded EEG in the vicinity (˜1 mm) of the cell. The EEG was recorded by means of coaxial electrodes located on the surface and at a depth of approximately 0.6 mm. The cell oscillated at 0.9 Hz with depolarizing phases corresponding to depth-EEG negative (surface-positive) potentials. The right panel shows the corresponding cell stained with Neurobiotin (calibration bar in mm). (Modified from Contreras D, Steriade M. Cellular basis of EEG slow rhythms: a study of dynamic corticothalamic relationships. J Neurosci. 1995;15:604-622.) B: Fluctuations during the slow oscillation. Relationships between intracellular membrane potential, extracellular calcium [Ca]out, and field potential. Periodic neuronal depolarizations triggering action potentials were interrupted by periods (300-500 msec) of hyperpolarization and silenced synaptic activity. [Ca]out dropped by about 0.25 mM during the depolarizing phase reaching a minimum just before the onset of the hyperpolarization. Then, [Ca]out rose back until the beginning of the next cycle. C: Thirty cycles were averaged (spikes from the neuronal signal were clipped) after being extracted around the onset of the neuronal depolarization. The vertical dotted lines tentatively indicate the boundaries of the two phases of the slow oscillation (B-C modified from Massimini M, Amzica F. Extracellular calcium fluctuations and intracellular potentials in the cortex during the slow sleep oscillation. J Neurophysiol. 2001;85:1346-1350.). |
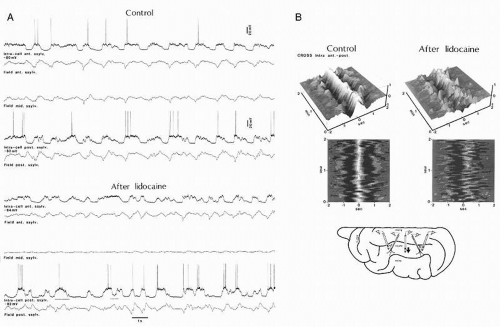 Figure 3.3 Effect of lidocaine inactivation on synchrony between intracellular activities and FPs. A: Double intracellular recording in the anterior and posterior parts of the suprasylvian gyrus (see scheme). Synchrony was present between all three recording sites. Intracortical injection of lidocaine (40 µL, 20%; bottom) inactivated the electrical activity close to the cannula in the middle part of the gyms, disrupted the synchrony between pools of neurons, and between individual neurons. B: Sequential correlation analyses of intracellular and field potential data. Two-minute periods were analyzed with the sequential correlation method. (Modified from Amzica F, Steriade M. Disconnection of intracortical synaptic linkages disrupts synchronization of a slow oscillation. J Neurosci. 1995;15:4658-4677.) |
Such cortical coherence is expected to equally involve the thalamus. Indeed, RE thalamic cells exhibit similar and timelocked variations of their membrane potential, with prolonged depolarizations interrupted by prolonged hyperpolarizations (34) in reflection of the excitatory cortico-RE projections. The depolarizing component in RE neurons is transmitted to thalamocortical neurons, via GABAergic projections, where it triggers rhythmic IPSPs, leading to rebound spike bursts (Fig. 3.4), which in turn will generate phasic excitations in the cortex, shaping the steady depolarization of cortical neurons.
The better comprehension of the mechanisms determining the pacing of the slow oscillations and the switch between depolarizing and hyperpolarizing phases came from experiments considering the possible dialogue between neurons and glial cells. Dual simultaneous intracellular recordings from neurons and adjacent glial cells were performed during sleeplike patterns produced by ketamine-xylazine anesthesia, exploring the possibility that glia may not only passively reflect, but also influence the state of neuronal networks (35, 36 and 37). The behavior of simultaneously recorded neurons and glia is illustrated in
Figure 3.5. During spontaneously occurring slow oscillations, the onset of the glial depolarization did, in the vast majority of the cases, follow the onset of the neuronal depolarization with an average time lag of around 90 msec (Fig. 3.5). This time lag is, however, longer than the one obtained from pairs of neurons (around 10 ms in Ref. 33). The glial depolarization reflects with virtually no delay the potassium uptake (38). As potassium is also continuously recaptured by neurons through Na+/K+-ATP pumps, the actual onset of the glial depolarization may thus mark the moment where the increase of extracellular potassium concentration exceeds the capacity of the neuronal pumps. This behavior suggests that glial cells are essential for maintaining extracellular potassium within controlled values.
Figure 3.5. During spontaneously occurring slow oscillations, the onset of the glial depolarization did, in the vast majority of the cases, follow the onset of the neuronal depolarization with an average time lag of around 90 msec (Fig. 3.5). This time lag is, however, longer than the one obtained from pairs of neurons (around 10 ms in Ref. 33). The glial depolarization reflects with virtually no delay the potassium uptake (38). As potassium is also continuously recaptured by neurons through Na+/K+-ATP pumps, the actual onset of the glial depolarization may thus mark the moment where the increase of extracellular potassium concentration exceeds the capacity of the neuronal pumps. This behavior suggests that glial cells are essential for maintaining extracellular potassium within controlled values.
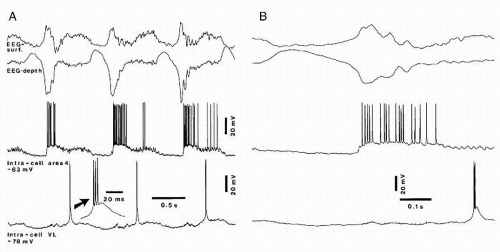 Figure 3.4 The slow oscillation (˜0.9 Hz) in dual simultaneous intracellular recordings from a regular-spiking cell in cortical area 4 and a thalamocortical cell in the ventrolateral nucleus. Cat under ketamine-xylazine anesthesia. Arrow in A points to a low-threshold spike burst. An expanded cycle is shown in B. Notes: (a) Depth-positive (upward) EEG waves are associated with hyperpolarization of cortical and thalamic cells, whereas the sharp depthnegatives are associated with depolarization and action potentials in cortical cell, while the thalamic neuron displays a rebound spike burst with a delay of 150-200 msec; (b) brief sequence of EEG spindles after depth-negative (surfacepositive) sharp deflection; and (c) fast depolarizing waves (40-50 Hz) in cortical neuron during the sustained depolarization. (Unpublished data by M Steriade and D Contreras.) |
Toward the end of the depolarizing phase, the glial membrane begins to repolarize before the neuronal membranes (Fig. 3.5) (37). Interestingly, this observation may expose the mechanism ruling the onset of the hyperpolarizing phase of the slow oscillation. It was initially proposed that this hyperpolarization relies either on active GABA inhibition or on the activation of slow calcium-dependent potassium currents. In the first case, the release of GABA by neurons would either depolarize glial cells through direct action on GABAA receptors (39,40) or indirectly through the potassium output resulting from the neuronal activation of neuronal GABAB receptors. The alternative implication of calcium-dependent potassium currents should be discarded because of the fact that the extracellular potassium starts to drop before the onset of the hyperpolarizing phase. In addition, the glial membrane potential returns to control value at the end of each of the recurring oscillatory cycles, leading to the assumption glial cells might control the pace of the oscillation through changes in the concentration of the extracellular potassium (38).
The overall synchronization of the slow oscillation in the cortex is also assisted by glial cells, which are imbedded in a gap junction-based network, through the phenomenon of spatial buffering (41, 42 and 43). Spatial buffering evens local increases of extracellular potassium by transferring it from the extracellular milieu to neighboring glial cells, then through gap junctions, and along the potassium concentration gradient, at more distant sites with lower concentrations of potassium, where it is again expelled in the extracellular space. This pathway is preferred to the direct one through the extracellular space because of the tortuosity of the latter (reviewed in Ref. 44). The relationship between intracellular glial potentials and extracellular potassium (38) shows little accumulation of potassium in the extracellular space (<1.1 mM/cycle), and this causes a minimal imbalance between the extra- and intracellular potassium concentrations. Given that normally glial cells deal with low amounts of potassium but have a high propensity to uptake it (43,45,48), it is likely that spatial buffering would occur at a reduced spatial scale, thus contributing to an uniform distribution of the potassium around the membrane of neurons (38).
The local spatial buffering during slow oscillations might play two roles: (i) it contributes to the steady depolarization of neurons during the depolarizing phase of the slow oscillation in a Nernst-related manner and (ii) it modulates the neuronal excitability. The latter mechanism could favor the synaptic interaction within cortical networks at the onset of the depolarizing phase of the slow oscillation, but it could equally
induce a gradual disfacilitation as the extracellular potassium reaches higher values toward the top of the glial depolarization. The amplitude of the potassium variations during the slow sleep oscillation ranges between 1 and 2 mM, which, when added to the physiologic values of resting concentration (˜3 mM), may assist cortical neurons in oscillating between hyper- and hypoexcitability (47, 48 and 49). This hypothesis was confirmed after testing the excitability of the neurons during the various phases of the slow oscillation cycle with cortical electric stimuli (37). The results demonstrate that the neuronal excitability is maximal toward the beginning of the depolarizing cycle and almost zero toward the end of the depolarizing phase of the slow oscillation.
induce a gradual disfacilitation as the extracellular potassium reaches higher values toward the top of the glial depolarization. The amplitude of the potassium variations during the slow sleep oscillation ranges between 1 and 2 mM, which, when added to the physiologic values of resting concentration (˜3 mM), may assist cortical neurons in oscillating between hyper- and hypoexcitability (47, 48 and 49). This hypothesis was confirmed after testing the excitability of the neurons during the various phases of the slow oscillation cycle with cortical electric stimuli (37). The results demonstrate that the neuronal excitability is maximal toward the beginning of the depolarizing cycle and almost zero toward the end of the depolarizing phase of the slow oscillation.
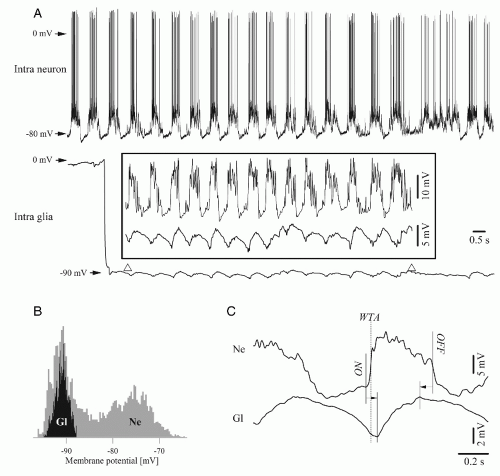 Figure 3.5 Simultaneous recording of a neuron-glia pair in the cortex of the cat during slow oscillatory patterns. A: Relationship between neuronal and glial depolarizations on the one hand, and between neuronal hyperpolarization and glial repolarizations on the other hand [(note enlargement within the box). The glial impalement occurred during this period of the recording and is depicted as a brisk drop of the potential from the extracellular (0 mV) to the intracellular (-90 mV) level. B: Histogram of membrane potential variations in the neuron (in gray) and glial cell (in black). C: Typical time relationship between the onset and offset moments of the two phases of a slow oscillatory cycle. Note that the onset of the depolarizing phase starts in the neuron, but that the end of this period is anticipated in the glia. (Modified from Amzica F, Massimini M. Glial and neuronal interactions during slow wave and paroxysmal activities in the neocortex. Cereb Cortex. 2002;12:1101-1113.] |
THE SLOW OSCILLATION AND THE K-COMPLEX
One of the functional correlates of the slow cortical oscillation is the fact that, at the EEG level, each sequence of depolarizing-hyperpolarizing episodes within an oscillatory cycle corresponds to a waveform called K-complex. Although the phenomenon was first described in 1938 as a landmark of slow-wave sleep (50), its study remained at the EEG level for decades (see the excellent review in Ref. 51) during which researchers struggled with the inherent shape variability introduced by various bipolar electrode configurations, reference systems, and filter settings. These technical difficulties, together with the relative vagueness of the definition, often led to discordant conclusions and to difficult interpretations. The cellular mechanisms of the K-complex were only recently described (52) and disclosed that the K-complex is a recurrent event with the rhythmicity of the slow oscillation (less than but close to 1 Hz) and that, through its shape, it is one of the main contributors to the delta spectrum (Fig. 3.6) (21,35).
The rhythmicity of K-complexes during the onset of sleep is less obvious due to the lesser organization of the slow oscillation. This corroborates with the fact that bipolar recordings are often the only ones allowing the detection of K-complexes in the initial part of slow-wave sleep. However, with the deepening of sleep, the slow oscillation becomes more regular and faster (the frequency approaches 1 Hz). During late stages of sleep most of the K-complexes may be confounded with delta waves. The frequency shift (usually from 0.6 to 0.9 Hz) of the slow oscillation, as well as the shape modification of the K-complex (Fig. 3.7), accompanying the deepening of sleep can be explained by taking into account the intrinsic properties of the
neuronal membrane. At sleep onset, neurons in the midbrain reticular formation and mesopontine cholinergic nuclei diminish their firing rate (53,54), thus removing a steady excitatory drive from thalamocortical neurons and allowing the membrane potential of cortical neurons to reach more hyperpolarized levels. The progressive hyperpolarization of thalamocortical neurons is a constant correlate of sleep deepening (55) and induces a gradual reduction of the duration of the depolarizing phase of the slow cortical oscillation together with the acceleration of the rhythm. The former action contributes mostly to the shape of the field potentials, while the second determines the oscillatory frequency.
neuronal membrane. At sleep onset, neurons in the midbrain reticular formation and mesopontine cholinergic nuclei diminish their firing rate (53,54), thus removing a steady excitatory drive from thalamocortical neurons and allowing the membrane potential of cortical neurons to reach more hyperpolarized levels. The progressive hyperpolarization of thalamocortical neurons is a constant correlate of sleep deepening (55) and induces a gradual reduction of the duration of the depolarizing phase of the slow cortical oscillation together with the acceleration of the rhythm. The former action contributes mostly to the shape of the field potentials, while the second determines the oscillatory frequency.
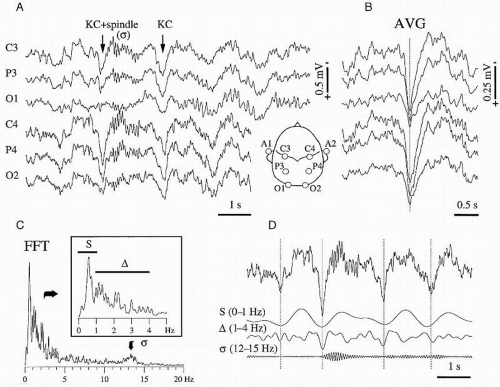 Figure 3.6 K-complex in human sleep. Scalp monopolar recordings with respect to the contralateral ear (see figurine). A: Short episode from a stage 3 period of sleep. The two arrows point to a K-complex (KC) followed by a spindle sequence (σ) and to a KC in isolation. The two K-complexes are embedded into a slow oscillation at about 0.6 Hz. Note the synchrony of K-complexes in all recorded sites and the diminution of their amplitudes in the occipital area. B: Average of 50 K-complexes aligned on the positive peak (in this figure positivity is downwards) of the upper channel (vertical dotted line). C: Power spectrum of the C3-lead for a period of 80 seconds of stable stage 3 activity containing the period depicted in A. The three frequency bands (S, Δ, and σ; further illustrated in D) are represented in the power spectrum. Moreover, the slow (S) activity displays a high peak, distinct from the onset of delta (Δ) activity (see inset). D: Frequency decomposition of the C3-lead (upper trace) into three frequency bands: slow (S, 0-1 Hz), delta (Δ, 1-4 Hz), and sigma (σ, 12-15 Hz). It is shown that the K-complex results from a combination of slow and delta waves. (Modified from Amzica F, Steriade M. The K-complex: its slow (<1-Hz) rhythmicity and relation to delta waves. Neurology. 1997;49:952-959.) |
Due to the controversial criteria for shape recognition, the study of K-complexes has relied mostly on evoked K-complexes because stimulation generally produces stereotyped responses. Although of certain experimental value, the evoked K-complexes have set a bias in the understanding of the underlying mechanisms because it was forgotten that the K-complex is mainly a spontaneous phenomenon (50). The comparison at the cellular level between spontaneous and evoked K-complexes shows, in agreement with the original observation of Davis et al. (56), that the latter appears as a secondary discharge. Both spontaneous and evoked K-complexes display similar depth profiles and current source density (CSD) distributions
(52), further supporting their common origin and generating mechanisms.
(52), further supporting their common origin and generating mechanisms.
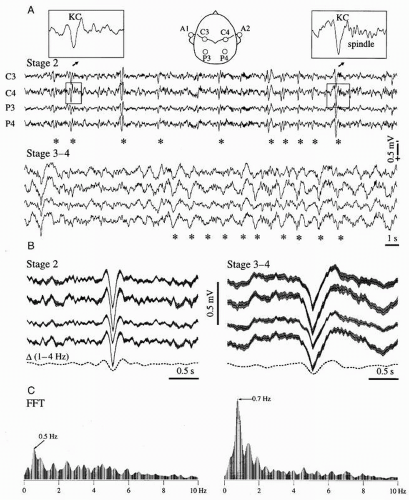 Figure 3.7 Rhythmic KCs in human EEG during natural slow-wave sleep. A: Four leads recorded from the two hemispheres during stage 2 sleep show quasirhythmic (around 0.5 Hz) KCs. The expanded insets display a simple K-complex (KC, left) and a K-complex followed by a spindle (right). Stage 3-4 EEG (below) is characterized by a more regular oscillation of the K-complexes (0.7 Hz). Asterisks mark the most obvious K-complexes in order to suggest their rhythmicity. B: Averaged K-complexes (n = 200) from stages 2 (left) and 3-4 (right). The gray surface around the averaged K-complexes covers the standard deviation. The lowest trace (dotted line) results from the filtering of the average K-complex in the delta band (1-4 Hz). C: Power spectra of 2-minute epochs containing the ones displayed above. Note a principal peak at 0.5 Hz for the stage 2 episode (left), surrounded by other lower peaks as evidence for distributed rhythmicity. At variance, deep sleep shows a dominant peak at 0.7 Hz. The two FFT graphs are scaled with the same ordinate. (Modified from Amzica F, Steriade M. The K-complex: its slow (<1-Hz) rhythmicity and relation to delta waves. Neurology. 1997;49:952-959.) |
The complex electrographic pattern of slow-wave sleep results from the coalescence of the slow oscillation with sleep spindles (see below) and, possibly, thalamic delta oscillations (57). The weight of each of these major components is dynamically modulated during sleep by synaptic coupling, local-circuit configurations, and the general behavioral state of the network. The discussion of the functional significance of the K-complex is determined by the role of the slow sleep oscillation of which the K-complex is the electrographic reflection. Through its rhythmic occurrence at a frequency that is lower than the one of other sleep rhythms (spindles and delta), and due to its wide synchronization at the cortical level, the sharp onset of the K-complex provides a synchronous input to thalamic neurons, thus triggering and/or grouping sequences of spindles or delta oscillations.
THETA RHYTHMS
Theta waves are usually defined as occurring within the 4- to 7-Hz frequency range. The normal theta activity should not be confused with pathologic theta waves, described as a slowing down of alpha activity, expressed during cerebral blood flow reduction (58) or metabolic encephalopathies (59). Rhythmic activities in the theta frequency range are conspicuous in limbic areas in various animal species as extensively reviewed by Buzsáki (60).
Limbic Theta Rhythms in Humans
The presence of theta rhythms was first denied in humans (61,62), but they were later recorded in the hippocampus of epileptic patients with indwelling electrodes (63, 64 and 65) or by way of mesio-temporal corticography with foramen ovale electrodes (66), and also using magnetoencephalography (MEG) in normal subjects (67,68). In all these studies human hippocampal theta rhythm was studied under specific behavioral conditions. In the study of Arnolds et al. (69) the hippocampal activity was recorded while the subject was freely moving and performing a cognitive task; the frequency and rhythmicity of the hippocampal theta component while the subject was writing was consistently higher than while sitting or walking. In a word association task the amplitude, frequency, and rhythmicity showed a significant rise during the period of silent mental activity immediately following a verbal cue to which the subject was requested to give a verbal answer. Ekstrom et al. (65) found evidence for movement-related theta oscillations in human hippocampus and suggested that both cortical and hippocampal oscillations play a role in attention and sensorimotor integration. Kahana et al. (64) investigated hippocampal EEG activity using subdural recordings from epileptic patients during spatial navigation in computer-generated mazes and found that theta rhythmic activity occurred more frequently when the subject was confronted with solving complex mazes. In addition, theta oscillations were more evident during recall trials than during learning trials. Bódizs et al. (66) recorded in the human hippocampus a rhythmic activity with frequency at the lowest end of the theta frequency range that presented larger power spectrum during rapid eye movement (REM) sleep than during other states and suggested that this oscillation may be considered the counterpart of the hippocampal theta of mammalian REM sleep. Tesche and Karhu (67) recorded MEG signals in human subjects and reconstructed from these signals the corresponding hippocampal sources of theta rhythmic activity. They reported that during the presentation of a memory task the duration of theta bursts increased with memory load and suggested a relation between “stimulus-locked hippocampal theta” and the processing of working memory. Using a wholehead 275-channel MEG system in normal subjects, Cornwell et al. (68) reported hippocampal and parahippocampal theta oscillations during a spatial navigation task (virtual reality Morris water maze). They carried out source analyses by means of which they were able to show larger theta activity in the left anterior hippocampus and parahippocampal cortices during goal-directed navigation relative to aimless movements. Thus, similar to other species (see below), the human theta may represent a dynamic state emerging from hippocampal networks engaged in spatial navigation and in memory processes.
Limbic Theta Rhythms in Animals
Stewart and Fox (69), working on urethane-anesthetized primates, recorded hippocampal theta activity similar to that of rats but at a slightly higher frequency and appearing as relatively short bursts. Arnolds et al. (63) made a comparative study of hippocampal theta rhythms in cat, dog, and human and showed that all three displayed the same type of qualitative changes in spectral parameters (peak frequency, peak amplitude, and rhythmicity) in relation to behavioral tasks involving motor activities. Particularly in cat, remarkable relationships between theta spectral properties and vestibular stimulation (e.g., body acceleration) and/or eye movements were put in evidence. Theta rhythms appear conspicuously in rodents such as rabbits (first description of the rhythm was made by Green and Arduini (70)) and rats in relation with sensory processing and different types of movements (71) and have been recorded in several structures of the cortical limbic system (72,73). Depending on species and conditions, these rhythmic may extend from 3-4 to 10 Hz, which is somehow larger than the conventional range of the EEG theta rhythm (4 to 7 Hz). This is the reason why these limbic theta oscillations are also named “rhythmic slow activity (RSA)” in animal neurophysiology to avoid confusion with the classic human EEG theta frequency band. The two designations are commonly used in the literature.
In the rat, theta oscillations are most regular in frequency and present the largest amplitude in the stratum lacunosum-moleculare of the hippocampal CA1 region but are also found in the dentate gyrus and the CA3 region. In addition to the hippocampal formation, theta oscillations have been observed in the subiculum, entorhinal cortex, perirhinal cortex, amygdala, and cingulate cortex (74). Although these areas are capable of displaying theta oscillations that can be recorded extracellularly, they are not able to generate theta activity on their own, that is, isolated from the rest of the brain, unless manipulated by intracellular current injection or by the addition of pharmacologic
substances. In this respect it is interesting to mention that neurons of several limbic structures have intrinsic membrane properties that might facilitate their entrainment in theta oscillations as shown in vitro. This was demonstrated for some types of CA1 interneurons depolarized near spike threshold by current injection that generated rhythmic firing at about 7 Hz (75) and also for neurons of the perirhinal cortex that can display oscillations around 8 to 9 Hz when depolarized at threshold levels (76). These intrinsic properties could facilitate the entrainment of these neurons in theta frequency oscillations.
substances. In this respect it is interesting to mention that neurons of several limbic structures have intrinsic membrane properties that might facilitate their entrainment in theta oscillations as shown in vitro. This was demonstrated for some types of CA1 interneurons depolarized near spike threshold by current injection that generated rhythmic firing at about 7 Hz (75) and also for neurons of the perirhinal cortex that can display oscillations around 8 to 9 Hz when depolarized at threshold levels (76). These intrinsic properties could facilitate the entrainment of these neurons in theta frequency oscillations.
Theta Rhythm Generation
Since the early years of this research line several studies were carried out with the aim of finding a system that may act as theta “pacemaker.” The search for a theta pacemaker has led to controversial results: first it was claimed that the medial septo/diagonal band-hippocampal cholinergic system, driven by the brainstem reticular core, is the “pacemaker” of theta (77,78). The medial septum provides cholinergic and GABAergic input to the hippocampus. While cholinergic neurons innervate both principal cells and interneurons, GABAergic projection neurons from the medial septum make synapses on hippocampal interneurons, including parvalbumin-positive basket cells (79).
More recent investigations revealed that hippocampal interneurons with long-range projections also innervate the cells of origin in the medial septum. Further, the supramammillary nucleus of the hypothalamus strongly connected to the medial septum, and to extended networks of the brainstem and diencephalon, has also been proposed to play a role in pacemaking and modulating hippocampal theta (80).
The fact that theta rhythms survive after the blockade of cholinergic muscarinic inputs from the septal area using atropine brought to the fore the existence of an additional noncholinergic source of theta activity in the entorhinal cortex (81). Indeed, a dipole of theta activity was found also in the entorhinal cortex with two amplitude maxima, one superficial in layers I-II and the other in layer III (82, 83, 84 and 85). We may conclude that the classic view of a septal/diagonal band pacemaker impinging rhythmic activity on the pyramidal cells of the hippocampus, within the theta frequency band, is too simplistic.
Many investigations analyzed the characteristics of the two types of hippocampal theta: one atropine-sensitive and the other atropine-resistant (86). Removal of the entorhinal cortex makes hippocampal theta atropine-sensitive, so that it may be concluded that the atropine-resistant theta originates from the entorhinal inputs to the hippocampus (81,87). These inputs are glutamatergic and it was shown that NMDA synapses on the distal apical dendrites of CA1 pyramidal neurons are important sources of theta-generating inputs (73). Which pathways are responsible for the atropine-sensitive theta component is still unclear despite many investigations using sophisticated methods such as high-density 96-site silicon probes enabling recordings simultaneously from the dentate gyrus, CA3 and CA1 areas (88).
Cholinergic inputs can cause excitation of interneurons that may be responsible for theta rhythmic discharges of hippocampal interneurons (79,89). These interneurons, discharging at the theta frequency, can thus cause rhythmic IPSPs on their target pyramidal cells. Consequently somatic outward currents at the level of the CA1 pyramidal layer can contribute to the theta extracellular field (81,90). Further cholinergic agonists applied to hippocampal slices cause rhythmic depolarizations of lacunosum-moleculare interneurons at the theta frequency, which are blocked by atropine (91). This indicates that muscarinic induction of theta-frequency membrane potential oscillations in lacunosum moleculare interneurons may contribute to the generation of rhythmic inhibition that paces intrinsically generated theta activity in CA1 pyramidal cells. In addition, the CA3 can also contribute to the generation of theta field potentials, since the recurrent network of CA3 pyramidal cells, and possibly hilar mossy cells, may form an intrahippocampal oscillator that may contribute to the atropine-sensitive component (73).
A classic view (92) is that hippocampal CA1 extracellular field during theta can be accounted for by a two-dipole model. According to this view the CA1 pyramidal cells receive rhythmic inputs in the theta frequency range from other sources that consist of atropine-sensitive and atropine-resistant inputs. The former would drive the somata and the latter the distal dendrites. The atropine-sensitive theta rhythm would be mainly caused by Cl–-mediated IPSPs on pyramidal cells (93,94). Further intrinsic voltage-dependent membrane potential oscillations may modulate the response to a theta frequency driving, although hippocampal pyramidal neurons do not oscillate in isolation (60). They show, however, in vitro, resonant properties in the theta frequency range that are determined by the interplay between two main ionic currents with different kinetics, the Ih and Im currents. The former is a hyperpolarization-activated cation current and the latter is a muscarinic K+ current. In contrast, neurons of the entorhinal cortex layer II show subthreshold oscillations at the theta frequency that appear to result from the interplay of the Ih and the depolarization-activated persistent Na+ current (60).
Related posts:
 Analog Signal Recording Principles
EEG of Degenerative Disorders of the Central Nervous System
Metabolic Disorders and EEG
Anticipating Seizures Based on EEG
Intracranial Monitoring: Depth, Subdural, and Foramen Ovale Electrodes
EEG Event-Related Desynchronization (ERD) and Event-Related Synchronization (ERS)
Analog Signal Recording Principles
EEG of Degenerative Disorders of the Central Nervous System
Metabolic Disorders and EEG
Anticipating Seizures Based on EEG
Intracranial Monitoring: Depth, Subdural, and Foramen Ovale Electrodes
EEG Event-Related Desynchronization (ERD) and Event-Related Synchronization (ERS)
Stay updated, free articles. Join our Telegram channel

Full access? Get Clinical Tree


